Article
J. Braz. Chem. Soc., Vol. 23, No. 9, 1606-1613, 2012. Printed in Brazil - ©2012 Sociedade Brasileira de Química 0103 - 5053 $6.00+0.00
A
*e-mail: [email protected]
Emission Profiles of Carbonyl Compounds at a Brazilian Charcoal Plant
Daniela S. Anunciação,a Eliane T. Sousa,a Albertinho B. de Carvalhob and
Pedro A. P. Pereira*,a,c,d
aInstituto de Química, Universidade Federal da Bahia, Campus Universitário de Ondina,
40170-290 Salvador-BA, Brazil
bFundação Jorge Duprat Figueiredo de Segurança e Medicina do Trabalho (Fundacentro),
40210-730 Salvador-BA, Brazil
cCentro Interdisciplinar de Energia e Ambiente (CIEnAm), 40210-630 Salvador-BA, Brazil
dInstituto Nacional de Ciência e Tecnologia de Energia e Ambiente, 40170-115 Salvador-BA, Brazil
A indústria siderúrgica brasileira consome grandes quantidades de carvão vegetal. As carvoarias são responsáveis por emissões atmosféricas de compostos orgânicos voláteis tais como compostos carbonílicos (CC). Neste trabalho, foram determinados o perfil e as concentrações de CC em fase vapor durante a produção de carvão vegetal a partir de eucalipto. As amostras foram coletadas próximas aos fornos, em cartuchos de sílica revestidos com 2,4-dinitrofenilidrazina e, em seguida, extraídas e analisadas por HPLC-DAD-MS (cromatografia líquida de alta eficiência acoplada a detector de arranjo de diodo e espectrômetro de massas). Doze CC foram identificados e quantificados, entre eles acetaldeído e os pares coeluídos furfural/propanal, acroleína/propanona e 2-pentenal/pentanal. Estes três pares tiveram seus picos resolvidos por meio de espectrometria de massas para doze amostras e individualmente quantificados. Os perfis obtidos indicaram uma maior abundância do par furfural/propanal nas três fases de carbonização, seguido do acetaldeído na primeira fase e do 2-oxobutanal nas segunda e terceira fases. Furfural/propanal e acetaldeído se destacaram dentre os CC determinados nas proximidades dos fornos, com concentrações médias de 4948 e 2558 µg m-3 e concentrações máximas de 11655 e 4805 µg m-3, respectivamente.
Brazilian steel industry consumes huge amounts of charcoal. The charcoal plants are responsible for atmospheric emissions of volatile organic compounds such as carbonyl compounds (CC). In this work, the profile and the concentrations of CC in the vapor phase were determined during the charcoal production from eucalyptus. Samples were collected near kilns on silica cartridges coated with 2,4-dinitrophenylhydrazine, and then extracted and analyzed by HPLC-DAD-MS (high performance liquid chromatography coupled with diode array detector and mass spectrometry). Twelve CC were identified and quantified, amongst them acetaldehyde and the co-eluting acrolein/ propanone, furfural/propanal and 2-pentenal/pentanal pairs. These three pairs were peak resolved by mass spectra for twelve samples and thus individually quantified. The profiles obtained indicated the furfural/propanal pair as the most abundant in all three carbonization stages, followed by acetaldehyde in the first stage and 2-oxobutanal in the second and third stages. Furfural/propanal and acetaldehyde stood out among CC determined near the kilns, with average concentrations of 4948 and 2558 µg m-3 and maximum concentrations of 11655 and 4805 µg m-3, respectively.
Keywords: charcoal production, wood burning, carbonyl compounds, emission profiles, HPLC-DAD-MS
Introduction
Brazilian steel industry is an important economic sector which consumes huge amounts of charcoal for producing
pig iron. In order to meet their needs, many manufacturers have their own charcoal plants. The emissions from the wood burning process contain hundreds of chemical compounds, such as monosaccharide derivatives, aliphatic and aromatic
hydrocarbons and oxygenated compounds,1 which can be
these compounds, the volatile organic compounds (VOC) and, specially, carbonyl compounds (CC), play an important role.
Volatile organic compounds have been recognized as one of the principal trace constituents in the atmosphere
since they play important roles in atmospheric chemistry.2-4
These compounds are of great concern not only because they are ozone precursors, but also because some of them
are carcinogenic chemicals.5 The carbonyl compounds have
been attracting much attention because of their adverse
health effects.6 These compounds are also acknowledged to
be harmful organic pollutants, which exist in the atmosphere as a result of discharge from sources, such as exhaust gases from motor vehicles, industrial activities and biomass burning, as well as reaction products of the atmospheric oxidation of anthropogenic hydrocarbons and other VOC. In the meantime, several works have been carried out for the determination of carbonyl compounds in gaseous samples
using chromatographic techniques.7-9 The role of CC in the
atmospheric chemistry is mainly due to the strong influence they have on the photochemical reactions, which lead to the formation of important air pollutants, such as ozone,
nitric acid and peroxyacilnitrates.10-12
Natural sources also contribute to the atmospheric concentrations of several CC, through biogenic emissions of some plants and photochemical oxidation of naturally
emitted hydrocarbon precursors.13
Many CC are classified as toxic air pollutants. The National Institute for Occupational Safety and Health (NIOSH) and the International Agency for Research on Cancer (IARC) classify formaldehyde as a human carcinogen. Acetaldehyde is also reported to be possibly
carcinogenic to humans.14 Other CC, e.g., acrolein, can
cause eye irritations, unpleasant odors and exacerbate
asthma.14-16 Exposure to these pollutants is harmful to
materials, workers and public health in general.17
Several methods have been proposed for the
determination of CC in air.18 The most popular today involves
the reaction with acidified 2,4-dinitrophenylhydrazine (DNPH) adsorbed on silica cartridges, which converts
carbonyl compounds into stable hydrazones.19 After
collection, the latter are extracted from the cartridge with an appropriate solvent (e.g., acetonitrile) and analyzed by HPLC coupled to UV-Vis or diode array detector
(DAD).18,20-23 More recently, mass spectrometry has been
used as the detection system since it allows to identify the resolved compounds and also permits a spectral separation
of unresolved peaks.24-27
Due to the role that CC play in the composition and reactivity of the atmosphere of wood burning places, there is an unquestionable need for more field-based studies and
a better understanding of their emission profiles and
concentrations in the charcoal production plants.28
The aim of this study was, thus, to identify and quantify carbonyl compounds emitted by eucalyptus burning during the charcoal production cycle at a charcoal plant, as well as to determine their emission profiles at different stages of the carbonization process.
Experimental
Chemicals
All the chemicals employed in this study were either of analytical or spectroscopic/chromatographic g r a d e s . S o l i d 2 , 4 - d i n i t r o p h e ny l h y d r a z i n e a n d 2,4-dinitrophenylhydrazone standards of formaldehyde, acetaldehyde, acrolein, propanone, propionaldehyde, cyclopentanone, isobutyraldehyde, benzaldehyde, 2-pentenal and 2-ethyl-hexanal were acquired from Sigma-Aldrich (St. Louis, USA). Acetonitrile and methanol were acquired from J. T. Baker (Philipsburg, USA). Water was distilled in the laboratory and treated for removal of organic contaminants in a Barnstead NanoPure Diamond water purification system (Barnstead, Iowa, USA).
Cartridge preparation
Sep-Pak C18 cartridges (Waters, Milford, USA) were
impregnated as described in the literature.10,28,29 Briefly, the
cartridges were conditioned with acetonitrile (4 mL) and then impregnated with 3 mL of an acidic solution of 2,4-DNPH (0.3 %). After this, cartridges were dried for 5 min under a gentle stream of Ultra Pure grade nitrogen, with a 2,4-DNPH coated cartridge connected in tandem to prevent contamination during the preparation. The dried cartridges were end capped, wrapped in Teflon tape and aluminum foil, placed in hermetically sealed plastic bags and stored under refrigeration. Cellulose filters coated with 2,4-DNPH solution were placed inside the plastic bags
to trap any CC present in the air.28
Sampling
The samples were collected from a charcoal plant located about 134 km far from Salvador City, Bahia State, in Eastern Brazil. The charcoal production was based on a craft process by burning eucalyptus in brick kilns. During the sampling period, the plant had in average fifteen kilns operating for burning wood and a daily production of
about 160 kg, equivalent to 1 m3 of charcoal. Samplings
9.00 am to 4.00 pm. During the sampling periods, the average temperature and relative humidity were 30 °C and 60%, respectively.
The samples were collected downwind, at a height of 1.6 m from the ground. In order to establish the CC emission profiles at different carbonization stages, twenty seven samples were collected for 60 min at a distance of 0.4 m from kiln chimneys burning at different stages.
These stages can be characterized by the color of the emitted smoke during carbonization. In the first stage, which lasts on average two days, the smoke is white and is in general associated to the light compounds and to high water content. In the second stage, which lasts on average three days, the smoke is brown. In the third and final stage, lasting three days on average and characterized by emission of compounds such as PAH (polycyclic
aromatic hydrocarbons), it has a blue color.30 The total
duration of the carbonization cycle will depend on several conditions, such as the age of the tree and the wood moisture content.
Therefore, one sampling system was directly placed in front of the white smoke of a kiln chimney (total of 11 samples), while the second and third systems were directly placed, respectively, in front of brown (total of
10 samples)and blue smokes (total of 6 samples). Another
set of samples was taken to evaluate the effect of the distance from the source on the atmospheric concentrations of CC. In this case, twenty samples were collected, in parallel, at distances of 0.4 and 2.0 m from a same group of kilns.
CC in the vapor phase were collected on two serially
connected 2,4-DNPH-impregnated Sep-Pak C18 cartridges,
at a flow rate of 0.1 L min-1. After sampling, the cartridges
were end capped, wrapped with Teflon tape and aluminum foil and stored in hermetically closed plastic bags under refrigeration until elution. To evaluate possible contaminations during sampling and storage, three laboratory blank cartridges and three field blank cartridges were analyzed for each sampling day. No carbonyl compound above the limits of detection of the method was found in any of these cases.
CC analysis
The CC-hydrazones were separated and quantified using an LC-DAD system (Agilent 1100) coupled to a mass spectrometer (Bruker Daltonics Esquire 3000 Plus). MS analyses were performed in the negative mode and with an ESI (electrospray ionization) interface. The MS conditions were as follows: drying gas temperature of 250 ºC,
drying gas flow rate of 10 L min-1, nebulizer pressure of
22 psi and capillary voltage of 4000 V. Aliquots (5 µL)
of samples were injected and separated in a C18 column
(250 mm × 2.1 mm × 3.5 µm, X-Terra MS; Waters, USA)
at a flow rate of 0.4 mL min-1. The mobile phases were
water (A) and acetonitrile (B), and the gradient elution conditions were: 40% B (hold for 15 min), 40 to 100% B (4 min), 100% B (hold for 3 min) and 100 to 40% B (3 min).
CC were identified by comparing the retention times of unknown peaks in the sample chromatograms with those of authentic standards of the CC hydrazones, followed by
confirmation of the [M − 1]− ion in their mass spectra. In
the case of pentanal, furfuraldehyde and 2-oxobutanal,
the identification was based in the [M − 1]− ion of their
mass spectra and also by previous works,28,31 which
similarly identified the presence of the last two CC in high concentrations during the burning of eucalyptus.
The quantification was performed by the external calibration method, using the chromatograms obtained at 365 nm with the DAD detector. The calibration curves were
built in eight levels, ranging from 10 to 600 µg L-1. Results
reported for 2-oxobutanal were directly estimated from the calibration curve of isobutanal, considering that both are
C4 aldehydes and because no standard of the first one was
available in our laboratory during this study.
Figures of merit
The calibration curves built for the CC quantification in this work showed a good linearity in the concentration
range between 10 and 600 µg L-1 and presented correlation
coefficients between 0.9934 and 0.9999. The limits of detection and quantification are shown in Table 1.
Results and Discussion
Identification of CC
Twelve carbonyl compounds were identified in samples collected near sources and in different stages of carbonization, namely: formaldehyde, acetaldehyde, 2-oxobutanal, acrolein/propanone, furfuraldehyde,
propanal, cyclopentanone, C4 isomers, benzaldehyde and
2-pentenal/pentanal. Table 1 lists CC, together with their
respective retention times (tr) and the [M − 1]− ions that
were used for their identification. Amongst the CC listed, cyclopentanone, benzaldehyde, acrolein and 2-pentenal had
not been identified in our previous study.28
CC emission profiles according to the carbonization stage
levels, may be important issues when the health of charcoal workers needs to be considered.
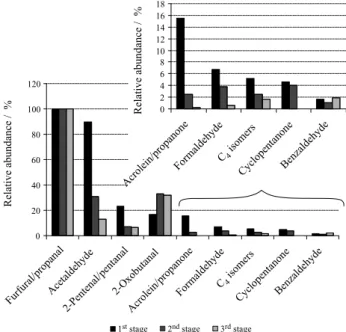
At this sampling step, the migration of CC to the second cartridge was observed for all samples possibly due to the high temperatures and humidity of the smoke near the kilns. However, in all cases, the amounts determined in the second cartridge were much smaller than in the first, and so the calculations were based on the sum of the two cartridges, for all samples. Figure 1 in the bellow part shows the relative abundances, in each carbonization stage, of the set of twelve CC determined. The abundances are
normalized in relation to the furfural/propanal pair, which assumed a value of 100 in the scale since it was the most abundant in all three stages.
The furfural/propanal pair showed the highest abundances in all three carbonization stages, with average
concentrations of 5399, 8469 and 13244 µg m-3 in the
first, second and third stages, respectively. In the first
stage, it was followed by acetaldehyde (4842 µg m-3 and
89.7% of relative abundance), 2-pentenal/pentanal
(1259 µg m-3 and 23.3%), 2-oxobutanal and acrolein/
propanone (839 µg m-3 and 15.5%). The second stage
also showed a significant abundance of acetaldehyde
(2611 µg m-3 and 30.8% of relative abundance), although
it was lower than those of the 2-oxobutanal, which was the
second most abundant CC in the second (2777 µg m-3 and
32.8%) and third (4191 µg m-3 and 31.6%) carbonization
stages. The relative abundances of acrolein/propanone and formaldehyde were very low in the third stage (0.2 and 0.6% respectively), while cyclopentanone was not detected.
Acrolein, cyclopentanone and 2-pentenal were detected in the present work, although they were not found in
our previous study28 also carried out at a charcoal plant.
Other CC, whose presence was initially suspected but not
previously confirmed,28 such as propanal and benzaldehyde,
were now confirmed by mass spectrometry. Nevertheless, it should be noted that the two studies were conducted at different conditions: in the previous study, samples were collected at circulation areas about 2 m from kilns and also in the worker breathing zone, while in the present one they were collected 0.4 m from kilns and as closer as possible from the generated smoke. Besides, the analyses Table 1. CC identified, along with the retention times (tr), [M − 1]− ions and limits of detection (LOD) and quantification (LOQ) of their respective
hydrazones obtained using UV detection
CC tr / min [M − 1]−m/z LOD / (µg L-1) LOQ / (µg L-1)
Formaldehyde 5.2 209 4.7 15.7
Acetaldehyde 6.4 223 3.7 12.4
2-Oxobutanal 6.7 265 6.9a 17.3a
Propanone 7.7 237 1.8 6.2
Acrolein 7.7 235 1.8 6.2
Furfuraldehyde 8.0 275 −b
−b
Propanal 8.0 237 3.6 12.0
Cyclopentanone 9.4 263 6.5 21.8
C4 isomers 9.6 251 6.9a 17.3a
Benzaldehyde 10.1 285 8.0 26.7
2-Pentenal 10.4 263 8.1 26.9
Pentanal 10.4 265 −b −b
aLOD and LOQ based on the calibration curve of isobutanal; bLOD and LOQ were not calculated since no standards of this CC were available in the LPQ
(Laboratorio de Pesquisa e Desenvolvimento em Química, Universidade Federal da Bahia).
Figure 1. CC emission profiles in the three carbonization stages of eucalyptus, based on the average (11 samples on the 1st stage, 10 on the
of CC were done according to different chromatographic
methods and columnsand also using an MS detector in
addition to the DAD.
In another work about biomass burning with different
kinds of wood,31 the CC formaldehyde, acetaldehyde,
propanal, propanone, acrolein, pentanal, C4 isomers,
benzaldehyde, 2-oxobutanal and furfural were also found, not only in the gas phase of eucalyptus burning, but also in the gas phase of pine and oak burning in residential
fireplaces.31 Although they have reported the presence
of glyoxal, methyl glyoxal and crotonaldehyde in the
eucalyptus smoke, those compounds were not identified
in the samples collected in our study, which may be due to the different conditions applied in each burning process, such as the combustion temperatures, the available oxygen
concentrations, the duration of the process1,31 or even to the
analytical procedures applied in each case.
In another study developed with different kinds of wood, classified as softwoods, hardwoods and synthetic logs, used in both fireplaces and wood stoves, acetaldehyde,
propanone, propanal, acrolein, C4 isomers, pentanal and
furfural, among other compounds, were also identified. While acetaldehyde, furfural, propanal and acrolein were the most abundant CC in the smoke emitted from hardwood
burning in fireplaces, formaldehyde, propanone, C4
isomers and pentanal predominated in the smoke emitted
from softwood burning in wood stoves.32
Effect of the source distance on the measured CC concentrations
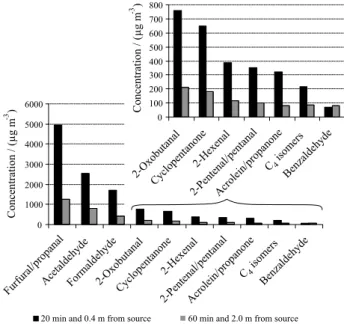
To evaluate the effect of the source distance on the measured CC concentrations, other samples were simultaneously collected at distances of 2.0 and 0.4 m from a same set of kilns, burning at the three different stages.
The sampling flow rate was set at 100 mL min-1 for both
distances and sampling times of 60 and 20 min were chosen for samples collected at 2.0 and 0.4 m, respectively. The difference in sampling times was necessary in order to avoid breakthrough in the cartridges collected nearer to the source. Figure 2 shows the CC concentrations measured in the two sampling conditions. The results were averaged (n = 10) for the two sets of samples. The highest concentration levels were found for the furfuraldehyde/propanal pair
(4948 ± 3408 µg m-3), followed by significantly lower,
albeit still quite high, concentrations of acetaldehyde
(2558 ± 926 µg m-3), formaldehyde (1697 ± 789 µg m-3)and
2-oxobutanal (762 ± 787 µg m-3).
Figure 2 also shows that the CC concentrations were up to five-fold lower at the collection point more distant from the source than that found near the kilns. This may
be due not exclusively to a dilution effect over the samples, as they are dispersed in the atmosphere, but also possibly to the mass transport of CC from the gas to the particulate phase. The air temperatures quickly decrease (from ca. 55 to ca. 35 °C) with the increase of the distances from the source, so CC in the vapor phase that move away from the source can partially condensate and be adsorbed onto the surface of particles that are also formed during the wood burning. This can decrease their concentration in the vapor phase. Nevertheless, it should be noted that, despite the differences in absolute concentrations, the profiles obtained were found to be quite similar in the two conditions. This decrease 2.0 m away in the CC concentrations from sources may be an important issue for the workers daily exposed to the wood smoke.
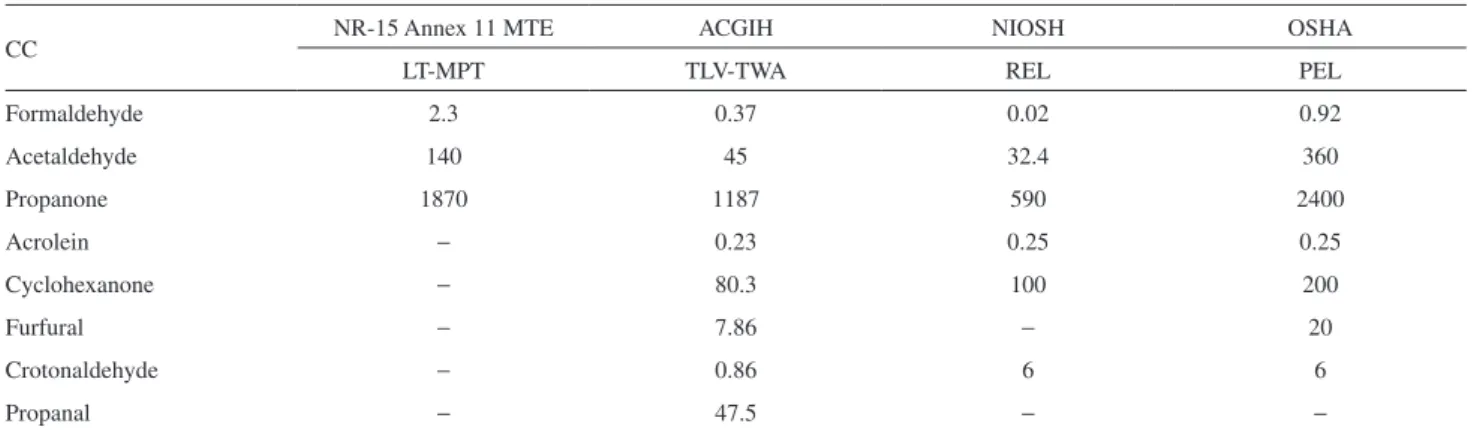
In order to characterize a workplace as an unhealthy environment, considering work journeys up to 48 h weekly, the limits of tolerance for CC are generally established as time weighted average values. Brazilian legislation, according to the annex No. 11 of the regulatory norm No. 15 of the Ministry of Labor and Employment (MTE), establishes reference values for the air quality in terms of three CC. Also, the American Conference of Governmental Industrial Hygienists (ACGIH) establishes threshold values for eight CC identified in this work, including those listed in the regulatory norm No. 15 of MTE. Table 2 shows the exposure limits established by four different regulatory agencies.
the recommended limits of tolerance, although in the case of formaldehyde, its average concentration was higher than values established by the other three agencies.
Peak resolution and quantification of co-eluted CC by ESI-MS
Co-elution of the acrolein/propanone, furfuraldehyde/ propanal and 2-pentenal/pentanal pairs was observed during the sample analysis. However, it can be surpassed when the detection system is a mass spectrometer since it frequently allows the peak resolution by mass spectra and by
monitoring specific fragment ions of each compound and plotting their extracted ion chromatograms. Figure 3 shows, for example, the extracted ion chromatogram of
the acrolein/propanone pair, through the [M − 1]− ions of
their hydrazones, and their DAD chromatogram. Once the pairs were resolved by the extracted ion chromatograms, the individual compounds could be quantified based on the response factor of their standards.
CC co-eluted were quantified in a set of 12 samples, amongst those which had been collected in the first carbonization stage. Figure 4 shows the average concentrations calculated for each CC after the peak Table 2. Exposure limits for CC (mg m-3), according to different control agencies
CC NR-15 Annex 11 MTE ACGIH NIOSH OSHA
LT-MPT TLV-TWA REL PEL
Formaldehyde 2.3 0.37 0.02 0.92
Acetaldehyde 140 45 32.4 360
Propanone 1870 1187 590 2400
Acrolein − 0.23 0.25 0.25
Cyclohexanone − 80.3 100 200
Furfural − 7.86 − 20
Crotonaldehyde − 0.86 6 6
Propanal − 47.5 − −
LT-MPT: limit of tolerance, time weighted average; TLV-TWA: threshold limit value, time weighted average; REL: recommended exposure level; PEL: permissive exposure level; MTE: Brazilian Ministry of Labour and Employment; ACGIH: American Conference of Governmental Industrial Hygienists; NIOSH: National Institute for Occupational Safety and Health; OSHA: Occupational Safety & Health Administration.
resolution by mass spectra, against the total concentrations of each pair, calculated from the DAD signals.
It can be seen that, after separation, the calculated average concentrations of propanone and furfural were higher than those of acrolein and propanal, their respective co-eluting CC. Propanone is a CC frequently found in a variety of indoor and outdoor environments, as primary or secondary contaminant. Regarding furfural, this aldehyde has been reported as present in samples of tar produced in the thermal degradation of lignin (a compound commonly derived from wood) and should therefore also be present in
smoke emitted from charcoal production.33 This finding is
consistent with data obtained in a previous study, reporting
CC emissions from the burning of eucalyptus.31
Conclusions
During the eucalyptus burning process to produce wood charcoal, twelve CC were identified and quantified, namely: formaldehyde, acetaldehyde, acrolein, propanone,
furfuraldehyde, propanal, 2-oxobutanal, C4 isomers,
cyclopentanone, benzaldehyde and 2-pentenal. Their emission profiles were compared along the different carbonization stages and showed that the furfuraldehyde/ propanal pair was the most abundant in all three stages, followed by acetaldehyde in the first stage and 2-oxobutanal in the second and third stages. Formaldehyde, which is recognized as a human carcinogen and toxic CC, was found to be preferentially present in the first and second stages. These findings are coherent since lower molecular weight substances are expected to be emitted or produced at the beginning of the process, while the heaviest ones prevail in the last stage.
Regarding the influence of the source distance on the measured concentrations, they were generally up to five-fold lower at the collection point more distant from
the source than that found near the kilns, which may be due not only to a dilution effect over the samples, but also possibly to the mass transport of CC from the gas to the particulate phase.
The peak resolution by mass spectra of the co-eluted pairs allowed the calculation of the individual concentrations of furfuraldehyde, propanal, acrolein, propanone, 2-pentenal and pentanal in 12 samples. The high concentrations found here for furfuraldehyde suggest that presence of this CC is important not only in the tar produced during wood burning, as described in the literature, but also in the smoke emitted during charcoal production.
Finally, considering CC determined in this work, none of them presented average atmospheric concentrations at the charcoal plant higher than the exposure limits established by the Brazilian legislation, although in the case of formaldehyde its average concentration was higher than values established by the other three cited agencies. Besides, one should take into account that the values reported here are related only to the CC concentrations in the gas phase. If the CC concentrations are high enough in the particulate matter, this may not be more necessarily true.
Acknowledgements
The authors wish to thank the Conselho Nacional de Desenvolvimento Científico e Tecnológico (CNPq), Fundação de Amparo à Pesquisa do Estado da Bahia (FAPESB), Programa de Apoio a Núcleos de Excelência
(PRONEX),Financiadora de Estudos e Projetos (FINEP),
Coordenação de Aperfeiçoamento de Pessoal de Nível Superior (CAPES) and the Agência Nacional de Energia Elétrica (ANEEL) for their financial supports for this work. The authors also thank Prof. Jailson B. de Andrade for valuable discussions and suggestions and PhD Mina Kato and the Fundacentro for their invaluable assistance with the field samplings.
References
1. Santiago-Silva, M. R.; Ré-Poppi, N.; Chromatographia2002, 55, 475.
2. Barletta, B.; Meinardi, S.; Simpson, I. J.; Khwaja, H. A.; Blake, D. R.; Rowland, F. S.; Atmos. Environ.2002, 36, 3429. 3. Guo, H.; Lee, S. C.; Louie, P. K. K.; Ho, K. F.; Chemosphere
2004, 57, 1363.
4. Guo, H.; Wang, T.; Simpson, I. J.; Blake, D. R.; Yu, X. M.; Kwok, Y. H.; Li, Y. S.; Atmos. Environ.2004, 38, 4551. 5. Vasconcellos, P. C.; Carvalho, L. R. F.; Pool, C. S.; J. Braz.
Chem. Soc.2005, 16, 1210
6. Neng, N. R.; Nogueira, J. M. F.; Anal. Bioanal. Chem. 2010, 398, 3155.
7. Pal, R.; Kim, K. H.; Microchem. J.2008, 90, 147.
8. Dossi, N.; Susmel, S.; Toniolo, R.; Pizzariello, A.; Bontempelli, G.; J. Chromatogr., A2008, 1207, 169.
9. Baños, C. E.; Silva, M.; Talanta2009, 77, 1597.
10. de Andrade, J. B.; Andrade, M. V. A. S.; Pinheiro, H. L. C.; J. Braz. Chem. Soc. 1998, 9, 219.
11. Miguel, A. H.; de Andrade, J. B.; J. Braz. Chem. Soc. 1990, 3, 124.
12. Andrade, M. V. A. S.; Pinheiro, H. L. C.; Pereira, P. A. P.; de Andrade, J. B.; Quim. Nova 2002, 25, 1117.
13. Feng, Y.; Wen, S.; Chen, Y.; Wang, X.; Lü, H.; Bi, X.; Sheng, G.; Fu, J.; Atmos. Environ.2005, 39, 1789.
14. World Health Organization (WHO); Guidelines for Air Quality; Geneva, Switzerland, 2000.
15. American Conference of Government Industrial Hygienists (ACGIH); Documentation of the Threshold Limit Values and Biological Exposure Indices, 6th ed.; American Conference of
Government Industrial Hygienists Inc.: Cincinnati, OH, 1991, p. 664.
16. Borchers, M. T.; Carty, M. P.; Leikauf, G. D.; Am. J. Physiol.
1999, 276, 549.
17. Ho, K. F.; Ho, S. S. H.; Cheng, Y.; Lee, S. C.; Yu, J. Z.; Atmos. Environ.2007, 41, 1747.
18. Vairavamurthy, A.; Roberts, J. M.; Newman, L.; Atmos. Environ.
1992, 26, 1965.
19. ASTM D-5197-92: Standard Test Method for the Determination of Formaldehyde and other Carbonyl Compounds in Air, vol.
11.03, Philadelphia, PA, 1992, p. 489-499.
20. Tejada, S. B.; Int. J. Environ. Anal. Chem.1986, 26, 167.
21. Sirju, A. P.; Shepson, B. P.; Environ. Sci. Technol.1995, 29, 384.
22. Kleindienst, T. E.; Corse, E. W.; Blanchard, F. T.; Lonneman, W. A.; Environ. Sci. Technol. 1998, 32, 124.
23. Alonso, S. G.; Pastor, R. P. M.; Anal. Chim. Acta1998, 367, 93.
24. Kolliker, S.; Oehme, M.; Dye, C.; Anal. Chem.1998, 70, 1979. 25. Grosjean, E.; Green, P. G.; Grosjean, D.; Anal. Chem.1999,
71, 1851.
26. Possanzini, M.; Di Palo, V.; Brancaleoni, E.; Frattoni, M.; Ciccioli, P.; Atmos. Environ.2000, 34, 5311.
27. Possanzini, M.; Di Palo, V. Cecinato, A.; Atmos. Environ.2003, 37, 1309.
28. Carvalho, A. B.; Kato, M.; Rezende, M. M.; Pereira, P. A. P.; Andrade, J. B.; J. Sep. Sci., 2008, 31, 1686.
29. Grosjean, E.; Grosjean, D.; Fraser, M. P.; Cass, G.; Environ. Sci. Technol.1996, 30, 2687.
30. Kato, M.; De Marini, D. M.; Carvalho, A. B.; Rego, M. A. V.; Andrade, A. V.; Bonfim, A. S. V.; Loomis, D.; Occup. Environ. Med.2005, 62, 128.
31. Schauer, J. J.; Kleeman, M. J.; Cass, G. R.; Simoneit, B. R. T.; Environ. Sci. Technol. 2001, 35, 1716.
32. McDonald, J. D.; Zielinska, B.; Fujita, E. M.; Sajebiel, J. C.; Chow, J. C.; Watson, J. G.; Environ. Sci. Technol. 2000, 34, 2080.
33. Costa, A. F.; Farmacognosia, vol. II, 5a. ed.; Fundação Calouste Gulbenkian: Lisboa, 2002
Submitted: February 7, 2012