(Annals of the Brazilian Academy of Sciences) ISSN 0001-3765
www.scielo.br/aabc
Superficial distribution of aromatic compounds and geomicrobiology
of sediments from Suruí Mangrove, Guanabara Bay, RJ, Brazil
LUIZ F. FONTANA1, FREDERICO S. DA SILVA2, NATÁLIA G. DE FIGUEIREDO3, DANIEL M. BRUM3, ANNIBAL D. PEREIRA NETTO3,
ALBERTO G. DE FIGUEIREDO JUNIOR1 and MIRIAN A.C. CRAPEZ4 1PPG em Geologia e Geofísica Marinha, Universidade Federal Fluminense,
Av. General Milton de Tavares de Souza, s/n, 4◦andar
Campus da Praia Vermelha, Gragoatá, 24210-340 Niterói, RJ, Brasil
2Departamento de Geologia, Universidade Federal do Rio de Janeiro
Av. Athos da Silveira (Prédio do CCMN) bloco J, sala JI20 Cidade Universitária, Ilha do Fundão, 21949-900 Rio de Janeiro, RJ, Brasil
3PPG em Química, Universidade Federal Fluminense, Outeiro de São João Batista, s/n
Valonguinho, Centro, 24020-150 Niterói, RJ, Brasil
4PPG em Biologia Marinha, Universidade Federal Fluminense
Caixa Postal 100.644, 24001-970 Niterói, RJ, Brasil
Manuscript received on January 22, 2009; accepted for publication on August 9, 2010
ABSTRACT
The distribution of selected aromatic compounds and microbiology were assessed in superficial sediments from Su-ruí Mangrove, Guanabara Bay. Samples were collected at 23 stations, and particle size, organic matter, aromatic compounds, microbiology activity, biopolymers, and topography were determined. The concentration of aromatic compounds was distributed in patches over the entire mangrove, and their highest total concentration was determinated
in the mangrove’s central area. Particle size differed from most mangroves in that Suruí Mangrove has chernieson
the edges and in front of the mangrove, and sand across the whole surface, which hampers the relationship between
particle size and hydrocarbons. An average≃10% p/p of organic matter was obtained, and biopolymers presented
high concentrations, especially in the central and back areas of the mangrove. The biopolymers were distributed in high concentrations. The presence of fine sediments is an important factor in hydrocarbon accumulation. With high
concentration of organic matter and biopolymers, and the topography withcherniesand roots protecting the mangrove,
calmer areas are created with the deposition of material transported by wave action. Compared to global distributions, concentrations of aromatic compounds in Suruí Mangrove may be classified from moderate to high, showing that the studied area is highly impacted.
Key words: microbiologic activity, Guanabara Bay, biopolymers, phenol, Aromatic Polycyclic Hydrocarbons and Monoaromatics.
INTRODUCTION
The increase of human activity near the shores has led to serious pollution problems. Mangrove ecosystems, commonly found in the intertidal zones of tropical and subtropical regions, are frequently subjected to
pollu-Correspondence to: Luiz Francisco Fontana E-mail: lffontana@hotmail.com
tion stress representing sinks or receivers of various pol-lutants (Tam and Wong 1999, Zheng et al. 2000).
persistence, hydrocarbon bioavailability, the ability of each group to accumulate in the environment and the capacity of contaminants to interfere with the normal metabolism of organisms or communities (GESAMP 1993).
Polycyclic Aromatic Hydrocarbons (PAHs) are an important class of organic pollutants and are ubiquitous in the environment (Pereira Netto et al. 2000). PAHs are of environmental concern because they are widespread in the environment, and some of them have well-known carcinogenic compounds (Ohkouchi et al. 1999, Zakaria et al. 2002, Mai et al. 2003, Kannan et al. 2005). PAHs are introduced in the aquatic environment through ac-cidental oil spills, industrial discharges, wastewaters, at-mospheric precipitation, superficial drainage etc. In these ecosystems, PAHs become are due to their hy-drophobic structures, become preferentially adsorbed in the sediment.
The contact of organisms with toxic oil fractions may lead to death by intoxication, especially associated to monoaromatic hydrocarbon (MHC) fractions. Among the most toxic components are benzene, toluene and xylenes that are considerably soluble in water (especially benzene). This fact makes marine organisms more vul-nerable to them because they absorb these compounds through tissues, gills, by direct ingestion of water or by contaminated food. MHC show intense acute toxic ef-fects, especially due to their high solubility and result-ing bioavailability (GESAMP 1993).
Among the MHC, benzene is the most harmful com-pound, with well-known carcinogenic properties, and it is classified as carcinogenic to humans (1A) by IARC (2007). The other MHC (toluene, xylenes and ethylben-zene) are less toxic (IPCS 1996, 1997), but they are of concern at least because they add odor or taste to water at ppm concentrations (Day et al. 2001).
BTXs (acronym for the set benzene, toluene and xylene) frequently kill meroplankton, ichthyoplankton or other organisms in different life stages subjected to them in the water column, even at concentrations below 5mg/l. In addition to the toxic action of petroleum hy-drocarbons and other chemical components, oil pollu-tion may physically suffocate marine organisms (Ken-nish 1997). Many minor fuel components are of interest due to their toxicology. This is the case of PAHs and
BTX that have been studied in many media including air, water and soil (IPCS 1998, Menchini et al. 1999, Monod et al. 2001, Pereira Netto et al. 2002, 2004, Rego and Pereira Netto 2007).
Mangroves are also rich in polyphenols and tan-nins (Kathiresan and Ravi 1990, Ravi and Kathiresan 1990, Achmadi et al. 1994). As far as the chemical as-pects, the presence of functional groups like carboxyls and phenolic hydroxyls leads the humic substances (HS) to show a polyelectrolytic role and act as com-plexing agents of metallic ions (Saar and Weber 1982, Alloway 1990). Intrinsic features of mangroves such as high organic matter and sulfide contents, the anoxic condition of the superficial sediment layer, low energy character of the environment and the reduced current flow favor deposition and accumulation of contaminants. High concentrations of heavy metals, PCBs and PAHs have been found in mangrove sediments and have been observed to persist for many years (Tam and Wong 1999, 2000, Tam and Yao 2002, Zheng et al. 2002).
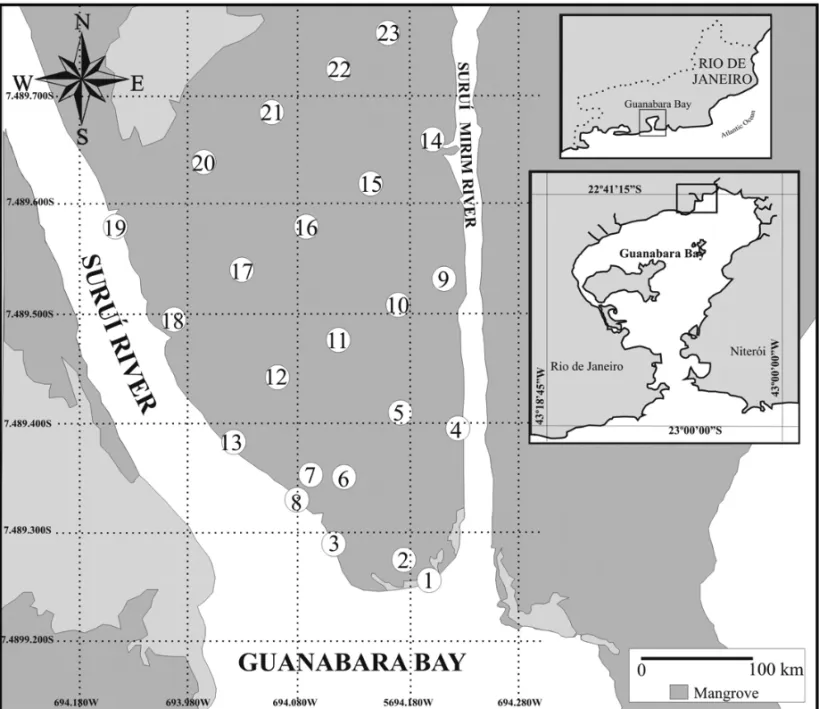
This study was carried out at The Suruí Mangrove, Guanabara Bay, which is located in Magé Municipality (7.489.800 S, 694.280 W), Rio de Janeiro State, Brazil, with an area of about 80.000–100.000 m2. Since it is located north of the Guapimirim Environmental Protec-tion Area (APA), it shares features with the zone termed Norte-APA de Guapimirim (Fig. 1). Suruí Mangrove is bounded by Morro da Solina to the west, and by RJ at BR 116 highway to the north. Its importance increases by the presence of the Suruí River and the channel from Suruí to Mirim, both acting in some parts as boundaries of the Guapimirim APA, and by the fact that they flow into Guanabara Bay (Soares et al. 2006) (Fig. 1). Like most rivers of this region, Suruí Mangrove is constantly flooded because it has a predominantly flat topography, close to sea level, which consequently leads to the for-mation ofchernies at its edges and fringe. The
accu-mulation of sediments and the invasion of detritus from Guanabara Bay by its fringe and from Suruí and Suruí Mirim rivers its edges are also observed due to the tidal regime (L.F. Fontana et al., unpublished data).
man-Fig. 1 – Suruí Mangrove (sampling grid).
grove itself, and is not reexported (Furukawa et al. 1997). The most predominant plant species in Suruí Mangrove and along most of the 3,600 m of the Suruí River (from Suruí City to the river mouth) is the white mangrove (Laguncularia racemosa). There are also, a few clusters of black mangrove interspersed ( Avicen-nia schaueriana); close to the Suruí River mouth, some
clusters of red mangrove (Rhizophora mangle) can be
found. The mangrove is under a strong anthropic pres-sure. The predatory practice of crab catching with raffia traps next to the burrows, and the indiscriminate tree logging, landfilling, draining and deforesting alter hy-drological conditions and, consequently, mangrove
func-tioning thus, hampering management and conservation constitutes a great impact over on Suruí Mangrove and all Guapimirim APA mangroves (Soares et al. 2006).
flooded areas together represent 12.1% or total area, which indicates the possibility of actions directed to fu-ture mangrove regeneration (Egler et al. 2003).
The oil spill that occurred in 2000 was one of the most severe ever recorded in Guanabara Bay, hit-ting several ecosystems in the region. It was the second accident in the same pipeline that had already leaked in 1997, which was caused by the rupture of an oil pipe-line of Duque de Caxias Refinery (REDUC). Accord-ing to Petrobras estimates, a total of about 1,300 m3of crude leaked, of which 25% (325 m3) evaporated, 40% (520 m3) was recovered, and the rest (455 m3) was re-tained in mangroves and rocky shores (Michel 2000).
The aim of this study was to quantify contamina-tion by selected aromatic compounds (ACs) (phenol, benzene, toluene, xylenes, naphthalene, phenanthrene and benzo[a]pyrene) at Suruí Mangrove, Guanabara Bay, Brazil, identify possible deposition sites, and assess the relantionship between these concentrations and other variables related to the microbiological char-acteristics of this area, such as the electron transport system activity, esterase activity, bacterial organic car-bon, biopolymers (carbohydrates, proteins and lipids) and also environmental features such as sediment par-ticle size, organic matter content and topography.
MATERIALS AND METHODS
SEDIMENTCOLLECTION ANDSAMPLINGGRID
About 150 g of superficial sediment were collected at each point in a sampling grid comprising 23 sampling stations along Suruí Mangrove (Fig. 1). Sediments were collected from a layer of 2–3 cm deep without damag-ing the sedimentary layers. Samples were transferred to aluminum trays, kept in thermal boxes, and transported to the laboratory where they were kept in freezer until processing. All samples were collected in January 26th,
2006.
TOPOGRAPHY
For the topographical survey, a Trimble model 3305 class 2 (medium precision) Total Station, with 5′′angular
precision and 2 mm±2 ppm linear precision was used. Georeferencing was done with GPS receptors, Astech model ProMark2, with 5 mm±1 ppm linear precision
and 10 mm±2ppm altimetric precision. Topographic survey was obtained with a closed polygon with 19 ver-tices and supported on two auxiliary stations with GPS receptors. Point coordinates were plotted in the UTM system, UTM, SAD 69, MC = 45◦ w degrees with
or-thometric altitudes. Data of the obtained polygon rep-resenting the study area are show in Table I. This data indicate that the studied area shows a very flat topogra-phy at nearly the sea level.
TABLE I
Data of closing of the polygon.
Parameter Value
Angular closing 0◦01′55′′
Linear closing 0,176 m
Difference in E –0.176 m
Difference in N –0.005 m
Altimetric difference –0.003 m
Relative precision 1: 6.793
Length of the polygon 1.195.294 m
Number of vertices 19
PARTICLESIZEANALYSIS
Sandy fractions (>0.062 mm) were sieved using sieves
with 0.5 phi intervals. The Wentworth scale was used for classification. Muddy fractions (<0.062 mm) were
analyzed by the pipette method (Suguio 1973). Par-ticle size classification followed the one proposed by Flemming (2000), which is restricted to sand sediments (<2 mm). It employs the triangular diagram also used
by other classification systems (Shepard 1954, Folk 1968), but with more subdivisions.
ORGANICMATTER
Organic matter (OM) was determined as the difference between sediment dry weight (100◦C, 24 h) and weight
of the residue after combustion (450◦C, 4 h) (Byers et
al. 1978).
TOTALBIOPOLYMERS
(1972) using the same principle as Dubois et al. (1956) and glucose as a standard, with slight modifications to sediment analysis. Lipids (LIP) were extracted with chloroform and methanol and analyzed according to Marsh and Wenstein (1966); tripalmitine was used as a standard. Proteins (PTN) were determined according to the method proposed by Hartree (1972) and modi-fied by Rice (1982) to compensate for phenol interfer-ence. Bovine albumin, fraction V (Sigma), was used as a standard.
TOTALBIOPOLYMERICCARBON
Lipids, carbohydrates and proteins were converted into carbon equivalents using 0.75, 0.40 and 0.49 g.C g−1
conversion factors, respectively (Fabiano and Pusceddu 1998). The biopolymeric carbon fraction (C-BPF) was defined as the sum of carbohydrate, protein and lipid carbon (Fabiano et al. 1995).
TOTALBACTERIALCARBON
Total bacterial carbon (BC) was enumerated by epifluo-rescent microscopy (Axiosp 1, Zeiss, triple filter Texas Red – DAPI – fluorescein isothiocyanate, 1.000 X mag-nification) and fluorochrome fluorescein diacetate (Kep-ner and Pratt 1994). Carbon biomass (µg C/cm3) by
the method described by Carlucci et al. (1986). Fluo-rochrome fluorescein diacetate allows the score of viable cells, morphologically differentiated as cocci, rods and spirilla.
ESTERASEACTIVITY
Esterase enzyme activity (EST) was determined using the method described by Stubberfield and Shaw (1990). It is based on fluorogenic compounds, which are enzy-matically transformed into fluorescent products that can be quantified by the emission with a spectrophotome-ter by enzymes that hydrolyze many polymeric biomo-lecules. The results are expressed inµg fluorescein/h/g
of sediment.
ELECTRONTRANSPORTSYSTEMACTIVITY
Electron transport system activity (ETSA) was de-termined using the method described by Houri-Davig-non and Relexans (1989), without a surplus of electron donors (Trevors 1984). It is based on dehydrogenase
enzymes, which are the major representatives of oxido-reductase reactions. They catalyze the oxidation of sub-strates producing electrons that can enter into the elec-tron transport system of the cell and be quantified by UV-visible absorption. The results are expressed inµl
O2/h/g of sediment.
DETERMINATION OFAROMATICCOMPOUNDS(ACS)
High performance liquid chromatography with an ul-traviolet-visible detector (HPLC-UV) was used to de-termine concentrations of the studied aromatic com-pounds (phenol, benzene, toluene, xylenes, naphthalene, phenanthrene and benzo(a)pyrene). A Shimadzu LC-10 AT VP system was used, and detection was performed at 254 nm. A standard solution of the studied com-pounds was prepared by dissolving 100 mg of each sub-stance into a final volume of 10.0 ml of acetonitrile, fol-lowed by a dilution of 1.00 ml of this solution to 100 ml with acetonitrile. Calibration curves were evaluated be-tween 2.00 and 100 mg/L, with standard solutions after the adequate dilutions of this solution in acetonitrile.
The determination of aromatic compounds was un-dertaken considering the following methods: Method 610-E.P.A. (Environmental Protection Agency) – Deter-mination of polynuclear aromatic hydrocarbon in wa-ter; Method 6440-B-E.P.A. (Environmental Protection Agency) – Method for liquid extraction in water; and Standard CSN N3 PR 120815 – Operation of high per-formance liquid chromatography apparatus (HPLC).
Limits of detection (LODs) and limits of quantifi-cation (LOQs) were obtained by dividing respectively three and ten times the signal to noise ratios by the angu-lar coefficients of the calibration curves. Signal to noise rations was estimated by the standard deviations of the peak areas obtained after 10 subsequent injections of the 2.00 mg/L standard. LODs and LOQs were expressed in terms of sample volume by dividing the obtained val-ues by the ratio of the analyzed sample (3 g) and the final volume of the concentrated extract (20 mL).
Quantification limits were better than 0.30µg/g for
all studied aromatic compounds.
STATISTICALANALYSIS
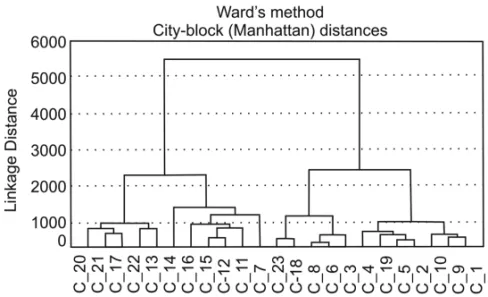
STATIS-TICA©7.0 (δ= 0.349). Ward’s method with City-block
(Manhattan) distance is different from all other methods because it uses an analysis of variance approach to eval-uate the distances between two clusters. In short, this method attempts to minimize the Sum of Squares (SS) of any two (hypothetical) clusters that can be formed at each step. This distance is simply the average dif-ference across dimensions. In most cases, this distance measures yields results similarly to the simple Euclidean distance. However, in this measure, the effect of single large differences (outliers) is dampened (since they are not squared). Nine variables, namely phenol, BTX (sum of benzene, toluene and xylene concentrations), PAH (sum of naphthalene, phenanthrene and benzo[a]pyrene concentrations), percentages of fine sediments and or-ganic matter (OM), total of carbohydrates (CHO), lipids (LIP), proteins (PTN) and porosity, and their values at the 23 sampling stations are summarized in Table II.
RESULTS
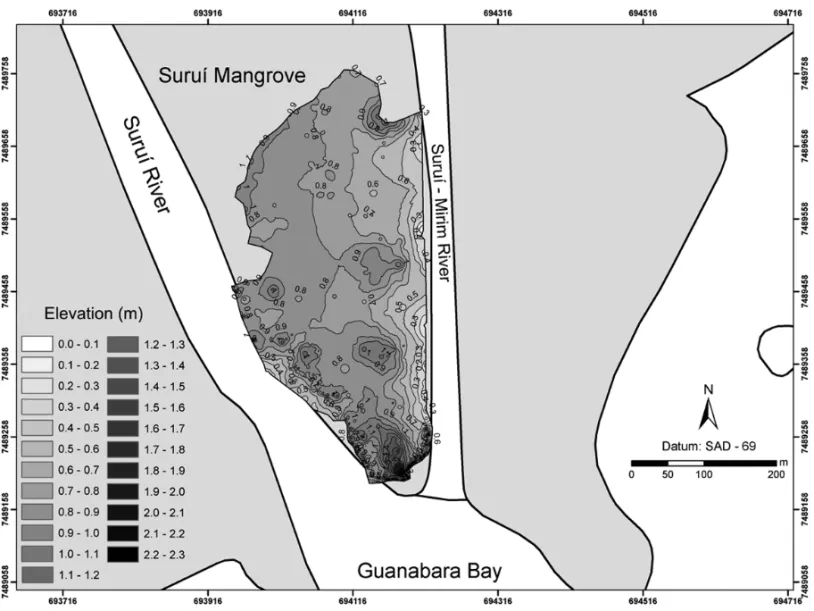
The assessment of mangrove topography was per-formed on October 16th 2007. Suruí Mangrove
com-prises an area about 80.000–100.000 m2. Suruí Man-grove topography features an elevation at the manMan-grove front reaching 2.3 m, and two lower areas ranging from 0.3 to 0.6 cm, one 200 m long on the Suruí River side, and the other along the entire Suruí Mirim Channel. The mangrove topography indicates that it is almost totally flat at its center and back. This higher area, which is a placed in front of the mangrove, together with the man-grove plants, protects it from the inflow of Guanabara Bay waters that invade the mangrove when the tide rises, which configures complex current patterns that prevent the reflux of water out of the mangrove and lead to sedi-ment to settlesedi-ment in the flatter areas (Fig. 2).
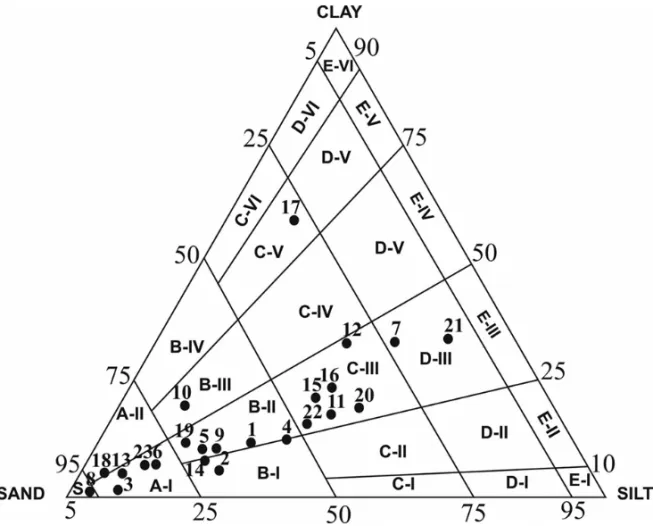
Sand is the dominant particle size fraction of the sediments. Most stations presented small percentages of silt. However, samples 4, 7, 11, 12, 15, 16, 20, 21 and 22 presented 30 to 55% of silt. The highest clay concentra-tions (around 30%) were found at station 7, 12 and 17. Station 21 presented 61% of clay, and station 12 was the only one with more comparable grain proportions. Suruí Mangrove displayed a range from sand to very clayey to slightly sandy mud, according to the classification by Flemming (2000) (Fig. 3).
Biopolymers were distributed all over the man-grove, with concentrations that ranged widely. CHO, which varied between 398µg/g (station 3) and 1760µg/
g (stations 7), showed a large range when compared to that of PTN and LIP. PTN ranged from 118 (station 1) to 220µg/g (station 11). However, a continuous
increase in PTN concentrations was observed from sta-tion 12 to 23 (325 to 824µg/g). LIP varied very little
over the whole mangrove. The smallest concentration was observed at station 6 (12.4µg/g), and the largest
at station 7 (154µg/g) (Fig. 4). As a consequence of
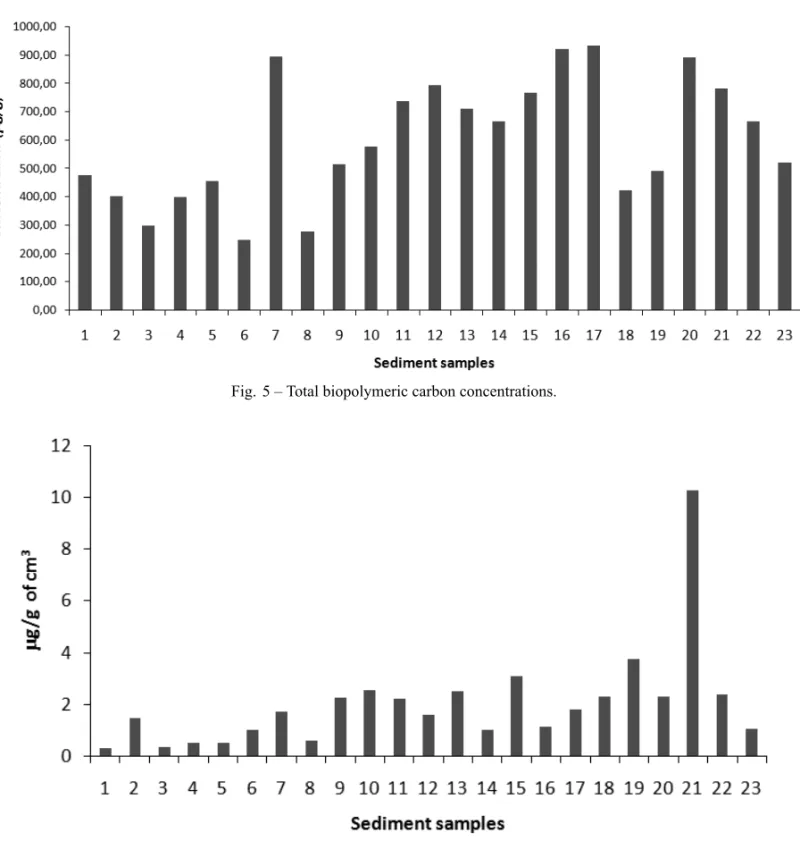
these data, total biopolymeric carbon ranged all over the mangrove. The largest concentration was found in the station 17 (936µg/g), and the lowest at station 6
(247µg/g) (Fig. 5).
BC varied from 0.27 µg C/cm3 (station 1) to
10.24µg C/cm3 (station 21). The station 21 clearly
presented a much higher value than the others, which were always below 3.72µg C/cm3. The mean for BC
values, excepting station 21, was 2.01µg C/cm3.
Sta-tions located at the mangrove front (1 to 8) presented values below the mean (Fig. 6). Enzymatic activity val-ues ranged over the whole mangrove. The highest value was found at station 21 (6.52 µg fluorescein/h/g) and
the smallest one at station 19 (1.35µg fluorescein/h/g),
with a mean of 3.92µg fluorescein/h/g. The high
es-terase enzyme values indicated hydrolysis of molecules heavier than 600 Da.
ETSA, which is related to biomass production, also displayed a very variable activity over the whole man-grove. ETSA values ranged from 0.004µl O2/h/g (sta-tion 10) to 0.62µl O2/h/g (station 16), with a mean of 0.13µl O2/h/g. Stations 3 to 12, which are located close
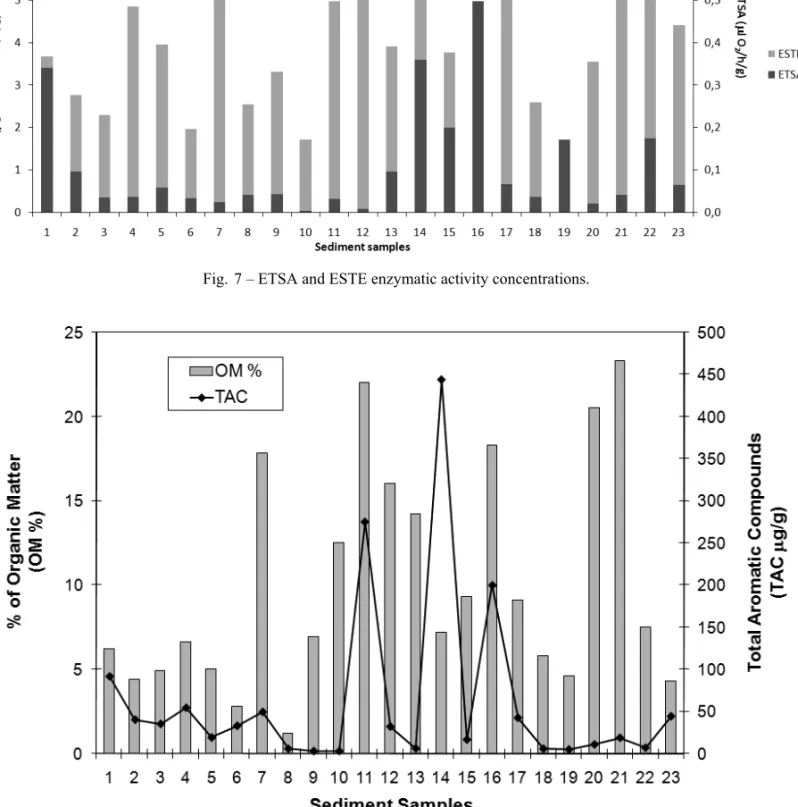
to the mangrove front, showed ETSA close to the mean (Fig. 7). The highest OM percentage was found at sta-tion 21 (23%), and the lowest at stasta-tion 8 (1%). A high OM percentage, with a mean of 10% (Fig. 8), was found for the entire mangrove.
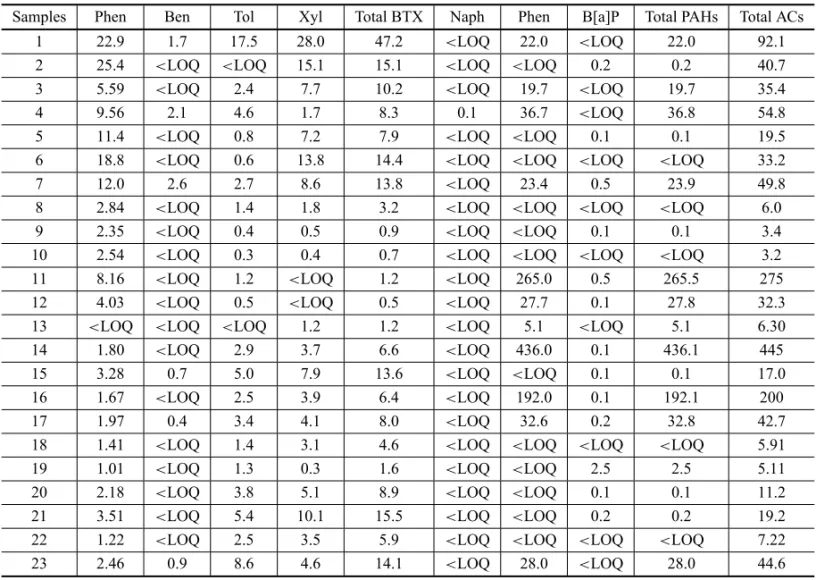
The results of selected aromatic compounds deter-mination are shown in Table II. Compounds that showed the largest concentrations were phenanthrene, at station 14 (436µg/g), followed by xylene at 27.80 µg/g
(sta-tion 1), and phenol at 25.40 µg/g (station 2). Except
TABLE II
Data summary. Fine
Samples Phenol BTX PAH sediments OM(%) CHO PTN LIP Porosity
(%)
1 22.9 47.0 22.0 40.0 6.20 865.6 166 66.5 1.00
2 25.4 15.1 <LOQ 31.0 4.40 692.2 204 34.8 0.90
3 5.59 10.2 19.7 11.0 4.90 292 156 139 0.50
4 9.56 8.32 36.8 48.0 6.60 639 127 108 1.20
5 11.4 7.91 <LOQ 30.0 5.00 831 190 40.2 1.00 6 18.8 14.4 <LOQ 18.0 2.80 398 161 12.4 0.50
7 12.0 13.8 23.9 77.0 17.8 1760 154 154 0.60
8 2.84 3.16 <LOQ 3.0 1.20 408 200 19.6 0.40 9 2.35 0.89 <LOQ 33.0 6.90 942 118 105 1.10 10 2.54 0.69 <LOQ 32.0 12.5 1074 215 55.2 0.60
11 8.16 1.20 266 58.0 22.0 1358 221 117 0.70
12 4.03 0.47 27.8 68.0 16.0 1361 325 121 0.60
13 <LOQ 1.24 5.10 13.0 14.2 1022 417 132 0.50
14 1.80 6.55 436 30.0 7.20 1068 344 95.5 1.20
15 3.28 13.6 <LOQ 57.0 9.30 1242 396 104 1.20
16 1.67 6.40 192 61.0 18.3 1573 455 92.2 0.70
17 1.97 7.99 32.8 73.0 9.10 1282 656 135 1.20
18 1.41 4.55 <LOQ 10.0 5.80 417 487 21.9 0.40
19 1.01 1.58 2.50 28.0 4.60 692 392 30.9 1.00
20 2.18 8.92 <LOQ 64.0 20.5 1022 824 106 0.60 21 3.51 15.5 <LOQ 87.0 23.3 1113 531 103 0.80 22 1.22 5.94 <LOQ 53.0 7.50 768 563 110 1.10
23 2.46 14.1 28.0 18.0 4.30 473 539 88.2 0.90
<LOQ – minor quantification limit.
(LOD) of the employed method. Concentrations of the other monoaromatics were larger than those of benzene at all stations. Toluene concentrations ranged from 0.33 to 17.5 µg/g; xylene concentrations varied between <LOD and 27.8µg/g.
Naphthalene was detected only at station 8, and at all other sites it was below the limit of detection (LOD) of the employed method. Phenanthrene concentrations var-ied widely at the studvar-ied stations (<LOQ to 436µg/g).
Benzo[a]pyrene varied in a low range (<LOQ to 2.5 µg/g). Phenanthrene predominated among PAHs and
was found in most samples. This substance is of concern to aquatic biota since phenanthrene, pyrene and fluoran-thene were previously found to be responsible for most of runoff toxicity to aquatic biota (Boxall and Maltby
1997). The sum of concentrations of the aromatic com-pounds (AC) ranged from 3.26 to 436µg/g, and only
3 stations presented values above 100µg/g. Station 14
showed a higher concentration of total ACs (444µg/g),
followed by stations 11 (275µg/g) and 16 (201µg/g)
(Table III).
STATISTICALANALYSIS
Fig. 2 – Suruí Mangrove topography.
Manhattan analysis, using nine variables – namely phenol, BTX (sum of benzene, toluene and xylene con-centrations), PAH (sum of naphthalene, phenanthrene and benzo[a]pyrene concentrations), percentages of fine sediments and organic matter (OM), total of carbohy-drates (CHO), lipids (LIP), proteins (PTN) and poros-ity – and 23 cases yielded 4 groups. Two main station groups can be observed with a Dlink/Dmax value of around 40. The first group is mainly formed by samples from the center to the back of the mangrove (11, 12, 13, 14, 15, 16, 17, 20, 21 and 22), which presents only one sample from the mangrove front (7). The second group was mostly comprised of samples from the frontal part of the mangrove (1, 2, 3, 4, 5, 6, 8, 9,10), and included three samples (19, 18 and 23) from the back.
Each of these two main groups may be subdivided into two subgroups. The first, formed by stations
13, 1, 15, 17, 20, 21 and 22, showed similarities espe-cially in the variation of CHO concentration (767.78 to 1282.3µg/g). The second, formed by stations 7, 11,
12 and 16, is grouped by variation of PTN concentra-tion (153.52 to 455.25 µg/g). A third group, formed
by stations 3, 6, 8, 18 and 23, showed similarities in LIP contents (12.44 to 138.5µg/g), PAHs and
Fig. 3 – Triangular diagram of textural classes (Flemming 2000). Subdivisions are based on sand/silt/clay percentages.
Fig. 5 – Total biopolymeric carbon concentrations.
Fig. 6 – Bacterial carbon concentrations.
are also in this group. The correlation matrix among variables is show in Table IV. Significantly correlated variables (P<0.05) are show in bold.
DISCUSSION
The study of the topography of Suruí Mangrove revealed an almost flat area with a discrete elevation at its center and the back with a light elevation, which, together with plant roots, works as a protection against sea impact over
Fig. 7 – ETSA and ESTE enzymatic activity concentrations.
Fig. 8 – Organic matter and total aromatic compounds (TAC) concentrations in samples.
As in other studies, high organic matter content was found over the entire mangrove. Organic matter content was comparable to other estuaries: Itacorubi/SC, 3.38– 5.4% (Da Silva et al. 2005) and 0.005–6.13%, Guana-bara Bay (Vilela et al. 2003, Carreira et al. 2001, Bap-tista Neto et al. 2000). The high organic matter
TABLE III
Aromatic compound concentrations (µg/g) in sediments from Suruí Mangrove.
Samples Phen Ben Tol Xyl Total BTX Naph Phen B[a]P Total PAHs Total ACs
1 22.9 1.7 17.5 28.0 47.2 <LOQ 22.0 <LOQ 22.0 92.1 2 25.4 <LOQ <LOQ 15.1 15.1 <LOQ <LOQ 0.2 0.2 40.7 3 5.59 <LOQ 2.4 7.7 10.2 <LOQ 19.7 <LOQ 19.7 35.4 4 9.56 2.1 4.6 1.7 8.3 0.1 36.7 <LOQ 36.8 54.8 5 11.4 <LOQ 0.8 7.2 7.9 <LOQ <LOQ 0.1 0.1 19.5 6 18.8 <LOQ 0.6 13.8 14.4 <LOQ <LOQ <LOQ <LOQ 33.2 7 12.0 2.6 2.7 8.6 13.8 <LOQ 23.4 0.5 23.9 49.8 8 2.84 <LOQ 1.4 1.8 3.2 <LOQ <LOQ <LOQ <LOQ 6.0 9 2.35 <LOQ 0.4 0.5 0.9 <LOQ <LOQ 0.1 0.1 3.4 10 2.54 <LOQ 0.3 0.4 0.7 <LOQ <LOQ <LOQ <LOQ 3.2 11 8.16 <LOQ 1.2 <LOQ 1.2 <LOQ 265.0 0.5 265.5 275 12 4.03 <LOQ 0.5 <LOQ 0.5 <LOQ 27.7 0.1 27.8 32.3 13 <LOQ <LOQ <LOQ 1.2 1.2 <LOQ 5.1 <LOQ 5.1 6.30 14 1.80 <LOQ 2.9 3.7 6.6 <LOQ 436.0 0.1 436.1 445 15 3.28 0.7 5.0 7.9 13.6 <LOQ <LOQ 0.1 0.1 17.0 16 1.67 <LOQ 2.5 3.9 6.4 <LOQ 192.0 0.1 192.1 200 17 1.97 0.4 3.4 4.1 8.0 <LOQ 32.6 0.2 32.8 42.7 18 1.41 <LOQ 1.4 3.1 4.6 <LOQ <LOQ <LOQ <LOQ 5.91 19 1.01 <LOQ 1.3 0.3 1.6 <LOQ <LOQ 2.5 2.5 5.11 20 2.18 <LOQ 3.8 5.1 8.9 <LOQ <LOQ 0.1 0.1 11.2 21 3.51 <LOQ 5.4 10.1 15.5 <LOQ <LOQ 0.2 0.2 19.2 22 1.22 <LOQ 2.5 3.5 5.9 <LOQ <LOQ <LOQ <LOQ 7.22 23 2.46 0.9 8.6 4.6 14.1 <LOQ 28.0 <LOQ 28.0 44.6
Phen (Phenol), Ben (Benzene), Tol (Toluene), Xyl (Xylene), Naph (Naphtalene), Phen (Phenantrene) and B[a]P (Benzo[a]pyrene). LOQ. = quantification limit.
TABLE IV
Correlation matrix of the studied variables.
Phenol BTX PAH Fines (%) OM (%) CHO PTN LIP Porosity
Phenol 1 0.663 –0.128 –0.043 –0.239 –0.138 –0.537 –0.307 0.050
BTX 1 –0.131 0.104 –0.136 –0.079 –0.120 –0.077 0.227
PAH 1 0.090 0.218 0.330 –0.027 0.186 0.184
Fines 1 0.741 0.781 0.336 0.565 0.281
OM 1 0.761 0.345 0.555 –0.230
CHO 1 0.147 0.569 0.139
Ptn 1 0.196 0.015
Lip 1 0.202
Porosity 1
Phenol was detected in all stations except at station 13. Kueh and Lam (2008) detected phenol in Tolo Har-bor, inner Deep Bay, Hong Kong. The results indicated that land-based discharges are unlikely to be the main
con-Fig. 9 – Clustering of sampling points considering the 9 variables from Table I.
tain many different chemicals at different concentrations including phenol, although the exact effluent composi-tion cannot be generalized as it depends on the refinery characteristics and on which units are in operation at any given time. It is therefore difficult to predict the effects that an effluent may have on the environment (Kueh and Lam 2008). Buikema et al. (1981) looked at the ef-fects of ammonia, phenol, chromates and fuel oil, on the reproduction and growth ofMysidopsis bahia. When
exposed to phenol, chromate and fuel oil, these animals exhibited reproductive impairment. Phenol also caused growth inhibition.
It is therefore very difficult in areas with other sources of pollution to pinpoint the exact source of the observed effects (Wake 2005). Suruí and Suruí-Mirim Rivers, industrial complexes and refineries being close Suruí Mangrove are propable sources of sewage pollu-tion and industrial effluents, which hampers the identifi-cation of pollution sources. The differences on hydrocar-bon distribution at Suruí Mangrove showed patch distri-bution, and the presence of sand in the mangrove did not facilitate natural dampening of ACs. On the contrary, the high concentrations of organic matter and biopolymers allowed pollutants sequestration because internal micro-pores between organic matter and its constituents kept a high sorption. Thus, both the smallest and the highest AC values were found in stations that showed large sand levels, which suggests a preferential linkage to organic matter and its constituents.
AC distribution indicates several contamination sources, with a first notification in 2000 (Michel 2000).
Highest AC concentrations were determined between the center and the back of the mangrove that are possi-ble deposition sites being formed by tide reaching. Our results agree with those by Kim et al. (1999) who pro-posed that sediment properties, such as organic matter and particle size, may influence the distribution and con-centration of PAHs and other hydrophobic organic com-pounds. Another PAH study established the important role that mangrove sediments play as oil sinks (Díaz et al. 2000). The entrance of water breaks the chernies,
scattering sand all over the surface of Suruí Mangrove and hampering the relationship between particle size and AC sequestration.
A direct comparison of our data with previously published PAH ones is difficult due to several factors including: a) differences in analytical and sampling methods; b) set of studied PAHs; c) different physical, biological and geological characteristics of the studied area. Indeed, our results indicate that total PAH con-centrations are larger in several points than indicated by previous studies at the same area. Maciel-Souza et al. (2006) determined total PAH concentrations of 11.53 to 28.28µg/g in a transect along a mangrove close to the
petroleum refinery, at the back of Guanabara Bay, and of 1.23µg/g at a station on the Estrela River, close to
Suruí Mangrove. In samples of superficial sediments from the same mangrove, total PAHs over 20µg/g were
sug-gest that this area may experience from other sources of contamination as discussed above.
Comparing these results in a more global context, PAH levels in Guanabara Bay were 2 to 6 times higher than the concentrations in 4 Hong Kong mangroves and 14 other sites at China, the Caribbean and Puerto Rico, where the highest PAH levels reported were 2.2 µg/g
(Tam et al. 2001). Medeiros et al. (2005) studied the distribution of total PAHs in an estuarine lagoon in southern Brazil, highlighting that in the sediment near the petroleum distribution site values reached 11.8µg/g
and, in the refinery sediments, 4.4 µg/g. These sites
were 100 and 40 times more contaminated than a nearby lagoon, and were described as chronic pollution sites. Zakaria et al. (2002) found different PAH con-centration levels, ranging from 0.001 to 760µg/g, with
modal concentrations of 1–10 µg/g in rivers, lakes,
es-tuaries, harbors and coastal areas. 80% of these regions presented values lower than 1µg/g, and only in highly
industrialized sites were they greater than 10µg/g.
Due to the anoxic sedimentary environment, hydro-lysis of organic matter biopolymers may be carried out by anaerobic bacteria, with high esterase enzymes activ-ity and lower electron transport system activactiv-ity. Anaer-obic processes like fermentation, denitrification and sul-fate reduction are energetically less efficient, but are re-sponsible for the biogeochemical cycles in Guanabara Bay sediments (Silva et al. 2008). This hypothesis is supported by the low electron transport system activ-ity, which is responsible for the energy synthesis process and, concomitantly, of biomass. Other studies have cor-roborated these results (Relexans 1996, Fenchel et al. 1988, Edwards et al. 2005). Bacterial carbon, which is present in the whole mangrove, reached a mean of 810 cells/g, with no great variation among the studied sta-tions. Bacteria are present in the sample in great num-bers (1010cells/g), and their biomass is higher than other benthic organisms due to the function and structure of microbial biofilms (Meyer-Reil and Koster 2000).
Crapez et al. (2001) determined 0.54µg of
fluores-cein/h/g of esterase activity, and 0.31µl O2/h/g of
elec-tron transport system activity in sandy sediments from Praia de Boa Viagem, Niterói. Crapez et al. (2003) found different patterns in enzymatic determinations performed in different seasons of the year. Silva et al. (2008)
stud-ied superficial sediments of 30 points along Guanabara Bay and found a mean esterase activity value of 3.20µg
of fluorescein/h/g and electron transport system activity in only 15 stations. Mangrove trees contribute consider-able amounts of autochthonous organic matter to the sed-iment, but also receive waters contaminated by sewage due to the river system that flows through industrial and residential areas close to Suruí Mangrove. The high or-ganic matter levels allow the sequestration of aromatic hydrocarbons, making them unavailable for biodegrada-tion (Kubicki and Apitz 1999) and thus explaining the presence of volatile compounds, such as benzene, toluene and xylene, in Suruí Mangrove sediments (Fontana et al. 2006). According to Pignatello (2003), most forms of natural organic matter contains internal micropores irre-versibly deformed, which act to maintain a more or less linear sorption that competes with a slow desorption.
The carbohydrate, protein, lipid and total biopoly-meric carbon values determined in this study are inferior to data from the literature. Pusceddu et al. (1999) found 760–70530µg/g of carbohydrates, 21600–1210µg/g of
proteins and 260–4470µg/g of lipids in the west
Medi-terranean (Italy). Dell’Anno et al. (2002), also in Italy, found 4600µg/g of carbohydrates, 2100 µg/g of
pro-teins and 1000µg/g of lipids. The lower hydrodynamic
areas showed the highest lipid concentrations, which are associated to fine sediments (Kjerfve et al. 1997, Amador 1980).
The protein/carbohydrate ratio may be used as an eutrophication level indicator in coastal systems. The ratio for an eutrophic environment is<1500–4000µg/g
for proteins, and 5000–7000 µg/g for carbohydrates
(Dell’Anno et al. 2002, Pusceddu et al. 1999).
Although several authors have indicated the exis-tence of an eutrophication process in Guanabara Bay, in the case of Suruí Mangrove that biopolymeric ratio can-not be applied due to high variation of the carbohydrate values determined and, probably, the greater velocity of physicochemical reactions in tropical environments.
CONCLUSIONS
The topography of Suruí Mangrove allows the inflow of Guanabara Bay water, which breaks thecherniesand
is an important factor in natural attenuation decrease of hydrocarbons. However, the high organic matter con-tents, even in samples with homogeneous distribution of sand/silt/clay, facilitated the maintenance of ACs in the sediments, together with biopolymers such as carbohy-drates and proteins.
Mangroves are highly vulnerable to oil impact and play important roles in the maintenance of shorelines and as nurseries for several species. ACs in Suruí Man-grove are not washed by the tide nor naturally attenuated because, aside from the organic matter, the almost flat topography and vegetation disposition allow the seques-tration of these compounds.
ACKNOWLEDGMENTS
The authors thank Agência Nacional do Petróleo (ANP) for support of L.F. Fontana’s PhD thesis at the Geo-logy and Geophysics Program at Universidade Federal Fluminense, Conselho Nacional de Desenvolvimento Científico e Tecnológico (CNPq) for an individual grant to Annibal D. Pereira Neto, Eng. Muricy Ribeiro Brito and Biotecnology technician Eliane Guedes de Carva-lho (Companhia Siderúrgica Nacional/CSN – gerência de Laboratórios de Desenvolvimento) for technical assis-tance with the HPLC analyses.
RESUMO
A distribuição de compostos aromáticos selecionados e a microbiologia foram avaliados em sedimentos superficiais do Manguezal de Suruí, Baía de Guanabara. Amostras foram co-letadas em 23 pontos e determinados a granulometria, maté-ria orgânica, compostos aromáticos, atividade microbiológica, biopolímeros e a topografia. A concentração dos compostos aromáticos foi distribuída em manchas por todo o manguezal e sua concentração total mais elevada foi encontrada na área central do manguezal. A granulometria diferiu da maioria dos manguezais, uma vez que no Manguezal de Suruí exis-temcherniesnas bordas e na frente dos manguezais e areia através da superfície inteira, impedindo o relacionamento en-tre granulometria e os hidrocarbonetos. Uma média de 10% p/p da matéria orgânica foi obtida e os biopolímeros apresentaram concentrações elevadas, especialmente na área central e fundo do Manguezal. Os biopolímeros se distribuíram em altas con-centrações. A presença de finos sedimentos é fator importante na acumulação de hidrocarbonetos. Na concentração elevada
de matéria orgânica e de biopolímeros, topografia comchernies
e as raízes que protegem os manguezais, áreas mais calmas são criadas, com depósito do material transportado pela ação das ondas. Comparadas às distribuições globais, as concentrações das substâncias aromáticas neste manguezal podem ser clas-sificadas de moderadas a elevadas, demonstrando que a área estudada está altamente impactada.
Palavras-chave: atividade microbiológica, Baía de Guana-bara, biopolímeros, fenol, Hidrocarbonetos Aromáticos Poli-cíclicos e Monoaromáticos.
REFERENCES
ACHMADIS, SYAHBIRING, CHOONG ETANDHEMING
-WAYRW. 1994. Catechin-3-O-rhamnoside chain
exten-der units in polymeric procyanidins from mangrove bark. Phytochemistry (Elsevier) 35: 217–219.
ALLOWAYBJ. 1990. The origins of heavy metals in soils. In: ALLOWAYBJ (Ed), Heavy metals in soils. New York, J Wiley & Sons, p. 29–39.
AMADORES. 1980. Assoreamento da Baía de Guanabara – taxas de sedimentação. An Acad Bras Cienc 52: 723–742. ANTHONYEJ. 2004. Sediment dynamics and morphological stability of an estuarine mangrove complex: Sherbro Bay, West Africa. Mar Geol 208: 207–224.
BAPTISTA NETO JA, SMITH BJ AND MCALLISTER JJ. 2000. Heavy metal concentrations in surface sediments in a nearshore environment, Jurujuba Sound, S.E. Brazil. Environ Pollut (Elsevier) 109: 1–9.
BOXALLABAANDMALTBYL. 1997. The effects of motor-way runoff on freshwater ecosystems: 3. Toxicant confir-mation. Arch Environ Contam Toxicol 33: 9–16. BUIKEMA AL, NIEDERLEHNERBR ANDCAIRNS JR. J.
1981. The effects of a simulated refinery effluent and
its components on the estuarine Crustacean, Mysidopsis
bahia. Arch Environ Contam Toxicol 10: 231–240. BYERS S, MILLSE ANDSTEWART P. 1978. Comparison
of methods of determining organic carbon in marine sedi-ments, with suggestions for a standard method. Hydrobiol 58: 43–47.
CARLUCCI AF, CRAVEN DB, ROBERTSONDJANDWIL -LIAMSPM. 1986. Surface-film microbial populations diel amino acid metabolism, carbon utilization and growth rates. Mar Biol 92: 289–297.
CARREIRA R, WAGENER ALR, FILEMAN T ANDREAD
-MAN J. 2001. Distribuição de coprostanol
COHENM, FILHOP, LARAR, BEHLINGHANDANGULO R. 2005. A model of Holocene mangrove development and relative sea-level changes on the Bragança Peninsula (Northern Brazil). Wetl Ecol and Manag 13: 433–443. CRAPEZ MAC, CAVALCANTE AC, BISPO MGS AND
ALVESPH. 2001. Distribuição e atividade enzimática
de bactérias nos limites inferior e superior entre-marés na Praia de Boa Viagem, Niterói, RJ, Brasil. Efeito de
poluentes em organismos marinhos, MORAESRET AL.
(Eds), São Paulo, Arte e Ciência, Villipress, p. 129–138. CRAPEZ MAC, BAPTISTA NETO JA AND BISPO MGS.
2003. Bacterial Enzymatic Activity and Bioavailability of Heavy Metals in Sediments From Boa Viagem Beach (Guanabara Bay). An Inst Geoc (UFRJ) 26: 60–68.
DAY MJ, REINKE RF ANDTHOMSON JAM. 2001. Fate
and transport of fuel components below slightly leaking underground storage tanks. Environ Forensics 2: 21–28.
DA SILVA FS, LAUT VM, LAUT LLM, FIGUEIREDO JR
AG, BONETTIC, VIANALGANDCRAPEZMAC. 2005.
Avaliação da qualidade ambiental em sedimentos super-ficiais do estuário de Itacorubi – Baía Norte (SC), utilizan-do a relação granulometria e atividade respiratória bac-teriana. Proceedings X Congresso da ABEQUA, 2005, Guarapari-ES, Brasil, CD-ROM.
DELL’ANNOA, MEIML, PUSCEDDUAANDDANOVARO
R. 2002. Assessing the trophic state and eutrophication of coastal biochemical composition of sediment organic matter. Mar Pollut Bull 44: 611–622.
DÍAZ MP, GRIGSONSJW, PEPITACJANDBURGESSJG.
2000. Isolation and characterization of novel hydrocar-bon-degrading euryhaline consortia from crude oil and mangrove sediments. Mar Biotechnol 2: 522–532. DUBOISM, GILLES K, HAMILTONJK, REBERSPAAND
SMITH F. 1956. Colorimetric method for determination
of sugars and related substances. Analyt Chem 28: 350– 356.
EDWARDSKJ, BACHWANDMCCOLLOMTM. 2005. Geo-microbiology in oceanography: microbe-mineral interac-tions at and below the seafloor. Trends Microbiol 13: 449–456.
EGLERCAG, CRUZCBM, MADSENPFH, COSTASDEM
ANDSILVAEA. 2003. Proposta de zoneamento ambiental
da Baía de Guanabara. An Inst Geoc (UFRJ) 26: 127–138. ELLISON JC. 1998. Impacts of sediment burial on
man-groves. Mar Pollut Bull 37: 420–426.
FABIANOMANDPUSCEDDUA. 1998. Total and hydroliz-able particulate organic matter (carbohydrates, proteins and lipids) at a coastal station in Terra Nova Bay (Ross Sea, Antarctica). Polar Biol 19: 125–132.
FABIANOM, DANOVARORANDFRASCHETTIS. 1995. A three-year time series of elemental and biochemical com-position of organic matter in subtidal sediments of the Ligurian Sea (northwestern Mediterranean). Cont Shelf Res 15: 1453–1469.
FENCHELT, KINGG M, BLACKBURNT H. 1988. Bacterial
biochemistry: the ecophysiology of mineral cycling. 2nd
ed., Academic Press, 307 p.
FLEMMING BK. 2000. A revised textural classification of gravel-free muddy sediments on the basis of ternary dia-grams. Cont Shelf Res 20: 1125–1137.
FOLK RL. 1968. Petrology of sedimentary rockys.
Hem-phill’s, Austin, 170 p.
FONTANALF, DASILVAFS, KREPSKYN, BARCELOSMA ANDCRAPEZMAC. 2006. Natural attenuation of aro-matic hydrocarbon from sandier sediment in Boa Viagem beach, Guanabara Bay, RJ, Brazil. Geochem Bras 20: 78–86.
FURUKAWAK, WOLANSKIEANDMUELLERH. 1997. Cur-rents and sediment transport in mangrove forests. Estuar Coast Shelf S 44: 301–310.
GABARDOIT, MENICONIMFG, FALCÃOLV, VITALNAA, PEREIRARCL, CARREIRARS. 2000. Hydrocarbon and ecotoxicity in seawater and sediment samples of Guan-abara Bay after the oil spill in january 2000. Proceed-ings 2001 International Oil Spill Conference, American Petroleum Institute Publ., p. 941–950.
GERCHACOVSMANDHATCHERPG. 1972. Improved tech-nique for analysis of carbohydrates in sediment. Limnol Oceanogr 17: 938–943.
GESAMP 1993. Impact of oil and related chemicals and wastes on the marine environment. Rep Stud GESAMP, p. 50–180.
HARTREEEF. 1972. Determination of proteins: a modifica-tion of the Lowry method that gives a linear photometric response. Anal Biochem 48: 422–427.
HOURI-DAVIGNONCANDRELEXANSJ-C. 1989. Measure-ment of actual electron transport system (ETS) Activity in marine sediments by incubation with INT. Environ Tech-nol Lett 10: 91–100.
IARC – INTERNATIONAL AGENCY FOR RESEARCH ON
CANCER. 2007. Complete list of agents, mixtures and exposures evaluated and their classification.
IPCS – INTERNATIONAL PROGRAMME ON CHEMICAL
SAFETY. 1996. Diesel fuel and exhaust emissions. World Health Organization, Geneva.
IPCS – INTERNATIONAL PROGRAMME ON CHEMICAL
IPCS – INTERNATIONAL PROGRAMME ON CHEMICAL SAFETY. 1998. Selected non-heterocyclic polycyclic aromatic hydrocarbons, World Health Organization, Geneva.
KANNANK, JOHNSON-RESTREPOB, YOHNSS, GIESYJP
ANDLONGDT. 2005. Spatial and temporal distribuition
of polycyclic aromatic hydrocarbons in sediments from Michigan Inland Lakes. Environ Sci Technol 39: 4700– 4706.
KATHIRESANKANDRAVIAY. 1990. Seasonal changes in tannin content of mangrove leaves. Indian Forester 116: 390–392.
KEHRIGHA, PINTOF N, MOREIRAIANDMALMO. 2003. Heavy metals and methylmercury in a tropical coastal estu-ary and a mangrove in Brazil. Org Geochem 34: 661–669. KENNISHMJ. 1997. Pratical Handbook of Estuarine and Marine Pollution. Boca Raton, Florida, CRC Press Inc 524 p.
KEPNERJRRLANDPRATTJR. 1994. Use of fluorochromes for direct enumerations of total bacteria in environmental samples: past and present. Microbiol Rev 58: 603–615.
KIMGB, MARUYAKA, LEERF, LEEJH, KOHCHAND
TANABE S. 1999. Distribution and sources of PAHs in Kyeonggi Bay, Korea. Mar Pollut Bull 38: 7–15. KITAYA Y, JINTANA V, PIRIYAYOTHA S, JAIJING D,
YABUKI K, IZUTANI S, NISHIMIYA AAND IWASAKI M. 2002. Early growth of seven mangrove species planted at different elevations in a Thai estuary. Trees-Struct Funct 16: 150–154.
KJERFVEB, RIBEIROC, DIASG, FILIPPOAANDQUA -RESMAV. 1997. Oceanographic characteristics of an im-pacted coastal bay: Baía de Guanabara, Rio de Janeiro, Brazil. Cont Shelf Res 17: 1609–1643.
KUBICKIJDANDAPITZSE. 1999. Models of natural or-ganic matter and interactions with oror-ganic contaminants. Org Geochem 30: 911–927.
KUEHCSWANDLAMJYC. 2008. Monitoring of toxic
sub-stances in the Hong Kong marine environment. Mar Pollut Bull 57: 744–757.
LARARNANDCOHENM. 2006. Sediment porewater
salin-ity, inundation frequency and mangrove vegetation height in Bragança, North Brazil: an ecohydrology-based empir-ical model. Wet Ecol Manag 14: 349–358.
MACIEL-SOUZA MC, MACRAE A, VOLPON AGT, FER -REIRA OS AND MENDONÇA-HAGLER LC. 2006. Chemical and microbiological characterization of man-grove sediments after a large oil-spill in Guanabara Bay – RJ – Brazil. Braz J Microbiol 37: 262–266.
MAI BX, QI SH, ZENG EY, YANG QS, ZHANG G, FU
JM, SHENGGY, PENGPAANDWANGZS. 2003.
Dis-tribuition of polycyclic aromatic hydrocarbons in the coastal region off Macao, China: assessment of input sources and transport pathways using compositional anal-ysis. Environ Sci Technol 37: 4855–4863.
MARSHJBANDWENSTEINDB. 1966. A simple charring method for determination of lipids. J Lipid Res 7: 574– 576.
MEDEIROSPM, BÍCEGOMC, CASTELAORM, DELROSSO C, FILLMANNGANDZAMBONIAJ. 2005. Natural and anthropogenic hydrocarbons inputs to sediments to Patos Lagoon Estuary. Braz Environ Int 31: 77–87.
MENCHINIE, BERTOLACCINIMA, TAGGI F, FALLENI F ANDMONFREDINIF. 1999. A 3-year study of relation-ships among atmospheric concentrations of polycyclic aromatic hydrocarbons, carbon monoxide and nitrogen oxides at an urban site. Sci Total Environ 241: 27–37. MEYER-REILL-AANDKOSTERM. 2000. Eutrophication of
marine waters: effects on benthic microbial communities. Mar Pollut Bull 41: 255–263.
MICHELJ. 2000. Assessment and recommendations for the Oil Spill Cleanup of Guanabara Bay, Brazil. Spill Sci Technol B 6: 89–96.
MONODA, SIVEBC, AVINOP, CHENT, BLAKEDRAND
ROWLANDFS. 2001. Monoaromatic compounds in am-bient air of various cities: a focus on correlations between xylenes and ethylbenzene. Atmos Environ 35: 135–149. OHKOUCHI N, KAWAMURAKANDKAWAHATA H. 1999.
Distributions of three- to seven-ring polynuclear aromatic hydrocarbons on the Deep Sea Floor in the Central Pacific. Environ Sci Technol 33: 3086–3090.
PEREIRA NETTO AD, MOREIRA JC, DIAS AEXO, AR -BILLAG, FERREIRALFV, OLIVEIRAASANDBAREK J. 2000. Avaliação da contaminação humana por hidro-carbonetos policíclicos aromáticos (HPAs) e seus deriva-dos nitraderiva-dos (NHPAs): uma revisão metodológica. Quim Nova 23: 765–773.
PEREIRA NETTO AD, SISINNOCLS, MOREIRA JC, AR -BILLAGANDDUFRAYERM. 2002. Polycyclic aromatic hydrocarbons in leachate from a municipal solid waste dump of Niterói City, RJ, Brazil. Bull Environ Contam Toxicol 68: 148–154.
PEREIRANETTOAD, CUNHAIF, MUNIZFC ANDREGO ECP. 2004. Polycyclic aromatic hydrocarbons in street dust of Niterói City, RJ, Brazil. Bull Environ Contam Toxicol 72: 829–835.
PUSCEDDU A, SARA G, ARMENI M, FABIANO M AND MAZZOLAA. 1999. Seasonal and spatial changes in the sediment organic matter of a semi-enclosed marine system (W-Mediterranean Sea). Hydrobiol 397: 59–70. RAVIAVANDKATHIRESANK. 1990. Seasonal variation in
gallotannin from mangroves. Indian J Mar Sci 19: 224– 225.
REGO ECPAND PEREIRA NETTO AD. 2007. PAHs and BTEX in Groundwater of Gasoline Stations from Rio de Janeiro City, Brazil. Bull Environ Contam Toxicol 79: 660–664.
RELEXANSJ-C. 1996. Measurement of the respiratory elec-tron transport system (ETS) activity in marine sediments: state-of-the-art and interpretation. I. Methodology and re-view of literature data. Mar Ecol-Prog Ser 136: 277–287.
RICEDL. 1982. The detritus nitrogen problem: new
obser-vation and perspectives from organic geochemistry. Mar Ecol-Prog Ser 9: 153–162.
SAARRAANDWEBERJH. 1982. Fulvic acid: modifier of
metal-ion chemistry. Environ Sci Technol 16: 866–872. SAENGERP. 2003. Mangrove Ecology, Silviculture and
Con-servation, Kluwer Academic Publishers, Dordrecht, The Netherlands, 372 p.
SHEPARDFP. 1954. Nomenclature based on sand-silt-clay ratios. J Sediment Petrol 24: 151–158.
SILVA FS, PEREIRA D DA C, NUÑEZ LS, KREPSKY N,
FONTANALF, BAPTISTANETOJAANDCRAPEZMAC. 2008. Bacteriological study of the superficial sediments of Guanabara Bay, RJ, Brazil. Braz J Ocean 56: 13–22. SOARES MLG, SILVA JR CMG, CAVALCANTI VF, AL
-MEIDAPMM, MONTEIROAS, CHAVESFO, ESTRADA GCDANDBARBOSAB. 2006. Regeneração de floresta de mangue atingida por óleo na Baía de Guanabara (Rio de Janeiro, Brasil): Resultados de 5 anos de monitoramento. Geochem Bras 20: 54–77.
STUBBERFIELD LCF ANDSHAW PJA. 1990. A compar-ison of tetrazolium reduction and FDA hidrolysis with other measures of microbial activity. J Microbiol Met 12: 151–162.
SUGUIO K. 1973. Introdução a Sedimentologia. Edgard Blucher, São Paulo, 317 p.
TAMNFY AND WONGYS. 1999. Mangrove soils in
re-moving pollutants from municipal wastewater of different salinities. J Environ Qual 28: 556–564.
TAMNFYANDWONGYS. 2000. Spatial variation of heavy
metals in surface sediments of Hong Kong mangrove swamps. Environ Pollut 110: 195–205.
TAMNFYANDYAOMWY. 2002. Concentrations of PCBs
in coastal mangrove sediments of Hong Kong. Mar Pollut Bull 44: 642–651.
TAMNFY, KEL, WANGXHANDWONGYS. 2001.
Con-tamination of polycyclic aromatic hydrocarbons in sur-face sediments of mangrove swamps. Environ Pollut 114: 255–263.
TREVORS J. 1984. Effect of substrate concentration, inor-ganic nitrogen, 02 concentration, temperature and pH on dehydrogenase activity in soil. Water Res 77: 285–293. VILELACG, SANJINÉSAES, GHISELLIRO JR, FILHOJM,
BAPTISTANETOJAANDBARBOSACF. 2003. Search for Bioindicators of Pollution in the Guanabara Bay: In-tegrations of Ecologic Patterns. An Inst Geoc (UFRJ) 26: 25–35.
WAKE H. 2005. Oil refineries: a review of their ecological
impacts on the aquatic environment. Estuar Coast Shelf S 62: 131–140.
WASSERMANJC, FIGUEIREDOAMG, PELLEGATTIFAND
SILVA EV. 2001. Elemental composition of sediment
cores from a mangrove environment using neutron acti-vation analysis. J Geochem Explor 72: 129–146. WASSERMANJC, BOTELHOALM, CRAPEZMAC, BISPO
MGS, DASILVAFSANDFILGUEIRASCM. 2006.
Hy-drocarbons and Bacterial Activity in mangrove sediments from Guanabara Bay, Brazil. Geochem Bras 20: 30–41. ZAKARIA MP, TAKADA H, TSUTSUMI S, OHNO K, YA
-MADAJ, KOUNOEANDKUMATAH. 2002. Distribution of polycyclic aromatic hydrocarbons (PAHs) in rivers and estuaries in Malaysia: a widespread input of petrogenic PAHs. Environ Sci Technol 36: 1907–1918.
ZHENG GJ, LAM MHW, LAM PKS, RICHARDSON
BJ, MANBKWANDLIAMY. 2000. Concentrations of
persistent organic pollutants in surface sediments of the mudflat and mangroves at Mai Po Marshes Nature Re-serve, Hong Kong. Mar Pollut Bull 40: 1210–1214.
ZHENG GJ, MAN BKM, LAM JCW, LAM MHW AND
LAMPKS. 2002. Distribution and sources of polycyclic