1 Physical Therapy Graduation Program, Universidade Metodista de Piracicaba (UNIMEP), Piracicaba, SP, Brazil 2 Department of Health and Kinesiology, Texas A&M University, College Station, TX, USA
3 Department of Kinesiology, The University of Texas at Arlington, Arlington, TX, USA
Received: 03/19/2012 Revised: 08/24/2012 Accepted: 01/20/2013
a r t i c l e
Family socioeconomic status and the
provision of motor affordances in the home
Teresa C. B. Freitas1, Carl Gabbard2, Priscila Caçola3, Maria I. L. Montebelo1, Denise C. C. Santos1
ABSTRACT | Background: Socioeconomic status (SES) and stimulation provided in the home environment are inluential factors in aspects of child well-being including motor development. Little is known regarding the inluence of SES on speciic aspects of the home environment. Objective: To evaluate the availability of affordances in the home to promote infant motor development and family SES. Method: The sample consisted of 300 families with infants aged 3 to 18 months. SES was assessed according to family socioeconomic class, income and parental level of education. To evaluate motor affordances found at home, the Affordances in the Home Environment for Motor Development-Infant Scale (AHEMD-IS) was used. The AHEMD-IS was designed to assess dimensions of the home environment including Physical Space (outside and inside space), Daily Activities and Play Materials (ine-motor and gross-motor toys).
Results: SES indicators signiicantly inluenced the availability of Physical Space and Play Materials. The Physical Space dimension was inluenced by family economic class and income. The Play Materials dimension was inluenced by all SES indicators. Daily Activities were not inluenced by any of the SES indicators. Daily activities and play material were inluenced by the infant’s age. Conclusions: This study suggests that SES indicators are inluential with regard to the provision of motor affordances in the home environment for infants. However, daily activities, which represent an aspect of the environment that is highly dependent on parental generation of situations that are conducive to motor skill development, are independent of family SES.
Keywords: socioeconomic status; environment; psychomotor performance; infant development; physical therapy; family.
HOW TO CITE THIS ARTICLE
Freitas TCB, Gabbard C, Caçola P, Montebelo MIL, Santos DCC. Family socioeconomic status and the provision of motor affordances in the home. Braz J Phys Ther. 2013 July-Aug; 17(4):319-327.http://dx.doi.org/10.1590/S1413-35552012005000096
Introduction
The literature indicates that social factors related
to the home environment can have a signiicant
(positive or negative) effect on aspects of child well-being, including motor development1-5. Furthermore, a United Nations Educational, Scientific and Cultural Organization report6 stated that the home environment is a proximal (critical) indicator for early childhood care and education. The present study addressed two factors of interest and their association with infant motor development: socioeconomic status (SES) and the availability of motor affordances in the home.
According to Bradley and Corwyn7, indicators of SES are of great interest in the study of child development. Several methods of measuring SES have been proposed, and there appears to be no single best indicator for all research aims that is applicable at different stages in the lifespan. Therefore, a combination of factors is typically used. According
to Galobardes et al.8,9, during infancy and early childhood the best indicators are parental education/ occupation and household income/conditions. Regarding household characteristics, Brazil, where the present study was conducted, includes a standardized measure of socioeconomic class based on household conditions, for example, the number of cars, number of maids/assistants and availability of electronic devices10.
The contribution of SES to child motor development has been reported world-wide. In general, the literature indicates that families with a low SES have children that perform below the norm for developing children11,12. These observations apply to, for example, the relationship between motor development and parental social class/education13-15 and family income16-18.
and developing a foundation for positive lifelong behaviors, especially during the early years1. Abbott et al.19 concluded that the home environment is within the host of subsystems that contribute to infant motor development, and major studies designed to assess the general characteristics of the
home and its relationship to a child’s later behavior
have consistently reported that the availability of stimulating play materials is a predictor of future mental behavior20,21.
Closely associated with the study of materials in the home is the concept of affordance and ecological theory22,23. Affordances can be deined as opportunities offering an individual potential for action that consequently led to learning and the development of a skill or development within part of the biological system24. A major category of affordances consists of play material, i.e., toys and play items that, if made available to children, are likely to promote optimal physical and motor development. The study of the effect of affordances
on infants’ motor development has drawn the
attention of leading contemporary researchers25,26.
Using an instrument designed speciically to assess
the availability of motor affordances in home of infants, the Affordances in the Home Environment for Motor Development – Infant Scale (AHEMD-IS), Caçola et al.27 found a signiicant association between home affordances and infant motor development, in
particular, the availability of gross- and ine-motor
toys predicted motor development scores. Other studies using the AHEMD have reported similar findings28,29. Thus, the availability (or lack of) affordances in the home is an important factor in the motor development of children.
In the present study, we evaluated SES and the availability of affordances for children aged 3 to18 months. For SES, we used indicators representing
the family income, parents’ education, a general
assessment of the household, and the economic
classiication criteria of the Brazilian Association
of Research Companies (ABEP index)10. For affordances, we used the AHEMD- IS27. Our research focused on a global comparison between the two
factors and also on a sub-factor relationship (speciic
dimension of affordance and SES indicators).
Method
This was an exploratory and transversal study approved by the ethics committee at Universidade Metodista de Piracicaba (UNIMEP) in Piracicaba,
SP, Brazil, (Protocol # 29/2008). This study utilized a non-probability-based convenience sample method.
Participants
The study consisted of 300 families containing 146 females and 154 males between 3 and 18 months of age (10.15±4.45). For comparison, three age categories were considered (3-6, 7-12, and 13-18 months). The following inclusion criteria were used: being a resident in the metropolitan area of the cities of Piracicaba (SP) or Campos dos Goytacazes (RJ) in Brazil; having an infant in the home between 3 and 18 months of age; and signing a consent form. In addition, infants that exhibited any genetic syndromes, congenital malformations or neurological impairments, and 15 families that did not fully answer both assessments were excluded from the sample.
Measures
SES was determined using three indicators: socioeconomic class (ABEP index), monthly family income, and parental education. Socioeconomic class was determined by the Brazilian Association of Research Companies10 questionnaire. The questionnaireincludes questions on the education level of the head of the household, ownership of goods (radio, TV, refrigerator, washing machine, VCR/DVD and car), presence of housemaid and housing features. Most of these items are used to calculate an index of SES called the “Criteria for
Economic Classiication”, which is widely used in
publicity, political polls and research in Brazil. The
Criteria for Economic Classiication is a point system
with established weights for each item. The total number of points is used to place the individual in a SES category designated as A (A1, A2), B (B1, B2), C (C1, C2), D or E, where A is the highest and E is the lowest category.
AHEMD-IS
For assessment of the home environment, we used the Affordances in the Home Environment for Motor Development – Infant Scale (AHEMD-IS)27, which is a valid and reliable parental self-report assessment that addresses the quality and quantity of factors (opportunities) in the home that are conducive to enhancing motor development in children aged 3 to 18 months28-30. The AHEMD-IS consists of ive dimensions (Outside Space, Inside Space, Daily Activities, Fine-Motor Toys and Gross-Motor Toys) and a section on child and family characteristics. For simplicity of presentation, we combined Outside Space and Inside Space into one dimension of Physical Space, and we combined Fine-Motor Toys and Gross-Motor Toys in the larger dimension of Play Materials. Three types of questions are used in the AHEMD-IS: simple dichotomic choice, four-point Likert-type scale and description-based queries. Each dimension is scored by summing all points obtained for each question within each dimension (Physical Space [0-16], Variety of Stimulation [0-25], and Play Materials [0-126]). The total score is the sum of the scores of the three dimensions [0-167]. Information regarding the type of residence (house, apartment or other) was retrieved from the family characteristics section.
Procedures
Recruitment letters were sent to parents of infants through college community and daycare centers in the metropolitan area of Piracicaba city (state of São Paulo) and Campos dos Goytacazes city (state of Rio de Janeiro) in Brazil. Both cities have approximately 400,000 inhabitants and maintain two universities where the study was conducted. Families that accepted participation in the study were mailed a packet that included the AHEMD-IS and ABEP questionnaire and were instructed to complete and return the instruments within two weeks.
Treatment of the data
Group characteristics were analyzed through descriptive statistics. We used both the Shapiro-Wilk normality test and the Levene test for homogeneity of variance to initially evaluate the data. Because the data distribution was non-normal, we used the Kruskal-Wallis test for comparisons with more than two independent groups, followed by the Dunn post hoc test when appropriate. An alpha level of .05
(two-tailed) was set for statistical signiicance.
Results
Sample
Most infants in the sample were born after 37 weeks with an adequate birth weight (92.8%); only 11.8% were born prematurely. Most infants were in the 7- to 12-month age range (40.7%), whereas 27% were between 3 and 6 months and 32.3% were between 13 and 18 months. The majority had never attended any daycare center (65.2%), whereas 17.6% had attended for less than 3 months, 10.1% had attended for 3 to 6 months and 7.1% had attended for at least 7 months. Most families (82%) lived in free-standing homes, as opposed to apartments. No
signiicant differences were observed with regard to
type of residence and SES.
Most families were categorized in the upper levels of socioeconomic classes: A (11.7%) and B (52.3%). The remainder of the sample was categorized as classes C (30.7%) and D/E (combined, 5.3%). In the majority of the cases (63%), the two parents were the only adults living in the household. Only 1.7% of households had one adult, whereas 13.5% had three
adults, 12.2% had four adults and 9.1% had ive or
more adults living in the same household. In addition, most infants in the sample were the only child (63%), whereas 25.3% had a sibling living in the home, 9.1% had two siblings and 11.8% lived with two or more siblings in the home.
Most parents had completed high school (mothers: 66.2%; fathers: 76.2%), and the remainder of the sample had a college degree (mothers: 33.8%; fathers: 23.8%). With regard to family income, most families reported an income between $900 and $1,800 per month (40.3%), whereas 31.5% reported earning up to $600 monthly, 16.8% earned between $2,100 and 3,000 and 11.4% earned more than $3,000 each month.
AHEMD-IS
The Kruskal-Wallis analysis comparing the type of residence and dimensions of the AHEMD-IS indicated that families who lived in houses provided a larger physical space than families who lived in apartments [c2(2, N=300) =7.11, p<.05]. However, families living in apartments provided higher quantity and quality of play materials [c2(2, N=300)=27.87,
p<.001] and scored higher on the AHEMD-IS total score [c2(2, N=300) =19.97, p<.001]. The residence type did not affect the Daily Activities score.
The comparison of AHEMD-IS results according
Physical Space [c2(3, N=300)=28.33, p<.001], Play Materials [c2(3, N=300) =63.44, p<.001] and AHEMD-IS total score [c2(3, N=300)=66.73,
p<.001]. Again, signiicant differences were not
observed with regard to Daily Activities. Table 1 shows the comparisons for AHEMD-IS score, SES and family income.
For Physical Space, post-hoc analysis revealed that families in SES classes A and B provided larger
home spaces. For Play Materials, families identiied
as class A provided more opportunities than all other classes. Families in class B had more play materials than those in classes C, D and E, which were not different. The differences in the AHEMD-IS total score were similar to those in the dimension Play Material. For example, class A had the highest total score relative to all other classes, and classes C, D and E were not different from each other (see Table 1
for speciic values).
Daily Activities was the only AHEMD-IS
dimension that did not show a signiicant difference
with regard to family income. The dimensions
Physical Space [c2(3, N=300)=14.32, p<.05], Play Materials [c2(3, N=300)=72.52, p<.001] and Total Score [c2(3, N=300)=70.11, p<.001] were signiicant. Physical Space in the home was significantly different when we compared monthly incomes of up to $600 and higher than $3,000. The difference in Play Materials according to income resembled the difference in the AHEMD-IS total score; the scores for households with a monthly income higher than $3,000 were different from those of households with all other incomes.
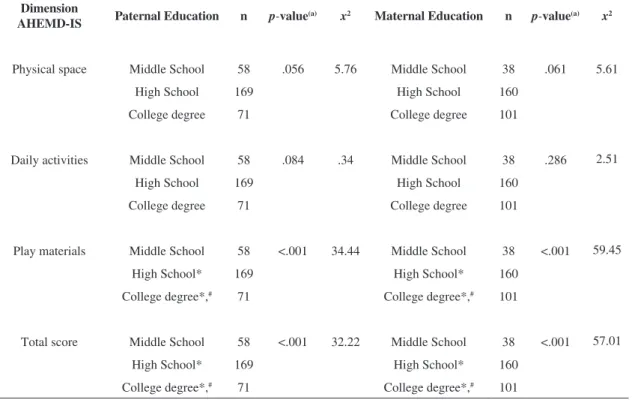
We found that the Physical Space and Daily Activities dimensions were not influenced by maternal and paternal education, whereas Play Materials [c2(2, N=300)=34.44, p<.001] and Total score [c2(3, N=300)=32.22, p<.001] showed
signiicant differences. Post-hoc analysis revealed
that families where both parents had an undergraduate
degree provided signiicantly more toys than families
with high school and middle school education (see Table 2).
Table 1. Comparisons of AHEMD-IS scores according to SES and family income.
Dimension
AHEMD-IS SES n p-value(a) x2 Monthly income(b) n p-value(a) x2
Physical space A 35 <.001 28.33 Up to $600 94 .025 14.32
B 157 $900-$1,800 120
C*,# 92 $2,100-$3,000* 50
D-E*,# 16 More than $3,000* 34
Daily activities A 35 .357 3.23 Up to $600 94 .081 6.74
B 157 $900-$1,800 120
C 92 $2,100-$3,000 50
D-E 16 More than $3,000 34
Play materials A 35 <.001 63.44 Up to $600 94 <.001 72.52
B* 157 $900-$1,800* 120
C*,# 92 $2,100-$3,000*, # 50
D-E*,# 16 More than $3,000*,# 34
Total score A 35 <.001 66.73 Up to $600 94 <.001 70.11
B* 157 $900-$1,800* 120
C*,# 92 $2,100-$3,000*,# 50
D-E*,# 16 More than $3,000*,# 34
(a)Kruskal-Wallis test; Dunn post hoc (*difference from class A; #difference from class B). (b)Values are expressed in US dollar equivalents to
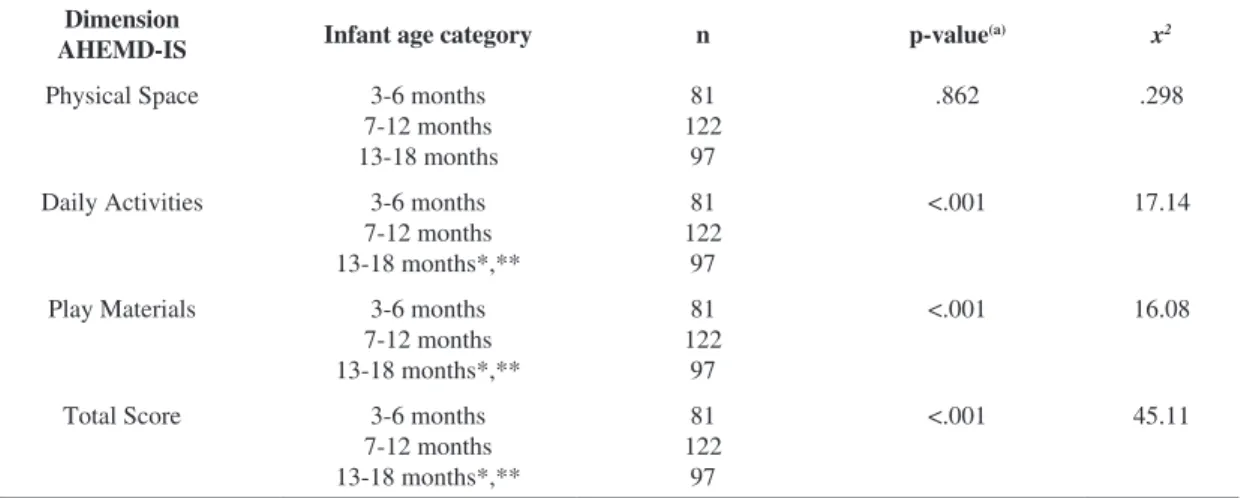
Table 3 shows the scores for the AHEMD-IS dimensions with respect to age category (3-6 months, 7-12 months and 13-18 months). We found that the Daily Activities [c2(2, N=300) =17.14, p<.001], Play Material [c2(2, N=300)=16.08, p<.001] and Total Score [c2(2, N=300)=45.11, p<.001] dimensions
were inluenced by the age of the infants. Post-hoc
analysis revealed that older infants (13-18 months) were more stimulated and had more toys than infants aged 3-6 and 7-12 months.
Discussion
The results of the present study indicate a significant influence of SES indicators on the availability of physical space and play materials. The
physical space of the home was inluenced by family
economic class and income. The Play Materials
dimension was inluenced by all SES indicators. The Daily Activities dimension was not inluenced
by any of the SES indicators. The Daily Activities
and Play Material dimensions were inluenced by the infants’ age.
We found that 64% of the families were classiied
in socioeconomic classes A and B, which afford a higher potential for consumption and possess more household features, thereby favoring the acquisition
of a higher number of toys and larger space. The education of mothers and fathers was similar, but
more mothers had college degrees, which may relect
a new social organization where mothers study
more in an attempt to contribute inancially to the
household.
Overall, the AHEMD-IS total score was inluenced
by all SES indicators. Interestingly, SES did not affect the type of residence; most of the families lived in houses, although the physical space for the houses was larger for families with higher SES, as expected. In Brazil, SES typically does not play a role in determining the type of residence.
Families living in apartments provided more play materials, which was not surprising because, in
Brazil, many afluent families live in apartments for
safety reasons, which may explain why these families had higher scores.
The contribution of each indicator to each dimension of the home environment (Physical Space, Daily Activities and Play Materials) was different. Whereas the Play Materials dimension
was inluenced by all indicators, Physical Space was not dependent upon parents’ education and was
only affected by income and socioeconomic class. In contrast, Daily Activities was not affected by any of the SES indicators.
Table 2. Comparison between AHEMD-IS scores and paternal and maternal education levels.
Dimension
AHEMD-IS Paternal Education n p-value
(a) x2 Maternal Education n p-value(a) x2
Physical space Middle School 58 .056 5.76 Middle School 38 .061 5.61
High School 169 High School 160
College degree 71 College degree 101
Daily activities Middle School 58 .084 .34 Middle School 38 .286 2.51
High School 169 High School 160
College degree 71 College degree 101
Play materials Middle School 58 <.001 34.44 Middle School 38 <.001 59.45
High School* 169 High School* 160
College degree*,# 71 College degree*,# 101
Total score Middle School 58 <.001 32.22 Middle School 38 <.001 57.01
High School* 169 High School* 160
College degree*,# 71 College degree*,# 101
The three dimensions of the AHEMD-IS
relect several aspects that can inluence the motor
development of infants. Obviously, physical space is necessary for infants to move freely, and toys afford
possibilities for enhancing ine- and gross-motor
skills. Daily activities are of particular relevance for motor development. To underscore the importance of variety of stimulation in the motor development of infants, Bartlett et al.31 developed a speciic measure for opportunities that parents provide for infants, and they found that differences in motor development
may relect variations in early child-rearing practices,
i.e., infants who receive greater stimulation may progress at a faster rate. In fact, during infancy,
speciic handling techniques and caregiving practices
that expose infants to postural challenges have been associated with motor advancement19.
In the present study, Daily Activities was the only
dimension not dependent upon inancial condition. In the AHEMD-IS, this dimension refers speciically
to the variety of stimulation offered to the infant in the home, with simple dichotomic questions based on statements such as: “Our child regularly plays
with other children”; “We regularly engage our child
in movements, games and actions to teach her/him
parts of the body”; and, “We regularly teach our child movements or action words, such as ‘clap hands’, ‘wave’, ‘crawl’, ‘walk’, etc”. In addition, there are
statements with a four-point Likert-type scale such as, “How would you describe the amount of awake time that your child spends in the situation of ‘in a
seating device’, ‘in a walking device’, ‘in a playpen’, etc.”. Therefore, we speculate that aspects under the
control of the parents, such as time and interaction with the infant, are similar across SES categories.
Our results conirm the indings of Tudge et al.32,
who explored young children’s normative
development and everyday activities in different cultures. Tudge et al.32 found that variation in activities was not explainable by cultural group or social class, possibly because it is easier to measure
“what” children experience, but very dificult to account for “how” they experience an activity.
Notably, however, another study found differences in the variety of stimulation provided by families according to SES factors33, possibly because of the use of different measures for assessing daily activities and variety of stimulation.
However, as may be expected, daily activities were dependent upon age. Younger infants were less stimulated than their older counterparts, partly because of what their bodies are capable of. That is, older infants (especially aged 12 to 18 months) were experiencing a phase of rapid attainment of major milestones such as walking.
The Play Materials demonstrated the highest influence of SES factors. This dimension was influenced by all SES indicators (family
socioeconomic class and income and parents’ level of education), and this inding was expected, as it
seems reasonable that a higher income would provide a higher potential for purchasing toys. Every year, the toy industry develops new products that tend to be increasingly sophisticated and expensive. In Brazil, because the majority of the population falls below socioeconomic classes A and B, it is estimated that 20 million children still do not have access to manufactured toys34. We also found that for both parents, having an educational level below high school
signiicantly affected the provision of play materials.
Table 3. Comparison between AHEMD-IS scores and infant age categories.
Dimension
AHEMD-IS Infant age category n p-value
(a) x2
Physical Space 3-6 months
7-12 months 13-18 months
81 122
97
.862 .298
Daily Activities 3-6 months 7-12 months 13-18 months*,**
81 122
97
<.001 17.14
Play Materials 3-6 months
7-12 months 13-18 months*,**
81 122
97
<.001 16.08
Total Score 3-6 months
7-12 months 13-18 months*,**
81 122
97
<.001 45.11
It is likely that higher educational levels lead to higher income and socioeconomic class, thereby resulting in the purchase of more toys. Oliveira, Magalhães and Salmela4 also found that parental education and family income were moderately associated with the overall score on the Home Observation for Measurement of the Environment (HOME), which reinforces the notion that both factors help provide better economic resources, which in turn results in a more stimulating home environment.
In summary, our study is the irst to report that
aspects of SES, namely, family income, parent education and socioeconomic class, affect the availability of motor affordances for infants in
the home. These indicators were signiicantly and
positively associated with physical space and play materials in the home. Whereas these results were not unexpected, the finding that daily activities were similar across SES categories was somewhat surprising. For example, it may be predicted that with higher education, parents would be more aware of the need for stimulation of the infant, thus resulting in more interaction. However, this was not the case, and rather than being a negative result, it seems reasonable to speculate that for factors within the control of the parents, such as stimulation, parents with relatively lower SES as attentive as those with higher SES. This concept complements the idea that for many families, family income and education are major environmental constraints that can negatively impact aspects of the home environment, including the availability of motor affordances.
A possible limitation of this study is its use of a convenience sample. However, according to Oliveira35, convenience samples are adequate and useful to promote ideas in exploratory research, especially as a basis for hypothesis formulation.
This study has real applications and relevance
for the rehabilitation ield. Our results point to the
requirement for specialized assessment of different
aspects of the family environment that can inluence an infant’s motor and general development. For
example, a previous study using the AHEMD-IS5 found significant positive correlations between aspects of the home environment (daily activities and play materials) and global and fine-motor
performance from 9 to 15 months of age. This inding
suggests that affordances can positive affect future motor ability.
Our results also support the common practice in physical and occupational therapy to have professionals advise patients on home activities, including assessment and recommendations for
intervention. In general, such recommendations involve how to utilize different aspects of the home space, toys, stimulation and activities that are part
of an infant’s life.
Overall, the most important finding of this study is that daily activities are independent of family socioeconomic status. This aspect of the home environment highly depends on parents creating situations that are conducive to motor skill development, such as spending time playing with the infants, promoting interaction with other infants/ children, providing space and safety for the infants to move freely and providing access to toys.
Acknowledgements
We acknowledge the children and parents who participated in the study and the Conselho Nacional de Desenvolvimento Científico e Tecnológico (CNPq) for funding this study (Process 483955/2009-4 and 313071/2009-8).
References
1. Son SH, Morrison FJ. The nature and impact of changes in home learning environment on development of language and academic skills in preschool children. Dev Psychol. 2010;46:1103-8. PMid:20822226. http://dx.doi. org/10.1037/a0020065
2. Tong S, Baghurst P, Vimpani G, McMichael A. Socioeconomic position, maternal IQ, home environment and cognitive development. J Pediatr. 2007;151:284-8. PMid:17719939. http://dx.doi.org/10.1016/j. jpeds.2007.03.020
3. Walker SP. Commentary: Early stimulation and child development. Int J Epidemiol. 2010;39:294-6. PMid:19864346. http://dx.doi.org/10.1093/ije/dyp316 4. Oliveira GE, Magalhães LC, Salmela LFT. Relationship
between very low birth weight, environmental factors, and motor and cognitive development of children of 5 and 6 years old. Rev Bras Fisioter. 2011;15(2):138-45. PMid:21789364. http://dx.doi.org/10.1590/ S1413-35552011000200009
5. Miquelote AF, Santos DCC, Caçola PM, Montebelo MIL, Gabbard C. Effect of the home environment on motor and cognitive behavior of infants. Infant Behav Dev. 2012;35(3):329-34. PMid:22721733. http://dx.doi. org/10.1016/j.infbeh.2012.02.002
6. Iltus S. Signiicance of home environments as proxy
indicators for early childhood care and education. Paper commissioned for the EFA Global Monitoring Report, Strong foundations: Early childhood care and educations. Unesco; 2006. Available from: http://unesdoc.unesco.org/ images/001474/147465e.pdf.
PMid:11752490. http://dx.doi.org/10.1146/annurev. psych.53.100901.135233
8. Galobardes B, Shaw M, Lawlor DA, Lynch JW, Smith GD. Indicators of socioeconomic position (part 1). J Epidemiol Community Health. 2006;60:7-12. PMid:16361448 PMCid:PMC2465546. http://dx.doi. org/10.1136/jech.2004.023531
9. Galobardes B, Shaw M, Lawlor DA, Lynch JW, Smith GD. Indicators of socioeconomic position (part 2). J Epidemiol Community Health. 2006;60:95-101. PMid:16415256 PMCid:PMC2566160. http://dx.doi. org/10.1136/jech.2004.028092
10. Associação Brasileira de Empresas de Pesquisa - ABEP. Critério de classificação econômica Brasil. 2008. Available from: http://www.abep.org/novo/FileGenerate. ashx?id=252.
11. Venetsanou F, Kambas A. Environmental Factors
Affecting Preschoolers’ Motor Development. Early
Child Educ J. 2010;37:319-27. http://dx.doi.org/10.1007/ s10643-009-0350-z
12. Chowdhury SD, Wrotniak BH, Ghosh T. Nutritional and socioeconomic factors in motor development of Santal children of the Purulia district, India. Early Hum Dev. 2010;86(12):779-84. PMid:20961715. http://dx.doi. org/10.1016/j.earlhumdev.2010.08.029
13. Lejarraga H, Pascucci LC, Krupitzky S, Kelmansky D, Bianco A, Martinez E, et al. Psychomotor development in Argentina children aged 0–5 years. Paediatr Perinat Epidemiol. 2002;16:47-60. PMid:11856454. http://dx.doi. org/10.1046/j.1365-3016.2002.00388.x
14. Barros AJD, Matijasevich A, Santos IS, Halpern R. Child development in a birth cohort: effect of child stimulation is stronger in less educated mothers. Int J Epidemiol. 2010;39(1):285-94. PMid:19717543 PMCid:PMC2817089. http://dx.doi.org/10.1093/ije/ dyp272
15. Janssen AJWM, Akkermans RP, Steiner K, Haes OAM, Oostendorp RAB, Kollée LAA, et al. Unstable longitudinal motor performance in preterm infants from 6 to 24 months on the Bayley Scales of Infant Development – Second edition. Res Dev Disabil. 2011;32:1902-9. PMid:21530160. http://dx.doi.org/10.1016/j.ridd.2011.03.026
16. Engle PL, Black MM. The effect of poverty on child development and educational outcomes. Ann N Y Acad Sci. 2008;1136:243-56. PMid:18579886. http://dx.doi. org/10.1196/annals.1425.023
17. Halpern R, Giugliani ERJ, Victora CG, Barros FC, Horta BL. Fatores de risco para suspeita de atraso no desenvolvimento neuropsicomotor aos 12 meses de vida. J Pediatr (Rio J). 2000;76(6):421-8. http://dx.doi. org/10.2223/JPED.88
18. Grantham-McGregor SM, Lira PI, Ashworth A, Morris SS, Assunção AM. The development of low birth weight term infants and effects of the environment in northeast Brazil. J Pediatr. 1998;132:661-6. http://dx.doi.org/10.1016/ S0022-3476(98)70357-9
19. Abbott A, Bartlett D, Fanning J, Kramer J. Infant motor development and aspects of the home environment. Pediatr Phys Ther. 2000;12:62-7.
20. Bradley R, Caldwell B, Rock S, Ramey C, Barnard K, Gray C, et al. Home environment and cognitive
development in the irst 3 years of life: A collaborative
study involving six sites and three ethnic groups in North America. Dev Psychol. 1989;25:217-35. http://dx.doi. org/10.1037/0012-1649.25.2.217
21. Mundfrom D, Bradley R, Whiteside L. A factor analytic study of the infant-toddler and early childhood versions of the HOME inventory. Educ Psychol Meas. 1993;53:479-89. http://dx.doi.org/10.1177/0013164493053002017 22. Adolph KE, Robinson SR. In defense of change
p r o c e s s e s . C h i l d D e v . 2 0 0 8 ; 7 9 ( 6 ) : 1 6 4 8 - 5 3 . PMid:19037939 PMCid:PMC2632581. http://dx.doi. org/10.1111/j.1467-8624.2008.01215.x
23. Gibson EJ. Perceiving the Affordances: A Portrait of Two Psychologists. Erlbaum; 2002.
24. Stoffregen TA. Affordances and events. Ecol Psychol. 2000;12:1-28. http://dx.doi.org/10.1207/ S15326969ECO1201_1
25. Adolph KE, Joh AS, Eppler MA. Infants’ perception of
affordances of slopes under high- and low-friction conditions. J Exp Psychol Hum Percept Perform. 2010;36(4):797-811. PMid:20695700 PMCid:PMC3648889. http://dx.doi. org/10.1037/a0017450
26. Franchak JM, Van der Zalm DJ, Adolph KE. Learning by doing: action performance facilitates affordance perception. Vision Res. 2010;50(24):2758-65. PMid:20858512 PMCid:PMC3013505. http://dx.doi. org/10.1016/j.visres.2010.09.019
27. Caçola P, Gabbard C, Santos DCC, Batistela AC. The development and application of the Affordances in the Home Environment for Motor Development – Infant Scale (AHEMD-IS). Pediatr Int. 2011;53:820-5. PMid:21507146. http://dx.doi.org/10.1111/j.1442-200X.2011.03386.x 28. Haydari A, Askari P, Nezhad MZ. Relationship between
affordances in the home environment and motor development in children age 18-42 months. J Soc Sci. 2009;5(4):319-28.
29. Temple V, Naylor P, Rhodes R, Wharf Higgins J. Physical activity of children in family child care. Appl Physiol Nutr Metab. 2009;34:794-798. PMid:19767816. http://dx.doi. org/10.1139/H09-061
30. Rodrigues L, Saraiva L, Gabbard C. Development and construct validation of an inventory for assessing the home environment for motor development. Res Q Exerc Sport. 2005;76:140-8. PMid:16128482. http://dx.doi.org /10.1080/02701367.2005.10599276
31. Bartlett DJ, Fanning JK, Miller L, Conti-Becker A, Doralp S. Development of the daily activities of infants scale: a measure supporting early motor development. Dev Med Child Neurol. 2008;50(8): 613-7. PMid:18754900. http:// dx.doi.org/10.1111/j.1469-8749.2008.03007.x
32. Tudge JR, Doucet F, Odero D, Sperb TM, Piccinini CA, Lopes RS. A window into different cultural worlds: young
children’s everyday activities in the United States, Brazil, and
33. Evans GW. The environment of childhood poverty. Am Psychol. 2004;59(2):77-92. PMid:14992634. http://dx.doi. org/10.1037/0003-066X.59.2.77
34. A s s o c i a ç ã o B r a s i l e i r a d o s F a b r i c a n t e s d e Brinquedos - ABRINQ. Available from: http://www. abrinq.com.br/.
35. Oliveira TMV. Amostragem não probabilística: adequação de situações para uso e limitações de amostras por conveniência, julgamento e quotas. Rev Administração On Line. 2001; 3(2):1-16. Available from: http://www. fecap.br/adm_online/art23/tania2.htm.
Correspondence
Denise Castilho Cabrera Santos Mestrado em Fisioterapia