Mirari Elcoro, and Rhiannon Pegan, Armstrong Atlantic State University - Psychology. Scot P. Kelly, Armstrong Atlantic State University - Biology. Tina Thompson, Mercer School of Medicine. Carlos F. Aparicio, Salem State University - Psychology. Correspondence regarding this article should be directed to: Mirari Elcoro, Ph.D., Assistant Professor, Department of Psychology, Armstrong Atlantic State University, 11935 Abercorn St. Savannah, GA 31419-1997. Tel.: 912 3442927. Fax.: 912-3443484. E-mail: [email protected]
Introduction
Accurate use of time is involved in many of our daily activities. The study of how behavior is modiied by changes in time is referred to as temporal control or timing. Temporal control deals with intervals ranging from seconds to minutes and is deined as the sensitivity of behavior associated with temporal organization of environmental events (Catania, 1991). In the operant conditioning laboratory, several schedules of reinforcement may be arranged to examine how behavior is organized according to time. For example, in a ixed-interval (FI) schedule of reinforcement, a reinforcer is delivered when an operant response occurs after a ixed time has elapsed (Ferster & Skinner, 1957). A variation of the FI schedule, used in the present study, is the peak-interval procedure (PIP, Roberts, 1981). The PIP involves opportunities to earn reinforcers following an FI schedule, intermixed with longer trials in which
6-Hydroxydopamine lesions in the medial prefrontal cortex
of rats exposed to a peak-interval procedure
Mirari Elcoro
1, Tina Thompson
2, Scot P. Kelly
1, Rhiannon Pegan
1, and Carlos F. Aparicio
31. Armstrong Atlantic State University, Savannah, GA, United States
2. Mercer School of Medicine, Savannah, GA, United States 3. Salem State University, Salem, MA, United States
Abstract
Impaired temporal control is symptomatic of several neurological disorders; recently, it has been implicated in schizophrenia. An animal model of schizophrenia using 6-hydroxydopamine (6-OHDA) infused to the medial pre-frontal cortex (mPFC) was employed to examine its effects on temporal control. Twelve rats were trained on a peak-interval procedure (PIP) until stable patterns of behavior were obtained. Rats infused with 6-OHDA responded less during peak trials and their peak functions were flatter than sham rats. These results are consistent with similar studies with transgenic mice with increased striatal dopamine D2 receptor activity. Lesions in the mPFC decreased motivation to respond in a PIP. These effects may be considered analogous to negative symptoms of schizophrenia. Keywords:dopamine, peak-interval procedure, rats,temporal control.
Received 12 November 2013; received in revised form 16 January 2014; accepted 17 January 2014. Available online 20 May 2014.
no reinforcers are delivered (i.e., peak trials). Both types of trials (i.e., FI and peak trials) are randomly arranged and each is separated by an inter-trial-interval (ITI). The resulting patterns of behavior after repeated exposure to the peak trials consist of a progressive increase of responding that peaks around the target time (i.e., the FI value) and then decelerates.
Ward et al. (2009) used transgenic mice that selectively overexpress the striatal D2 receptor and a PIP with a single interval (FI 12 s, peak trials of 48 s) and varying probabilities of reinforcement. In the PIP, the transgenic mice showed a signiicant reduction in overall responding relative to controls. In addition, as the probability for reinforcement increased, the timing functions obtained with responding during the peak trials recovered. Ward et al. suggested the inding was related to a motivational deicit, analogous to negative symptoms (i.e., avolition) of schizophrenia (Ward et al. 2011). Similarly, other procedures (e.g., inger tapping task, Carroll et al., 2009) have also shown that patients diagnosed with schizophrenia exhibit distortions in temporal control (Elvevåg, Weinberg, & Goldberg, 2002; Tysk, 1983).
Animal models have also been used to examine cognitive symptoms of schizophrenia such as defects in working memory (Ward et al., 2011) which depend on the functioning of the prefrontal cortex (PFC, Heidbreder & Groenewegen, 2003; Olton, 1989). Planning and execution of complex behaviors are functions of the PFC; speciically the dorsal part of the medial PFC (mPFC) is involved in the temporal patterning of behavioral sequences (Heidbreder & Groeneweger; Valencia-Torres et al., 2011, 2012). The alterations of temporal control described above may be considered part of the cognitive symptoms in schizophrenia (Balci et al., 2010).
Brain lesions may be performed following different methods and a few have been used to examine ongoing behavior maintained in a PIP. For example, Olton (1989), Olton et al. (1988), and Meck (2006) used aspiration to remove most of the frontal cortex (FC) and examined the effects of such lesions on performance in a PIP. In these three studies an attempt was made to leave the cingulate cortex and underlying iber tracts of the corpus callosum intact (see studies for more details). Olton (1989) observed selective alterations of temporal control: the functions formed during the peak trials were shifted to the right, which indicates responding happened slightly later than prior to the FC lesions when two intervals (FI 10 & 20 s, peak trials of 130 s) were used in a PIP. Responding shifted to the right more pronouncedly in the FI 20 s trials and during peak trials. In this same study, the number of days to recover from the lesions was not speciied. Olton et al. (1988) employed a PIP as the one previously described. After the FC lesions, 19 sessions of postoperative training were conducted and peak times increased by 22% relative to preoperative levels. Meck (2006) found that dopaminergic drugs (haloperidol, methamphetamine and CCK-8S) did not alter temporal control in rats with frontal cortex lesions. Postoperative training was conducted 3 months after the lesions and no assessment without drugs post lesions was presented.
Another type of lesion, preferred over aspiration for its speciicity in targeting DA neurons, is stereotaxic
guided infusions of 6-hydroxydopamine (6-OHDA), a neurotoxin that selectively destroys DA neurons. This lesion model in which 6-OHDA is infused in the mPFC, has contributed to the generation of a modiied DA hypothesis for schizophrenia. More speciically in this 6-OHDA model, the depletion of dopaminergic neurons reaches the ventral tegmental area destroying the DA mesocortical system and in turn increases levels of DA in the striatum and nucleus accumbens (NAC) (Li et al., 2010).
Li et al. (2010) performed bilateral infusions of 6-OHDA in the mPFC of adolescents rats and adult rats and found a signiicant decrease in grooming and social behavior. The researchers paralleled these indings to negative symptoms observed in schizophrenia. It is important to note that the negative symptoms of schizophrenia have received less attention than positive symptoms within research that employs animal models to better understand this disorder (Jones, Watson, & Fone, 2011).
Some operant conditioning procedures, other than the PIP, in conjunction with 6-OHDA lesions of the mPFC have been conducted by Martin-Iverson, Szostak, and Fibiger (1986) and Sokolowski and Salamone (1994). The former authors found that mPFC lesions using 6-OHDA failed to inluence intravenous self-administration of cocaine. Sokolowski and Salamone found that rats infused with 6-OHDA responded more and earned less reinforcers than sham rats when exposed to a differential-reinforcement-of-low rates schedule of reinforcement in which behavioral inhibition is required to maximize the number of reinforcers earned. These two studies examined behavior of rats 3 days after surgery, and conducted the corresponding procedures for 10-14 days to assess the effects of such lesions on their corresponding measures.
To our knowledge, no study has yet evaluated the effects of 6-OHDA lesions as a model of schizophrenia using a PIP. If distortion of temporal control is implicated in schizophrenia, then it is worth examining the 6-OHDA model using a PIP. The present experiment examined the effects of 6-OHDA lesions in the mPFC of rats trained in a PIP (FI 30 s, 90-s peak trials, and 10-s ITIs). The time of recovery from surgery was longer (5 weeks) than most of the previous studies described. A longer recovery time was used to ensure that the lesions had taken effect (Kostrzewa & Jacobowitz, 1974) and that full recovery from surgery and anesthesia would not account for the effects observed. Additionally, training after the lesions was extended (38 sessions) to examine if recovery of behavior (to levels observed prior to the lesions) occurred after the lesions.
Method
Subjects
experiment, with previous experimental history with schedules of positive reinforcement, served as subjects. Rats were maintained at 85% of their free-feeding body weight, each housed individually with water available in their home cages. Illumination was kept in a 12-hr light /dark cycle and temperature and humidity were kept constant. All experimental procedures were approved by the Animal Care and Use Committees at Armstrong Atlantic State University and Mercer University School of Medicine.
Apparatus
Four modular standard operant conditioning chambers for rats each kept in an isolation cubicle (Coulbourn Instruments, Whitehall, PA) were used. Operant chambers were 31 cm by 26.4 cm by 32.8 cm. Each chamber had modular walls with iller panels and one standard response lever each which required a force of 0.25 N to depress. The standard stainless steel response lever protruded 2 cm from the wall, was 3.5 cm wide, was at a height of 6.6 cm from the bar loor and was 3.2 cm from the feeder trough on the same wall. A houselight was positioned in the upper-right corner of the same wall as the lever and the feeding trough. There were two halves of the trough, one for liquid reinforcers on the left and one for dry reinforcers on the right. Only the dry reinforcer half of the trough was used for this experiment and was illuminated each time a reinforcer was delivered. Sucrose-based pellets (45-mg) functioned as reinforcers. Experimental procedures and real-time data collection were programmed using Graphic State (Coulbourn Instruments) software.
Procedure
Fixed-interval (FI) schedule pretraining. During these sessions, a FI 30-s schedule was in effect. The schedule proceeded as follows: the irst press after 30 s resulted in the delivery of a pellet, the houselight illuminating the chamber turned off during the delivery of every reinforcer, simultaneously the magazine light was on for 3 s, and then a new FI commenced. Sessions ended after 40 reinforcers were delivered. Each rat was exposed to 22 sessions.
Preoperative peak-interval procedure (PIP) training. Rats were trained at approximately the same time, 5 days a week, in a peak-interval procedure (PIP). The procedure consisted of 42 FI 30-s trials and eighteen 90-s peak trials. In the FI 30-s trials, reinforcers were available at the irst press after 30 s had elapsed. The houselight was on except for when the reinforcer was delivered (the magazine light was illuminated at this point). In the peak trials the houselight remained on for 90 s and no reinforcers were delivered. All trials were separated by a 20-s intertrial interval (ITI) in which the houselight and magazine light were turned off and lever presses had no programmed consequences. Sessions lasted approximately 70 min and each rat was exposed to 38 sessions prior to surgery.
Postoperative PIP training. This phase of the experiment began 5 weeks after surgery. Training was identical to that described above for preoperative training and the same numbers of sessions were conducted.
DA depletion by injection of 6-OHDA. The twelve rats were divided into two groups: six rats were infused with 6-OHDA (6-OHDA group) and ive rats were infused with vehicle (sham group). Groups were formed counterbalancing response rates. One rat was excluded from the study, prior to surgery, due to illness. The rats were anesthetized with a ketamine/xylazine (800 mg/120 mg; 1 ml/kg) mixture, shaved, and placed in a stereotaxic apparatus (Stoelting,Wood Dale, IL) on a thermal pad to maintain optimal body temperature. Xylocaine was added to the shaved skin prior to the initial incision. Burr holes were made in the skull and the dura mater removed. Solutions of either 6-OHDA or ascorbate vehicle were injected through a Hamilton syringe into the medial prefrontal cortex (mPFC) at four locations (AP +2.6 mm, +2.3 mm from bregma, L + 0.75 mm, DV -3.4 mm, -3.6 mm from skull). Each rat received four infusions, two per side of either 6-OHDA or vehicle. Each injection of 6-OHDA consisted of 2.0 mg 6-OHDA/500 µl 0.02% ascorbate-vehicle (10 mg/50 ml) prepared in an eppendorf tube and covered in foil. Infusions of 1 µl of 6-OHDA or vehicle (0.02% ascorbate saline) were conducted at a rate of 0.2 µl/min. After each infusion was completed, the Hamilton syringe was left in place for three min before slow removal. This was repeated with the other three sites. Bone wax was used to seal the skull and skin was closed with surgical wound clips. Each rat was placed in a clean, separate cage on a thermal pad after surgery.
Results
Before the lesions were performed, all rats (n = 11) were responding similarly, with mean peak times of 30.41 s (SEM = 0.29) and mean overall response rates (for peak trials) of 27.96 resp/min (SEM = 0.33).The remaining data analysis was focused on performance during peak trials.
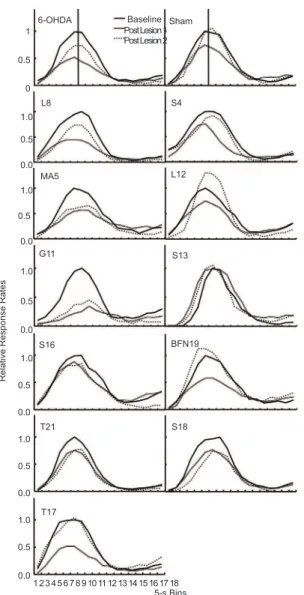
Comparisons between 6-OHDA and sham groups were made calculating response distributions during peak trials in 5-s bins, as shown in Figure 1. Relative response rates were obtained by dividing the overall response rates for each 5-s bins (total of 18 bins for a 90-s peak trial, x axis) by the maximum response rate during baseline. Response rates were obtained for each rat and based on the last ive sessions of each condition. Figure 1 shows the shape of the peak functions for each
rat and also from the group (medians, two top graphs of Figure 1). Post lesion 1 (PL 1) corresponds to the irst ive sessions of training in the PIP after the lesions and post lesion 2 (PL 2) corresponds to the last ive sessions of the total 38 sessions of post-lesion training.
A mixed ANOVA (GLM, repeated measures, SPSS 19) using time (Baseline, PL1, PL2) as within-subjects variable and group (6-OHDA, sham) as between-subjects variable was carried out with the means of the following dependent variables: relative response rates (shown in Figure 1), peak rates, peak times, area under the curve (AUC), and post-reinforcement pauses (PRP). Additionally, parameters related to peak rates and peak times were obtained using a it to a Gaussian function (amplitude version of Gaussian peak function, Origin®
8.5) and were also analyzed in this way.
The means for relative response rates were calculated by averaging the last ive sessions across bins for each rat. The mixed ANOVA for relative response rates yielded no signiicant differences between groups (F = 1.65), but a signiicant time effect (F = 7.29, d.f. = 2, p < .05). The interaction of group and time was not signiicant. Pairwise comparisons indicated that the difference between mean relative rates in baseline and PL1 were signiicant (p < .05) and the difference between PL 1 and PL 2, and Baseline and PL 2 were not signiicant. Further examination of these data indicate that after 38 sessions, recovery of responding occured in sham rats and not in 6-OHDA rats. More speciically, relative response rates for sham rats resembled those prior to the lesions and in some cases (Rats L12, S13, and BFN19) exceeded these baseline levels. Within group analysis for the 6-OHDA group, using paired samples tests (two tailed) yielded signiicant differences between baseline and PL1 (t = 4.36, d.f. = 5, p < .05) and between baseline and PL 2 (t = 3.58, d.f. = 5, p < .05). Following the same analysis for the sham group, there were no signiicant differences across the same conditions (baseline & PL 1, t = 1.47; baseline & PL 2, t = .68).
Mean peak rates (i.e., maximum number of responses in 1-s bins averaged across trials per session) were obtained by averaging these measures across the last ive sessions of each time condition per rat. In the 6-OHDA group, mean peak rates decreased more than in shams, relative to baseline levels. For rats in the 6-OHDA group, peak rates during PL 1 decreased 33% relative to baseline, and during PL2, still they were 19% lower than baseline. In contrast, mean peak rates of sham rats decreased 24% during PL 1 and recovered almost completely to baseline, decreasing only 3%. These results are consistent with those of relative response rates described above. The mixed ANOVA analysis using the same between and within variables previously indicated, yielded a signiicant time effect (F = 9.18, d.f. = 2, p < .05) and no signiicant effects for group (F = .004). The interaction of group and time was not signiicant. Responding of sham rats, given extended training in the PIP, recovered to similar responding levels prior to mPFC lesions. Infusions of 6-OHDA prevented parallel 1
0.5
0
1.0
0.5
0.0
1.0
0.5
0.0
1.0
0.5
0.0
1.0
0.5
0.0
1.0
0.5
0.0
1.0
0.5
0.0
1 2 3 4 5 6 7 8 9 10 11 12 13 14 15 16 17 18 5-s Bins T17
T21 S18
S16 BFN19
Relative Response Rates
S13 G11
MA5 L12
S4 L8
6-OHDA Baseline Sham Post Lesion 1 Post Lesion 2
levels of recovery, despite extended training in the PIP. Within group analysis with 6-OHDA yielded a signiicant difference between mean peak rates in baseline and PL1 (t = 3.22, d.f. = 5, p < .05). The same analysis within the sham group yielded only one signiicant difference that was also between baseline and PL1 (t = 3.45, d.f. = 4, p < .05). The same mixed ANOVA analysis was conducted with the parameter related to peak rate obtained by itting a Gaussian curve to the data shown in Figure 1, and yielded no signiicant effects for group (F = .54) or time (F = .78). When examining within group mean peak rates (parameter), in the sham group, there was a signiicant difference between peak rates between baseline and PL 2 (t = 3.73, d. f. = 4, p < .05).
Mean peak times (i.e., bin with highest number of responses averaged across trials per session) remained unchanged when comparing baseline, PL1, and PL2. More speciically, for the 6-OHDA group, the mean peak times during baseline were 29.49 s (SEM = 3.52), 29.51 s (SEM = 3.59) during PL 1, and 31.46 (SEM = 3.56) during PL 2. For shams, the corresponding mean peak times were 31.52, 31.66, and 31.93 (SEM = 1.19, 1.44, 1.63). The mixed ANOVA for peak times yielded no signiicant effects for group (F = .90) or time (F = .66). The same analysis using the related parameter to peak times (xc) obtained by a Gaussian it paralleled the outcome previously described: no signiicant differences between group (F = .66) or time (F =.39).
Additional data analyses included calculating the AUC (following the theory-free method by Myerson, Green, & Warusawitharana, 2001) for the peak functions shown on Figure 1. This measure was expressed as a proportion of the maximum AUC (values ranged from 0-1) where decreases of the values indicate changes in the shape of the function. One difference between using this measure to examine peak functions in contrast to the measures provided above (i.e., peak rate, peak time) is that it includes the whole instead of a portion of the function. Figure 2 shows the percent change of the mean AUCs for each group. This measure relects that recovery to baseline levels (represented by the horizontal dashed line) occur only in sham but not in 6-OHDA rats, as the values of the AUCs returned to baseline levels after training. This recovery was evident during post lesion 2 (PL 2) for the sham and not for the 6-OHDA rats. The mixed ANOVA using mean AUC yielded a signiicant time effect (F = 8.01, d.f. = 2, p < .05). To further examine this difference in recovery between each group, independent samples t test were conducted; at PL 2 sham and lesion groups differed signiicantly (two-tailed, t = 2.60, d.f. = 8, p <.05).
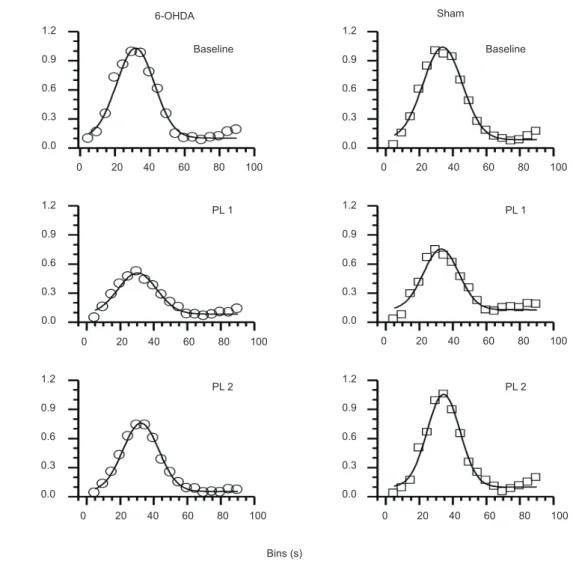
Analysis of mean PRPs (as in Saulsgiver et al., 2006) yielded no signiicant differences between groups (F = .37) or across time (F = .93). As mentioned above, Gaussian functions were obtained (amplitude version of Gaussian peak function, Origin® 8.5) using the medians
of relative response rates shown in Figure 1. The results of these its are shown in Figure 3. The parameters
for the median relative rates (y0, intercept, xc, peak time, w, peak rate, A, amplitude, FWHM, area, and R2
goodness of it) and for individual rats are presented in Tables 1 and 2 respectively. In general, the data obtained during peak trials was well described by the Gaussian its given the obtained high values of best it index R2
(see Tables 1 & 2).
Counts of tyrosine hydroxylase ibers (described in the Method section) were summed across the three images for the same rat for each observer resulting in an overall count for each rat per observer. High and signiicant Pearson correlation coeficients were obtained when the overall counts from the four observers were compared (observer 1 & 2 r = .504, p = .003, observer 1 & 3 r = .950, p < .001; observer 1 & 4 r = .968, p < .001; observer 2 & 3 r = .525, p = .002; observer 2 & 4 r = .551, p = .001; observer 3 & 4 r = .967, p < .001) which relect concordance between observations. Counts across observers were summed for each rat, and then average counts between 6-OHDA (M = 1400.00, Md = 857.00, SEM = 464.36, Min = 473.00, Max = 3427.00) and shams (M = 2500.80, Md = 1542.00, SEM = 674.24, Min = 1178.00, Max = 4282.00) were compared. In general, the mean (and median) number of counts was higher in sham rats than in those infused with 6-OHDA, which is indicative of decreased tissue concentration of DA in the mPFC areas infused with 6-OHDA. Although such difference in mean counts between groups was not statistically signiicant, it was in the expected direction. Images of the striatum used as controls, to ensure that the lesions had remained in the mPFC, were also examined and conirmed that tyrosine hydroxylase neurons were not affected in the striatum of any of the groups.
Discussion
Given enough training, responding of sham rats recovered to levels near baseline after vehicle infusions. Rats infused with 6-OHDA continued to respond generally at lower rates relative to their own baseline as shown in Figure 1, and did not show the same level of recovery as the rats in the sham group. One measure that relects a general change in the shape of the whole function, the AUC, was signiicantly lower in the 6-OHDA than in the sham group during PL2, indicating
Percent Change from Baseline of
AUCs
Sham 6-OHDA
Post Lesion 1 Post Lesion 2 120
100
80
60
40
Figure 3. Gaussian functions derived from relative response rates across 5-s bins for each experimental condition (Baseline, PL1 and PL 2) and for each group (6-OHDA and sham).
Condition Group y0 SE xc SE w SE A SE FWHM Area R2
Baseline 6-OHDA .102 .021 31.787 .459 10.863 .564 .927 .037 25.581 25.232 .974
Sham .086 .019 33.929 .405 11.703 .516 .955 .032 27.558 28.001 .982
PL1 6-OHDA .084 .013 30.165 .618 11.546 .766 .423 .022 27.189 12.249 .958
Sham .128 .022 32.992 .716 10.509 .876 .627 .040 24.746 16.526 .936
PL2 6-OHDA .053 .007 32.290 .202 10.741 .248 .704 .013 25.293 18.964 .995
Sham .098 .019 34.446 .415 9.780 .498 .957 .038 23.030 23.455 .976
Table 1. Parameters of gaussian peak functions (correspond to Figure 3) derived from median relative response rates with corresponding standard errors (SE).
6-OHDA
Baseline Baseline
Sham
PL 1 PL 1
Bins (s)
PL 2 PL 2
1.2
0.9
0.6
0.3
0.0
1.2
0.9
0.6
0.3
0.0
1.2
0.9
0.6
0.3
0.0
1.2
0.9
0.6
0.3
0.0 1.2
0.9
0.6
0.3
0.0 1.2
0.9
0.6
0.3
0.0
Relative Response Rate
0 20 40 60 80 100 0 20 40 60 80 100
0 20 40 60 80 100
0 20 40 60 80 100 0 20 40 60 80 100
Condition Group Rat ID y0 SE xc SE w SE A SE WHM Area R2
Baseline 6-OHDA L8 .054 .022 31.377 .472 12.538 .605 .969 .036 29.524 30.462 .977
MA5 .154 .023 34.040 .531 11.408 .670 .873 .039 26.864 24.974 .968
G11 .168 .021 34.123 .499 9.615 .596 .871 .042 22.642 20.989 .964
S16 .179 .033 32.05 .798 11.654 1.003 .853 .056 27.444 24.918 .931
T17 .102 .026 28.558 .554 11.978 .687 .986 .044 28.207 29.593 .968
T21 .055 .017 30.598 .367 10.52 .444 .965 .032 24.773 25.447 .983
Sham S4 .088 .018 32.101 .372 13.146 .488 .958 .027 30.956 31.581 .987
L12 .165 .028 31.166 .691 11.317 .856 .847 .05 26.651 24.034 .946
S13 .047 .025 38.073 .54 9.237 .639 .958 .052 21.752 22.193 .956
S18 .070 .026 34.796 .530 11.749 .679 .989 .043 27.668 29.133 .969
BFN19 .121 .024 34.352 .532 11.733 .680 .890 .039 27.628 26.189 .969
PL1 6-OHDA L8 .068 .01 29.392 .525 12.556 .664 .409 .017 29.566 12.871 .973
MA5 .209 .018 35.968 .946 10.839 1.181 .375 .031 25.525 10.201 .897
G11 .108 .015 41.448 1.525 10.006 1.856 .201 .029 23.563 5.032 .743
S16 .223 .026 29.887 .840 10.448 1.012 .658 .050 24.604 17.226 .914
T17 .086 .016 28.443 .739 10.825 .892 .449 .029 25.490 12.195 .936
T21 .059 .009 30.546 .273 10.463 .330 .714 .018 24.637 18.725 .990
Sham S4 .109 .006 28.102 .207 9.519 .243 .651 .013 22.418 15.54 .994
L12 .170 .024 30.812 .838 10.618 1.018 .591 .044 25.004 15.736 .916
S13 .109 .033 37.116 .692 11.019 .872 .963 .058 25.948 26.596 .944
S18 .065 .015 35.225 .402 11.683 .516 .716 .024 27.511 20.963 .982
BFN19 .155 .025 33.969 1.144 11.295 1.439 .447 .043 26.597 12.658 .861
PL2 6-OHDA L8 .028 .008 31.798 .210 10.652 .257 .738 .014 25.084 19.700 .994
MA5 .081 .019 35.391 .604 13.088 .816 .597 .028 30.819 19.59 .964
G11 .059 .010 37.602 .533 10.647 .663 .379 .018 25.071 10.120 .964
S16 .060 .017 30.782 .447 13.697 .590 .785 .026 32.255 26.965 .982
T17 .166 .026 28.287 .635 11.296 .773 .875 .047 26.600 24.763 .955
T21 .041 .007 31.699 .207 9.622 .246 .749 .015 22.657 18.068 .994
Sham S4 .102 .031 33.042 .765 11.524 .964 .812 .052 27.137 23.466 .936
L12 .076 .021 33.653 .340 9.275 .401 1.308 .044 21.840 30.418 .982
S13 .095 .025 35.631 .515 8.893 .602 .992 .053 20.942 22.114 .958
S18 .015 .012 37.916 .317 11.178 .403 .731 .020 26.321 20.489 .988
BFN19 .190 .037 31.623 .764 10.338 .925 .996 .069 24.344 25.810 .927
Table 2. Parameters of gaussian peak functions (correspond to Figure 3) for individual rats derived from relative response rates with corresponding standard errors (SE).
a general decrease in response output and a recovery in shams but not in rats infused with 6-OHDA. Also, when examining measures within groups, 6-OHDA showed signiicant decreases in relative response rates when compared to its corresponding baseline. Thus, we propose that motivation to respond and not temporal control was impaired by 6-OHDA lesions (Simpson et al., 2011).
The results of the present study are consistent with previous indings by Meck (2006) in the sense that peak times and peak rates are independent measures. Although the lesions employed by Meck were different than the ones conducted in the present study, they were frontal cortex lesions through aspiration (and their corresponding controls had their skulls removed), the results were somewhat similar in that temporal control measures were unchanged after the lesions when dopaminergic drugs were administered. In this
experiment, Meck employed a PIP with a single interval (FI 40 s and peak trials of 130 s) and did not present the effects of lesions alone on temporal control but showed results of three different dopaminergic drugs three months after the lesions were conducted.
Also similar to the present experiment, the study by Balci et al. (2010a) showed no signiicant changes in the peak times between a group of transgenic mice that underexpress the dopamine transporter (DAT) with high levels of extracellular dopamine and a group of littermate wildtypes both trained in a PIP with two target times (FI 30 & 45 s, with 120-s peak trials). Olton et al. (1988) and Olton (1989) employed a PIP using two times (short, FI 10 s and long, FI 20 s) and 130-s peak trials to examine effects of frontal cortex lesions in rats. In both studies Olton et al. and Olton state that there were no general temporal control impairments and only during the long intervals was there a rightward shift in the peak functions, which corresponds to the later responding than before the lesions. Olton acknowledges lesions of the PFC cannot be truly examined in isolation due to existing connections with other areas of the brain.
By increasing motivation (i.e., increasing reinforcement rate) in a PIP the response functions generated during the peak trials recovered to levels closer to those shown by control mice (Ward et al., 2009). Tentatively, lack of motivation in the presented study was demonstrated by lowered behavioral output and by degenerating the dopamine mesocortical pathway with 6-OHDA.
Thus far, we have pointed to procedural differences between similar studies and the present one: (1) the use of two intervals versus a single interval in the PIP, and (2) neuronal alterations conducted using different methods (i.e., aspiration, genetic manipulations, and 6-OHDA). Olton (1989) and Olton et al. (1988) found impairments in timing when using two instead of a single interval in a PIP, which was viewed as impairment of divided attention. When using a single interval in Olton’s and the present experiment, no evident alterations in temporal control were observed. It could be said that undivided attention is not disrupted in this model of schizophrenia and that when sources of stimulation increase, as in adding another interval to a PIP, then control of such stimuli over behavior may become more challenging.
In terms of the different methods to generate neuronal alterations to model those present in schizophrenia, we contend that the 6-OHDA model may provide an advantage over using transgenic mice. The 6-OHDA model is much more speciic in terms of the different anatomical sites where DA2 receptors are located. In the present experiment we limited the damage to DA neurons in the mesocortical pathway. With knock-out mice all dopaminergic neurons are affected, thus generally altering DA pathways including those more closely associated with motor systems such as the nigrostriatal pathway.
Just as no evident impairments of temporal control were found after 6-OHDA lesions in the mPFC in the present study, Martin-Iverson et al. (1986) found that the same types of lesions in the same location as in the present experiment did not disrupt intravenous self-administration of cocaine. Thus, these authors concluded that the mPFC may not play a critical role in
the maintenance of cocaine self-administration. These authors also found an increase in DA turnover in the striatum and NAC which supports the compensatory response generated by this 6-OHDA model of schizophrenia (Li et al., 2010).
By reviewing the diversity of results obtained within this area of research and what is pertinent to the function of the mPFC, this structure is functionally heterogeneous, and it is dificult to study in isolation (Olton, 1989). The present study examined the role of the mPFC in the temporal organization of behavior. Although it has been shown by Valencia-Torres et al. (2011, 2012) that both PFC and NAC are involved in temporal discrimination, we conclude that the mPFC may structure future behavior and organize it, but it is known that temporal control involves the integration of multiple neural systems (Meck, 2006) not solely mPFC. We contend that in the present study it is possible that compensatory mechanisms from the NAC (Li et al., 2010) may be suficient to maintain temporal control undisrupted in a PIP with a single interval, thus the role of mesocortical dopamine may be more related to motivational aspects of behavior.
The fact that the difference in tyrosine hydroxylase counts between groups was not statistically signiicant represents a limitation of the present study; however, the focus of the present study was on examining behavioral measures and the effects of 6-OHDA on such measures as an animal model of schizophrenia. One reason for the lack of a signiicant difference could be that the dose of 6-OHDA infused was not high enough; other studies such as the study by Li et al. (2010) used a higher dose and obtained clearer differences after processing neural tissue. Another factor that may account for the lack of consistency between groups in this respect is the number of rats included in each group. We contend that despite this inconsistency, the present study has valuable contributions to the existing body of literature in that, to our knowledge, it is the irst study to examine the effects of 6-OHDA lesions as a model of schizophrenia using a PIP. In addition, the present study included longer recovery periods both after lesions and postoperative training in a PIP, relative to most of the previous similar studies in this ield (cf., Kostrzewa & Jacobowitz, 1974). Another contribution of this study is that novel quantitative measures (i.e., AUC and PRPs) were used to examine changes in behavior as a function of neuronal alterations by 6-OHDA.
References
Balci, F., Ludvig, E. A., Abner, R., Zhuang, X., Poon, P., & Brunner,
D. (2010a). Motivational effects on interval timing in dopamine
transporter (DAT) knockdown mice. Brain Research, 1325, 89-99.
Balci, F., Meck, W. H., Moore, H., & Brunner, D. (2010b). Timing deicits in aging and neuropathology. In J. L. Bizon and A. G.
Woods (Eds). Animal Models of Human Cognitive Aging (pp.
161-201). New York: Humana Press.
Body, S., Cheung, T. H. C., Valencia-Torres, L., Olarte-Sànchez,
C. M., Fone, K. C. F., Bradshaw, C. M., & Szabadi, E. (2013).
Pharmacological studies of performance on the free-operant psychophysical procedure. Behavioural Processes, 95, 71-89.
Carroll, C. A., O’Donnell, B. F., Shekhar, A., & Hetrick, W. P. (2009).
Timing dysfunctions in schizophrenia as measured by a repetitive
inger tapping task. Brain Cognition, 71, 345-353.
Catania, C. (1991). Time as a variable in behavior analysis. In I. H.
Iversen, & K. A. Lattal (Eds.), Experimental analysis of behavior: Part I (pp. 1-19). New York: Elsevier Science.
Elvevåg, B., Weinberg, D. R., & Goldberg, T. E. (2002). Short-term
memory for serial order in schizophrenia: a detailed examination of error types. Neuropsychology, 15, 128-135.
Ferster, C. B., & Skinner, B. F. (1957). Schedules of reinforcement. Copley: Acton, MA.
Heidbreder, C. A., & Groenewegen, H. J. (2003). The medial
prefrontal cortex in the rat: evidence for a dorso-ventral distinction based upon functional and anatomical characteristics. Neuroscience and Biobehavioral Reviews, 27, 555-579.
Jones, C. A., Watson, D. J. G., & Fone, K. C. F. (2011). Animal models
of schizophrenia. British Journal of Pharmacology, 164, 1162-1194.
Kostrzewa, R. M. & Jacobowitz, D. M. (1974). Pharmacological
actions of 6-hydroxydopamine. Pharmacological Reviews, 26, 199-288.
Lejeune, H. (1990). Timing: Differences in continuity or generality
beyond differences? In D. E. Blackman & H. Lejeune (Eds.).
Behaviour Analysis in Theory and Practice Contributions and Controversies (pp. 53-90). East Sussex, UK: Lawrence Erlbaum Associates.
Li, Chun-Rong, Huang, G., Sui, Z. Y., Han, E., and Chung, Y. (2010). Effects of 6-hydroxydopamine lesioning of the medial prefrontal cortex on social interactions in adolescent and adult rats. Brain Research, 1346, 183-186.
Martin-Iverson, M. T., Szostak, C., & Fibiger, H. C. (1986).
6-hydroxydopamine lesions of the medial prefrontal cortex
fail to inluence intravenous self-administration of cocaine.
Psychopharmacology, 88, 310-314.
Meck, W. H. (2006). Frontal cortex lesions eliminate the clock speed
effect of dopaminergic drugs on interval timing. Brain Research, 1108, 157-197.
Myerson, J., Green, L., & Warusawitharana, M. (2001). Area under
the curve as a measure of discounting. Journal of the Experimental Analysis of Behavior, 76, 235-243.
Olton, D. S. (1989). Frontal cortex, timing and memory. Neuropsychologia, 27, 121-130.
Olton, D. S., Wenk, G. L., Church, R. M., & Meck, W. H. (1988).
Attention and the frontal cortex as examined by simultaneous temporal processing. Neuropsychologia, 26, 307-318.
Orduña, V., García, A., & Bouzas, A. (2012). Evaluation of rate-dependency and internal clock effects of d-amphetamine.
Behavioural Processes, 90, 428-432.
Roberts, S. (1981). Isolation of an internal clock. Journal of
Experimental Psychology: Animal Behavior Processes, 7, 242-268.
Saulsgiver, K. A., McClure, E. A., & Wynne, C. D. L. (2006). Effects of d-amphetamine on the behavior of pigeons exposed to the peak
procedure. Behavioural Processes, 71, 268-285.
Simpson, E. H. et al. (2011). Pharmacologic rescue of motivational
deicit in an animal model of the negative symptoms of
schizophrenia. Biological Psychiatry, 69, 928-935.
Sokolowski , J. D. & Salamone, J. D. (1994). Effects of dopamine
depletions in the medial prefrontal cortex on DRL performance and motor activity in the rat. Brain Research, 642, 20-28.
Tysk, L. (1983). Time estimation by healthy subjects and schizophrenic
patients: a methodological study. Perceptual and Motor Skills, 56, 983-988.
Valencia-Torres, L., Olarte Sanchez, C. M., Body, S., Fone, K. C.,
Bradshaw, C. M., & Szabadi, E. (2011). Fos expression in the
prefrontal cortex and nucleus accumbens following exposure to
retrospective timing tasks. Behavioral Neuroscience, 125,
202-214.
Valencia-Torres, L., Olarte Sanchez, C. M., Body, S., Fone, K. C.,
Bradshaw, C. M., & Szabadi, E. (2012). Fos expression in the orbital prefrontal cortex after exposure to the ixed interval peak
procedure. Behavioural Brain Research, 229, 372-377.
Ward, R. D., Kellendonk, C., Simpson, E. H., Lipatova, O., Drew, M.
R., Fairhurst, S., ... Balsam , P. D. (2009). Impaired timing precision produced by striatal D2 receptor overexpression is mediated by
cognitive and motivational deicits. Behavioral Neuroscience, 123,
720-730.
Ward, R. D., Simpson, E. H., Kandel, E. R., & Balsam, P. D. (2011). Modeling motivational deicits in mouse models of schizophrenia: