w ww . e l s e v i e r . c o m / l o c a t e / b j p
Original
Article
Box–Behnken
experimental
design
for
extraction
of
artemisinin
from
Artemisia
annua
and
validation
of
the
assay
method
Elviscley
de
O.
Silva
a,
Leonardo
L.
Borges
b,c,
Edemilson
C.
da
Conceic¸
ão
a,
Maria
Teresa
F.
Bara
a,∗aFaculdadedeFarmácia,UniversidadeFederaldeGoiás,Goiânia,GO,Brazil bPontifíciaUniversidadeCatólicadeGoiás,Goiânia,GO,Brazil
cUnidadeUniversitáriadeCiênciasExataseTecnológicas,UniversidadeEstadualdeGoiás,Anápolis,GO,Brazil
a
r
t
i
c
l
e
i
n
f
o
Articlehistory:
Received17December2016 Accepted13March2017 Availableonline17April2017
Keywords: Medicinalplant Artemisinin Extractionprocess Box–Behnkenfactorialdesign Responsesurfacemethodology HPLC
a
b
s
t
r
a
c
t
Obtainingartemisininanditsderivativesisverycostly,whichlimitsaccesstolow-incomepeople.Some hydroalcoholicextractofArtemisiaannua L.,Asteraceae, whichhasshowncomparableantimalarial activitycouldbeanalternativetothepurifiedcompound,especiallyifthecultivarshavehigher con-tentofartemisinin.Theobjectiveofthisstudywastoevaluatetheeffectsoftheextractionparameters (ethanolgraduation,previousshakingtimeinanultrasoundbathanddrug/solventratio)ontheyieldof artemisininintheliquidextractobtainedbypercolationfromA.annuaandthenoptimizetheextraction efficiencyofthiscompound.TheBox–Behnken(33)factorialdesignwasusedinassociationwithresponse
surfacemethodology.Thederivatizationreactionofartemisininwasusedinananalyticalmethodwhich wassubmittedtovalidation,afterreachingthespecificationoftheselectivity,linearity,precision, accu-racyandrobustness.Detectionandquantificationlimitswere1.3and4.0g/ml,respectively.Thelargest
amountofthiscompoundofinterestwasobtainedwithoutanyultrasoundbath,withanethanol grad-uationof95%andadrug/solventratioof2%.Drug/solventratiowasthefactorwhichmostinfluenced extractionefficiency.Themaximumrangeofartemisininyieldwas1.21%.Informationobtainedinthis studycanbeusedforfutureapproachestodeterminingandextractingartemisininfromA.annua.
©2017SociedadeBrasileiradeFarmacognosia.PublishedbyElsevierEditoraLtda.Thisisanopen accessarticleundertheCCBY-NC-NDlicense(http://creativecommons.org/licenses/by-nc-nd/4.0/).
Introduction
ArtemisiaannuaL.,Asteraceae,anannualherbaceousplant,has beenusedforthousandsofyearsintraditionalChinesemedicine totreatfeverandmalariawithoutshowinganysignsoftoxicity
(Naeemetal.,2014;VanderKooy,2014).Ithasalsobeenwidely
usedasatea(WHO,2012)for thetreatmentandpreventionof malariaandtocombatotherdiseases,especiallybythepeopleof sub-SaharanAfrica(BrisibeandChukwurah,2014).
The chemical compound of main therapeutic interest is artemisinin(WHO,2006),asesquiterpenelactonecontainingan endoperoxide ringstructure responsible forpotent antimalarial activityatnanomolarconcentrations(Meshnicketal.,1996).The flavonoidcontentoftheplantdrugcanvarybetween9%and11% andhasalreadybeenshowntoexertantimalarialandantioxidant activity(Ogwangetal.,2011)andenhancetheactivityofthis
lac-tone(Klayman,1985;Elfordetal.,1987;Biliaetal.,2006).
∗ Correspondingauthor. E-mail:[email protected](M.T.Bara).
Obtainingartemisininanditsderivativesisverycostly,sothis increasesthepriceofthedrugonthemarketandlimitsaccess tolow-incomepeople(Flemingand Freyhold,2007).Todatean economicallyviableandsafemethodofsynthesis,capableof sub-stitutingextractionfromtheplantdrug,hasnotbeendeveloped
(Delabayset al.,2001;Fleming andFreyhold, 2007).The
multi-variate optimizationhas beenincreasing the quality of several productsinpharmaceuticalfield.Inthiscontext,theICHguidelines providemanypointstoget“qualitybydesign”(ICH,2009).Thus, theobtainingdryproductswithhighlevelsofartemisininhavea greatimportancetoapplythetoolsoftheexperimentaldesign.
ThehydroalcoholicextractofA.annuawhichhasshown com-parableantimalarialactivity(Wrightetal.,2010;Diawaraetal., 2012)couldbeanalternativetothepurifiedcompound.Theuseof thevegetabledrugwith0.23%ofartemisininhasreportedanIC50 valueof2.85g/mlforthehydroalcoholicextract,whichisclose tothatofpureartemisinin,2.73g/ml(Diawaraetal.,2012).Thus, cultivarswithahighercontentofthiscompoundcouldresultin moreinterestingextractsinthisrespect.
Theuseofexperimentaldesignforassessing andoptimizing extractionprocessesmakesitpossibletoobtainmaximum use-fulinformation,throughfewerexperiments,andtherebyminimize
http://dx.doi.org/10.1016/j.bjp.2017.03.002
leavesofA.annua.
Theobjectiveofthis studywastoestablishthecombination ofparameters, ethanol graduation, previousshakingtime in an ultrasound bath and drug/solvent ratio which would optimize artemisininextractionefficiencyfromA.annuaandthenvalidate themethodused.Thesethreefactorswereselectedbecause rep-resentparameterswitheasyhandlingandarethemainconditions investigatedinseveralworksfoundinliterature.Thus,these vari-ablesmightaffecttheyieldoftheartemisininobtainbyultrasound assistedextraction.
Materialsandmethods
Materials
Thereferencestandardartemisinin(98%)waspurchasedfrom SigmaAldrich.
AerialpartsofArtemisiaannuaL.,Asteraceae,werecultivated, driedandkindlyprovidedbyDivisãodeAgrotecnologiado Cen-troPluridisciplinardePesquisasQuímicas,BiológicaseAgrícolas (CPQBA)at theUniversidadede Campinas, Brazil,inMarch 12, 2012(blockF1).Identificationofthebotanicalmaterialwasdone byPedroMelillodeMagalhães(CPQBA).
Fortheextractionprocess,thedriedplantwaspulverizedina crusherwithahelixandthenparticlesizeclassificationwascarried outusingaBecTelgranulometer.Thevolatilecontentwas deter-minedontheOhausMB35infraredbalance.Weightmeasurements wereperformedonaRADWAGXA110analyticalbalance.
Extractionprocedure
Extractionwascarriedoutbythreestagere-maceration per-formedina percolatorvesselusing1000ml percolators.Factors suchasdrug/solventratio(DSR),ethanolgraduation(ETG)and pre-viousshakingtimeinanultrasoundbath(PTU)wereevaluated. Eachfactorwasevaluatedintriplicateatlow,mediumandhigh levels(−1,1,and0)withamediumpoint,yieldingatotaloffifteen experiments(Table1).Thefactorswerecoded,followingthegiven equation:
Codedvalue=actualvalue−0.5×(highvalue+lowvalue) 0.5×(highvalue−lowvalue)
Table1
Box–Behnkendesignforthreestagere-macerationofArtemisiaannua.
Run PTU(min) DSR(%) ETG(%)
1 −1(0) −1(2) 0(80)
2 1(30) −1(2) 0(80)
3 −1(0) 1(10) 0(80)
4 1(30) 1(10) 0(80)
5 −1(0) 0(6) −1(65)
6 1(30) 0(6) −1(65)
7 −1(0) 0(6) 1(95)
8 1(30) 0(6) 1(95)
9 0(15) −1(2) −1(65)
10 0(15) 1(10) −1(65)
11 0(15) −1(2) 1(95)
12 0(15) 1(10) 1(95)
13 0(15) 0(6) 0(80)
14 0(15) 0(6) 0(80)
15 0(15) 0(6) 0(80)
glassbeakerandsubmittedtoultrasoundforaspecifiedtime.Each
partofthesolventremainedincontactwiththeplantdrugfor24h.
Afterwhichtimethepercolatorwasopened,theextracttransferred
toaliddedcontainerandanewpartoffreshsolventadded,giving
anoveralltotalof72h(3×24h)ofstaticmaceration.Thethree
partsofeachconditionwerethenbroughttogether,homogenized,
andanartemisininassaywasperformedineachconditionofthe
planning.
Duringthreestagere-maceration,thestatisticalanalysiswas
performedusingAction® 2.7softwareinstalledinExcel® (Office®
2010),withwhichtheeffectandinteractiongraphics,themodel
equationanditslackoffitweredetermined,witha95%confidence
interval.
Equipmentandconditions
TheartemisininassaymethodwasperformedusingaWaters®
highperformanceliquidchromatographyapparatus(HPLC),with
e2695separationmodule,aWaters® 2998ultravioletdiodearray
detector equipped with Empower2® Build 2154 software. The
Zorbax column (Agilent) Eclipse C18 (5m) 150×4.6mm was
protected by pre-column Phenomenex SecurityGuard C18 and
maintainedat 30◦C. The reading wastaken at255nm andthe
mobilephaseflow(1.2ml/min)acetonitrile:0.2%formicacid(v/v)
followedagradientof35:65for8min,thenchangedto60:40for
5min,returningto35:65andendingwitha20minrun.
Sampleandstandardsolutionpreparationandderivatization
Thevegetabledrugwastransferredtoavolumetricflaskand
subjected to shaking for 40min with 95% ethanol in an
ultra-sound bath. Then the volume was completed with the same
solvent,homogenized,decantedandfilteredthroughqualitative
filterpaper.Analiquotof1mlofhydroalcoholicextractwas
fil-teredandtransferredtoa10mlvolumetricflask.Then4mlof0.2%
sodiumhydroxidewereaddedand,after50minthevolumewas
completedwith0.2Maceticacid, convertingtheartemisininto
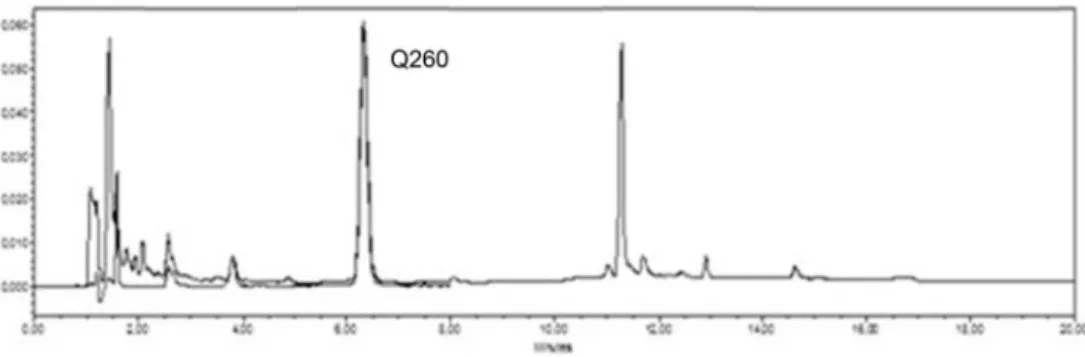
aQ260compound(ZhaoandZeng,1986).Thefinalsolutionwas
homogenized,andinjectedintothechromatographicsystemafter 40min.
Thestandardartemisininwasdissolvedin95%ethylalcoholand preparedinthesameway.
Methodvalidation
Theanalyticalmethodtoassayartemisininwasvalidatedon selectivity,linearityandrange,precision,accuracy,limitsof quan-titation,detectionandrobustnessparameters.
Selectivitywasevaluatedbycomparingtheretentiontimeofthe peakofinterestinthesamplewiththepeakobtainedwithstandard artemisinin.Anultravioletscanningat190–400nmwascarriedout tocheckthepurityofthepeak.
Scheme1. Derivatizationreactionofartemisinin(ZhaoandZeng,1986). Precisionwasverifiedonrepeatabilityandintermediate
preci-sionlevels.Accuracywascalculatedusingthestandardaddition method. To calculate the limits of quantification (LOQ) and of detection(LOD),threeanalyticalcurveswerebuiltwithA.annua solutionsatlowconcentrations,closetothesupposedlimits,using theformulaeLOD=3S×s−1,and LOQ=10S×s−1,where Sisthe standarddeviationofthelinearcoefficientsofthethreecalibration curvesandsisthemeanoftheslopeofthethreeanalyticalcurves. Toanalyzerobustness,someparameterswerevariedinorderto reproducechangesthatcouldoccurinroutineanalysisand inter-ferewiththeresults,suchasstabilityofthesolution,wavelength, formicacidconcentrationinthemobilephase,columntemperature andmobilephaseflow.
Systemsuitabilityparameterswerecalculatedinpeakof inter-est,suchasCapacityFactor(K),Resolution(R),Tailingfactor(T)and TheoreticalPlates(N)(US-FDA,1994)byEmpower2® Build2154 software.
Resultsanddiscussion
Artemisininderivatization
Thederivatizationreactionofartemisininyielded compound Q260,whichabsorbsabout60timesmoreartemisinin(Scheme1). In reaction, through cleavage of the endoperoxide bridge, chromophoregroupswereformedintheQ260compound(Zhao
andZeng,1986).
Thisbehavior occurredeven inthederivatization performed usingheatingat50◦Cfor30min,aspreviouslydescribedbyother
authors(ZhaoandZeng,1986;Marcheseetal.,2001;Haoetal.,
2002;Erdemogluetal.,2007;Diawaraetal.,2011).Heatingwas
notusedinthisexperiment becauseitwasnotessentialforthe totalhydrolysisofartemisininandthisreducedtheareavaluesof thechromatographicpeaksbyalmost15%.
Methodvalidation
Analyticalmethodvalidationisanessentialcomponentofthe measurescarriedoutinalaboratory,whichmakesforthe produc-tionofreliableresults.Theaimofvalidationistoshowthatthe analyticalmethodissuitedtoitspurpose(Celeghinietal.,2009).
Thesystemsuitabilityparameterswerewithinthose recom-mended(US-FDA,1994),whichindicatedthatcompoundQ260was satisfactorilyseparatedfromtheothersubstancesoftheplantdrug.
Diawaraetal.(2011)alsoperformedthederivatizationmethod
withasatisfactoryseparationoftheQ260compound,witha reten-tiontimeof10.5min.
Themethodwasselective,andpresented acompound Q260 retentiontimeexactlythesameforboththestandardandA.annua (6.3min)(Fig.1).Thescanspectrumofthepeakinthevegetable drugchromatogramindicatedthatitwasasinglesubstance(Fig.2), therebyshowingthattheseparationwasefficient.
Theanalyticalcurveofstandardartemisininresultedinanr2of 0.9996,withaconcentrationrangingfrom247.9to743.8g/ml
Fig.1.OverlappingchromatogramsofthecompoundQ260forstandardandA.annua.
–10 000 0
–20 000
–30 000
–1 0 1
Residues
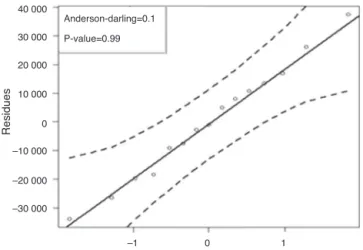
Fig.3.ResiduenormalitygraphaccordingtotheAnderson–Darlingtest.
and a linear equation of y=12,277x−25,352.4. Analysis of the linearityoftheplantdrugresultedinanr2of0.9925,witha con-centrationrangingfrom25to75mg/mlandalinearequationof y=13,373.7x−39,053.9.Theresiduenormalitygraphisplottedin
Fig.3.TheANOVAtestshowedsignificanceforlinearregression (p=2.1E−15) and themodel showednolack offit of the ana-lytical curve (p=0.78). For residues,the Anderson–Darling test indicatedthepresence ofnormal distribution(p=0.99) andthe Breush-Pagantestindicatedhomoscedasticity,i.e.,constanterror variance(p=0.22)betweenthepointsanalyzed.
Some studies on method validation for the analysis of artemisinininA.annuaonlydescribetheparametersobtainedin thestandardanalysisof thiscompound and nottheplantdrug
(Marchese etal.,2001;Erdemogluetal., 2007;Liuet al.,2007;
Celeghiniet al.,2009).The standard presents a purity of more
than98%,whilethevegetabledrugusuallypresentsbetween0.01 and1.5%ofartemisinin(Atemnkengetal.,2009).Asother sub-stancesinthecomplexmatrixoftheplantdrugcaninterferein theresultsoftheanalytical method,itisthereforeimportantto evaluatethevalidation parameters in theanalysis of theplant drug.
Precisionassessedforthevegetabledrugattherepeatability levelresultedinarelativestandarddeviation(RSD)of3%,while attheintermediatelevel, theRSDwas4.5%.Thesevalues were lowerthanthoseobtainedinotherstudies(Rehderetal.,2002;
Diawaraet al.,2011; Suberu et al.,2013).The accuracy of this
methodwas 100.1±4.5%, a satisfactory result when compared tothe102.3±16.8%obtainedbyDiawaraetal.(2011),whilethe standarddeviationwasover3.7timeslower.Thelimitsofdetection andquantificationwere1.3and4.0g/mlofartemisinin, respec-tively.
Themethodwasrobustforallparametersevaluated,withRSD valuesbetween0.15and2.39%(Table2).Thevaluesofpeakareas relatedtothecompoundQ260werestabilizedonlyatleast40min aftertheadditionof0.2Maceticacidattheendofderivatization, whichincreasedtheprecisionandaccuracyofthemethod.
Table2
Resultsoftherobustnesstestanalysis.
Parametersevaluated Alteredcondition RSD(%)
Solutionstability 0–210min 0.58
Wavelength ±2nm 0.29and1.22
Formicacid concentrationinthe mobilephase
±10%(v/v) 0.33and0.67
Columntemperature ±2◦C 0.15and0.45
Flowrate ±0.03ml/min 0.85and2.39
3 0 10 80 0.92
4 30 10 80 0.94
5 0 6 65 1.05
6 30 6 65 0.99
7 0 6 95 1.02
8 30 6 95 0.96
9 15 2 65 1.08
10 15 10 65 0.90
11 15 2 95 1.21
12 15 10 95 0.92
13 15 6 80 0.98
14 15 6 80 0.97
15 15 6 80 0.98
Extractionprocedure
The A. annua used in this experiment came from the
Cen-troPluridisciplinardePesquisasQuímicas,BiológicaseAgrícolas
(CPQBA)attheUniversidadedeCampinas(Unicamp,Brazil)and
containedabout1.2%artemisinin(Rodriguesetal.,2006;Celeghini
etal.,2009).
Macerationandpercolationareextractionmethods inwhich different solvents are used to obtain artemisinin (Briars and
Paniwnyk,2013).FlemingandFreyhold(2007)usedethanolasan
extractorliquidandobtainedthebestresultswithethanolcontent ofmorethan90%.Theyfurtherconcludedthatethanolextracts moresubstances,whichcouldbeadvantageouswhentheaimisto obtainartemisininextractandtheothercompoundspresentinthe synergisticplantdrug.
Theamountofthecompoundofinterestextractedforeach con-ditionispresentedinTable3.Themaximumartemisinincontent of1.21%issimilartothatobtainedforA.annuafromtheCPQBA
(Rodriguesetal.,2006;Celeghinietal.,2009).
TheParetograph(Fig.4)showedthatincreasedDSRwasthe mainfactorwhich influencedextractionefficiency,and reduced linearefficiency,asfoundbyFleming andFreyhold (2007).The regressionequationthatrepresentsthemodelforartemisinin con-tentisshowninEq.(1)andR2 adj=0.9888.ThisresultofR2 adj demonstrates that themodel ishighly explainable byanalyzed variables.
DSR (L)
ETG (Q)
PTU (L)
DSR (L) × ETG (L)
PTU (L) × DSR (L)
ETG (L)
DSR (Q)
PTU (Q)
PTU (L) × ETG (L)
Standardized effect estimate (absolute value)
p=0.05 0.2419463 1.298612 –3.5919
3.771858 4.52813
–6.76689 –6.85777 –8.00698
–29.2654
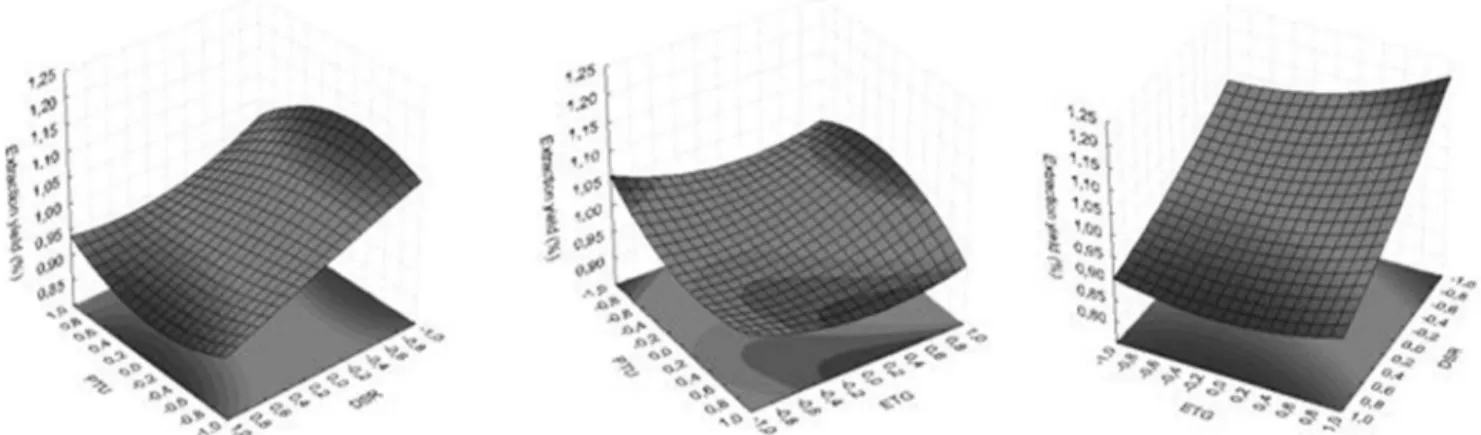
Fig.5. ResponsesurfacegraphofartemisininyieldwithPTU × DSR(left),PTU× ETG(center)andETG × DSR(right).
Art=0.98−0.030A−0.12B+0.037C+0.020AB+0.001AC
−0.027BC−4.583E−003A2+0.018B2+0.033∗C2+
+0.057A2B−0.052A2C+0.020AB2 (1)
Responsesurfacemethodology(RSM)isastatisticaltechnique whichisusedfortheconstructionofanempiricalmodel, employ-ingthemostimportantvariablesandtheireffects(ErbayandIcier,
2009;Yangetal.,2009).TheBox–Behnkenexperimentaldesign,
basedonafractionalfactorialdesignatthreelevels(low,medium andhigh)isusedforeachfactorstudied(PortalAction,2014).
Fromthegradientmodel,theoptimalconditions(Fig.5)forthe bestextractionefficiencyoccurredwithaPTUof12.28min,aDSR of2.03%andanETGof94.96%.
Itwasnotfoundintheliteraturepapersthatapplythedesign ofexperiments(DOE)intheextractionofA.annuaextraction.
Conclusion
FromtheBox–Behnkenexperimentaldesign,thebest combina-tionoftheDSR,ETGandPTUfactorswasfound.Themainfactor underlyingartemisininextractionefficiencywastheDSR. Infor-mationobtainedinthisstudycanbeusedforfutureapproachesto determiningandextractingartemisininfromA.annua.Validation oftheanalyticalmethodfordeterminingartemisininfromA.annua compliedwithallthespecificationsofthetests.Using derivatiza-tionofthecompound, theHPLC-UVmethodincreaseddetector responseandmadeitpossibletoincreasethelimitsofdetection andquantification.
Authorscontributions
EOS:acquisitionofthedata,analysisandinterpretationofthe data,draftingofthearticle;LLB:statisticalexpertise,draftingof thearticle;ECC:conceptionanddesign,provisionofstudy mate-rials;MTFB:conceptionanddesign,provisionofstudymaterials, obtainingoffunding,draftingofthearticle.
Conflictsofinterest
Theauthorsdeclarenoconflictsofinterest.
Acknowledgements
Theauthorswould liketothankPedroMelillodeMagalhães (CPQBA/Unicamp)forprovidingtheplantmaterialandCNPqforits financialsupport.
References
Atemnkeng,M.A.,Chimanuka,B.,Dejaegher,B.,Heyden,Y.V.,Plaizier-Vercammen, J.,2009.EvaluationofArtemisiaannuaL.infusionefficacyforthetreatment ofmalariainPlasmodiumchabaudichabaudiinfectedmice.Exp.Parasitol.122, 344–348.
Bilia,A.R.,Magalhaes,P.M.,Bergonzi,M.C.,Vincieri,F.F.,2006.Simultaneousanalysis ofartemisininandflavonoidsofseveralextractsofArtemisiaannuaL.obtained fromacommercialsampleandaselectedcultivar.Phytomedicine13,487–493. Briars,R.,Paniwnyk,L.,2013.Effectofultrasoundontheextractionofartemisinin
fromArtemisiaannuaL.Ind.CropProd.42,595–600.
Brisibe,E.A.,Chukwurah,P.N.,2014.Productionofartemisinininplantandin micro-bialsystemsneednotbemutuallyexclusive.In:Aftab,T.,Ferreira,J.F.S.,Khan, M.M.A.,Naeem,M.(org.),Artemisiaannua–PharmacologyandBiotechnology, Berlin:Springer-VerlagHeidelberg,pp.269–292.
Celeghini,R.M.S.,Sousa,I.M.O.,Silva,A.P.,Rodrigues,R.A.F.,Foglio,M.A.,2009. Devel-opmentandvalidationofanalyticalmethodologybyHPLC-IRforevaluationof artemisininonArtemisiaannuaL.Quim.Nova32,875–878.
Delabays,N.,Simonnet,X.,Gaudin,M.,2001.Thegeneticsofartemisinincontentin ArtemisiaannuaL.andthebreedingofhighyieldingcultivars.Curr.Med.Chem. 8,1795–1801.
Diawara, H.Z., Gbaguidi, F., Gbenou, J., Laleye, A., Semde, R., Some, I., Sinsin, B., Moudachirou, M., Leclercq, J.Q., Evrard, B., 2012. Conseil africain et malgache pour l’enseignement superieur – CAMES. Formula-tion of oral pharmaceutical dosage forms containing crude extracts of ArtemisiaannuaL.Pharmacopéeetmedicine traditionnelleafricaine, v.16., http://publication.lecames.org/index.php/pharm/article/view/27 (accessed February2014).
Diawara,H.Z.,Gbaguidi,F.,Evrard,B.,Leclercq,J.Q.,Moudachirou,M.,Debrus,B., Hubert,P.,Rozet,E.,2011.Validation,transferandmeasurementuncertainty estimationofanHPLC–UVmethodforthequantificationofartemisinininhydro alcoholicextractsofArtemisiaannuaL.J.Pharm.Biomed.Anal.56,7–15. Erbay,Z.,Icier,F.,2009.Optimizationofhotairdryingofoliveleavesusingresponse
surfacemethodology.J.FoodEng.91,533–541.
Erdemoglu,N.,Orhan,I.,Kartal,M.,Adiguzel,N.,Bani,B.,2007.Determinationof artemisinininselectedArtemisiaL.speciesofTurkeybyreversedphaseHPLC. Rec.Nat.Prod.1,36–43.
Fleming,A.,Freyhold,M.,2007.AssessingtheTechnicalandEconomicViabilityof theEthanolicExtractionofArtemisiaannuaL.withSpecialReferenceto Tanza-nia, http://www.mmv.org/sites/default/files/uploads/docs/publications/6%20-%203ethanolic-extraction-december-2007.pdf(accessedFebruary2014). Hao,J.,Han,W.,Huang,S.,Xue,B.,Deng,X.,2002.Microwave-assistedextractionof
artemisininfromArtemisiaannuaL.Sep.Purif.Technol.28,191–196. ICH,2009.HarmonisedTripartiteGuideline.GuidanceforIndustry:Q8(R2),
Pharma-ceuticalDevelopment,InternationalConferenceonHarmonisationofTechnical RequirementsforRegistrationofPharmaceuticalsforHumanUse(ICH).U.S. DepartmentofHealthandHumanServices,FoodandDrugAdministration, Rockville.
Klayman,D.L.,1985.Qinghaosu(artemisinin):anantimalarialdrugfromChina. Science228,1049–1055.
Elford,B.C.,Roberts,M.F.,Phillipson,D.,Wilson,R.J.M.,1987.Potentiationofthe antimalarialactivityofqinghaosubymethoxylatedflavones.Trans.R.Soc.Trop. Med.Hyg.81,434–436.
Liu,C.,Zhou,H.,Zhao,Y.,2007.Aneffectivemethodforfastdeterminationof artemisinininArtemisiaannuaL.byhighperformanceliquidchromatography withevaporativelightscatteringdetection.Anal.Chim.Acta581,298–302. Marchese,J.A.,Rehder,V.L.G.,Sartoratto,A.,2001.Quantificac¸ãodeartemisininaem
ArtemisiaannuaL.–umacomparac¸ãoentreastécnicasdecromatografiaem camadadelgadacomdetecc¸ãodensitométricaecromatografiadealtaeficiência comdetecc¸ãonoultravioleta.Rev.Bras.PlantasMed.4,81–87.
artemisininaemArtemisiaannuaL.porcromatografialíquidadealtaeficiência comdetecc¸ãoporíndicederefrac¸ão.Rev.Bras.Farmacogn.12,116–118. Rodrigues,R.A.F.,Foglio,M.A.,Júnior,S.B.,Santos,A.S.,Rehder,V.L.G.,2006.
Opti-mizationoftheextractionandisolationoftheantimalarialdrugartemisinin fromArtemisiaannuaL.Quim.Nova29,368–372.
Portal Action, 2014. Experimento de Box-Behnken, http://www.portalaction. com.br/649-632-experimento-de-box-behnken(accessedAugust2014). Suberu,J.,Song,L.,Slade,S.,Sullivan,N.,Barder,G.,Lapkin,A.A.,2013.Arapidmethod
forthedeterminationofartemisininanditsbiosyntheticprecursorsinArtemisia annuaL.crudeextracts.J.Pharm.Biomed.Anal.84,269–277.
US-FDA,1994.UnitedStatesFoodandDrugAdministration.ReviewerGuidance –ValidationofChromatographicMethods.Center ofDrugEvaluationand Research,SilverSpring.
WHO,2012.EffectivenessofNon-PharmaceuticalFormsofArtemisiaannuaL.against malaria.GlobalMalariaProgramme.WHOPositionStatement,WorldHealth Organization,Switzerland.
WHO,2006.WHOmonographongoodagriculturalandcollectionpractices(GACP) forArtemisiaannuaL.WHOLibrary,WorldHealthOrganization,Switzerland. Wright,C.W.,Linley,P.A.,Brun,R.,Wittlin,S.,Hsu,E.,2010.AncientChinesemethods
areremarkablyeffectiveforthepreparationofartemisinin-richextractsofQing Haowithpotentantimalarialactivity.Molecules15,804–812.