WATER QUALITY AND HEAD LOSS IN IRRIGATION FILTERS
Túlio Assunção Pires Ribeiro1*; José Euclides Stipp Paterniani2; Rogério Pereira da Silva Airoldi2; Marcelo Jacomini Moreira da Silva2
1
UNICAMP/FEAGRI Depto. de Água e Solo na Área de Qualidade da Água para Irrigação, CP. 6011 13083-970 - Campinas, SP - Brasil.
2
UNICAMP/FEAGRI - Depto. de Água e Solo. *Corresponding author <[email protected]>
ABSTRACT: Among the irrigation systems used today, trickle irrigation is one of the most efficient methods. This research, conducted by means of field tests, had the objective of comparing head loss evolution on water filtration with a disc filter (130 µm) and a non-woven synthetic fabric filter used in a drip irrigation system.
The test consisted of fertirrigation with organic fertilizer, and chemical treatment of the water with sodium hypochlorite. Physical, chemical, and biological parameters were analyzed, such as: pH, turbidity, suspended solids, dissolved solids, EC, hardness, Langelier index, total iron, manganese, sulfides, algae, and bacteria. The water source used in this experiment was from an open reservoir, where an experimental trickle irrigation system had been installed. The research was developed in four steps lasting 30 days each, during different seasons. The chemical factors pH, total iron, and concentration of sulfides presented a medium risk of clogging the emitters. All other physical and biological water quality parameters analyzed resulted in values that did not present an emitter-clogging risk. There was a correlation of results between physical parameters turbidity, suspended solids, and algae, and suspended solids. Fertirrigation influenced water quality. The concentration of free chlorine was higher in the effluent from the disc filter. Head loss evolution in the non-woven synthetic fabric filter was more striking and faster than in the disc filter.
Key words: drip irrigation, filtration, chlorine, non-woven synthetic fabric, fertilizers
QUALIDADE DA ÁGUA E PERDA DE CARGA EM
FILTROS DE IRRIGAÇÃO
RESUMO: Dentre os sistemas de irrigação atualmente utilizados, a irrigação por gotejamento é um dos métodos mais eficientes. Este trabalho teve como objetivo fazer uma investigação experimental para comparar a evolução da perda de carga dos meios filtrantes disco (130 µm) e manta sintética não tecida na filtragem da
água, utilizados em um sistema de irrigação por gotejamento. Nesta comparação utilizou-se a técnica da fertirrigação com fertilizante orgânico e um tratamento químico da água com o hipoclorito de sódio. Durante um ano analisou-se a variação temporal, dos principais parâmetros físicos, químicos e biológicos da água de irrigação que causam problemas de entupimentos nos emissores. Os parâmetros analisados foram: sólidos suspensos, turbidez, pH, ferro, manganês, sulfetos, condutividade elétrica, sólidos dissolvidos, dureza, índice de Langelier, algas e bactérias. Utilizou-se água de um reservatório aberto, onde foi instalado um módulo de irrigação localizada para o estudo. A pesquisa foi desenvolvida em quatro etapas de 30 dias, realizadas em diferentes estações do ano. Os parâmetros químicos pH, ferro e sulfetos apresentaram médio risco de obstrução aos emissores. Os parâmetros físicos e biológicos analisados apresentaram baixo risco de entupimento dos emissores. Houve correlação dos resultados entre os parâmetros turbidez e sólidos suspensos totais e algas com sólidos suspensos totais. A fertirrigação influenciou a qualidade da água. A concentração de cloro livre foi maior no efluente do filtro de disco. No filtro de manta sintética não tecida a evolução da perda de carga foi mais acentuada e mais rápida em relação ao de disco.
Palavras-chave: gotejamento, filtragem, cloro, manta sintética não tecida, fertilizantes
INTRODUCTION
Among the irrigation systems used today, trickle irrigation is one of the most efficient methods. A frequent problem in this type of irrigation system is the clogging of emitters, which is directly related to water quality and filtering system efficiency. Normally, obstructions are caused by a combination of physical, chemical, and
wors-ened due to the practice of fertirrigation, an increasingly used technique in trickle irrigation systems.
Filtering mechanisms can be divided into screen and disc filters, classified as mechanical or surface filter elements, where the filtering process is based on the prin-ciple according to which the pores of the filtering me-dium are smaller than the diameter of the particles that have to be filtered; and as granular or sand filters, where the particles that must be retained are smaller than the pores of the filter element, but retention of these particles is achieved by physical and chemical processes (Adin & Alon, 1986).
Experimental assays in the field have compared the filtering efficiency between 130-mm disc and screen filter elements, and non-woven synthetic fabric filter el-ements. The fabric was more efficient than the screen and disc elements, removing a larger amount of suspension solids and algae that were present in the irrigation wa-ter; however, head loss developed more rapidly in the fab-ric filter as a function of filtered volume (Scatolini, 2001). In this work, comparisons were made by means of field assays to determine head loss evolution as a function of volume filtered by two filters: a disc filter (130µm) and a non-woven synthetic fabric filter, during one year, in a drip irrigation system. The fertirrigation technique was used with application of chlorine during irrigation, in the form of sodium hypochlorite. In this comparison, variations of physical, chemical, and biologi-cal nature present in the irrigation water were also stud-ied throughout the year, which could cause emitter clog-ging problems. A study concerning the influence of fertirrigation on irrigation water quality was also con-ducted.
MATERIAL AND METHODS
The experiment was conducted in the municipal-ity of Campinas, State of São Paulo, Brazil. The criteria adopted to evaluate impurities present in irrigation wa-ter were based on studies performed by Nakayama & Bucks (1986). The water used in the experiment came from a 250 m3 reservoir, consisting of a small weir
sup-plied with water pumped from a small dam that received water contributions from other springs around it.
Equipment
An irrigation system was set up in the experimen-tal area, consisting of an electric-powered centrifugal pump, an automatic irrigation controlling device, two electrical valves with solenoids, drip emitters, two dif-ferential pressure transducers, two pressure regulators, three turbine-type digital water meters in the flow range from 0.6 to 6 m3h-1, two Bourdon gauges, a fertilizer and
chlorine injection system consisting of two piston dos-ing pumps, and a filterdos-ing system consistdos-ing of two
fil-ters, one of them a 130 mm disc filter with a 25.4 mm diameter, and the other a synthetic fabric filter.
Fertirrigation was carried out with an organic-mineral fertilizer applied via irrigation water. The prod-uct was in liquid form, with a 1.27 g cm-3 density.
Ac-cording to the manufacturer, the fertilizer’s composition was 25% organic matter, 3% total nitrogen, and 9% po-tassium in the form of K2O. The bodies for both filters were identical, made of plastic, and the only difference between them was the filter element. This procedure en-sured functional similarity between the filters. The non-woven synthetic fabric-type filter was selected based on the procedure by Scatolini (2001). The specifications pos-sessed by the non-woven synthetic fabric used as filter-ing medium were: normal permeability 0.5 cm s-1,
permit-tivity 1.6 s-1, pore openings 0.150 mm, grammage 380 g
m-2, and thickness 3.8 mm. The pump/motor assembly
sup-plied both filters installed in parallel, therefore under the same head loss conditions. The mean flow through each filter was 0.6 m3 h-1; 69.94 kPa pressure regulators were
installed in order to ensure equal pressure in the filters. The irrigation cycles were established by means of an irrigation controlling device programmed to trig-ger the system twice a day, early in the morning and by the end of the afternoon. The irrigation period lasted two hours, and the fertilizers were applied in the main line of the system for one and a half hours, while the appli-cation of water containing chlorine was completed dur-ing the remaindur-ing time. The source of chlorine consisted of sodium hypochlorite (12%). A required chlorine con-centration value of 2 mg L-1 in the drip line was adopted.
A concentration of 1 to 2 mg L-1 free chlorine was used
in the drip lines for the preventive control of clogging related to the control of algae and slime (English, 1985). Water samplings from the reservoir were taken in the four seasons of the year between 2001 and 2002. Dur-ing the field samplDur-ings, factors related to the quality of trickle irrigation water that could cause drip emitter clog-ging were determined, such as: pH, suspension solids (Ss), turbidity, electric conductivity (Ec), dissolved solids, total iron (Fe), hydrogen sulfides (H2S), manganese (Mn), hard-ness, Langelier index, and concentrations of algae and bac-teria. The collection site was in the main irrigation line, downstream from the pumping system, but upstream from the fertilizer injection system.Water classification for the trickle irrigation system with regard to clogging problems due to physical, chemical, and biological factors followed recommendations by Nakayama & Bucks (1986).
In the analysis of clogging problems related to bicarbonate (Bc), the Langelier saturation index was used to analyze CaCO3 precipitation risk, as proposed by Nakayama & Bucks (1986). This index indicates the pre-cipitation tendency of CaCO3 that is present in irrigation water; positive values indicate a tendency for CaCO3 to precipitate, while negative values indicate that CaCO3 is maintained in the solution (Ayers & Westcot, 1991). The criterion proposed by Pitts et al. (1990) was used to clas-sify the reservoir water with respect to hardness. Bacte-rial populations were determined by the counting method in a Petri dish, using agar (tryptone, glucose, and yeast extract) as a culture medium, with a counting time of 48 h (APHA, 1992a). The algae were counted by the Sedgwick-Rafter method, according to the “Standard Methods for the Examination of Water and Wastewater” (APHA, 1985). To monitor head loss at the filters, dif-ferential pressure transducers were used, with pressure gauges located before and after the filters. The data were stored in a data acquisition system (datalogger). The head loss increase caused by retention of impurities in the fil-ters was determined based on the volume filtered. Filter cleaning was performed when a pressure differential higher than 40 kPa was reached.
RESULTS AND DISCUSSION
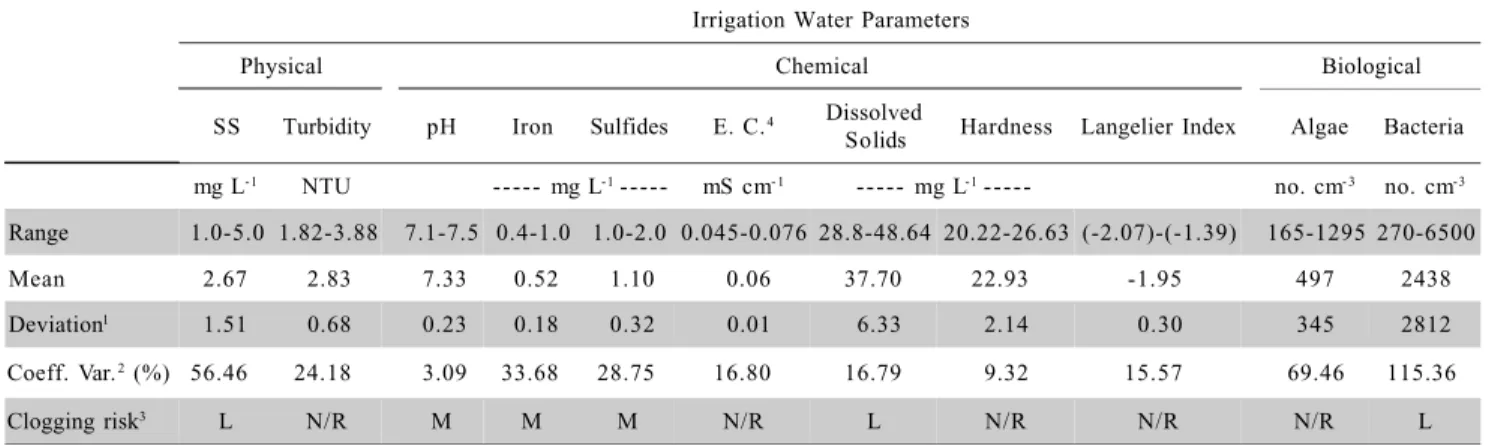
In the first collection period, the water from the reservoir showed good quality to supply a drip irrigation system (Table 1). Except for some chemical factors that presented a medium emitter-clogging risk (pH, total iron concentration, and sulfides), all other water quality pa-rameters analyzed resulted in values that did not present a clogging risk to drip emitters, according to the classifi-cation by Nakayama & Bucks (1986).
According to Pitts et al. (1990), the hardness val-ues for the reservoir water in that period are considered as having a low clogging potential with regard to the
for-mation of CaCO3 precipitates. This can also be confirmed through the results of calculated Langelier index values, which were always negative, indicating that no precipi-tate formation problems exist according to Ayers & Westcot (1991).
Similarly as for the concentration of suspended solids, the turbidity values obtained were also low (between 3.88 and 1.82), indicating that in that period the water pre-sented good quality. The electric conductivity values indi-cated that the water used for irrigation had a very low sa-linity and varied very little during the first water collec-tion period. This is confirmed by the values of dissolved solids in the water, which showed a low clogging risk.
The high standard deviation values, and espe-cially the high coefficient of variation values indicate that there was great variation in the amount of algae present in the water, with highest and lowest concentration val-ues of 1,295 and 165 algae cm-3, respectively.
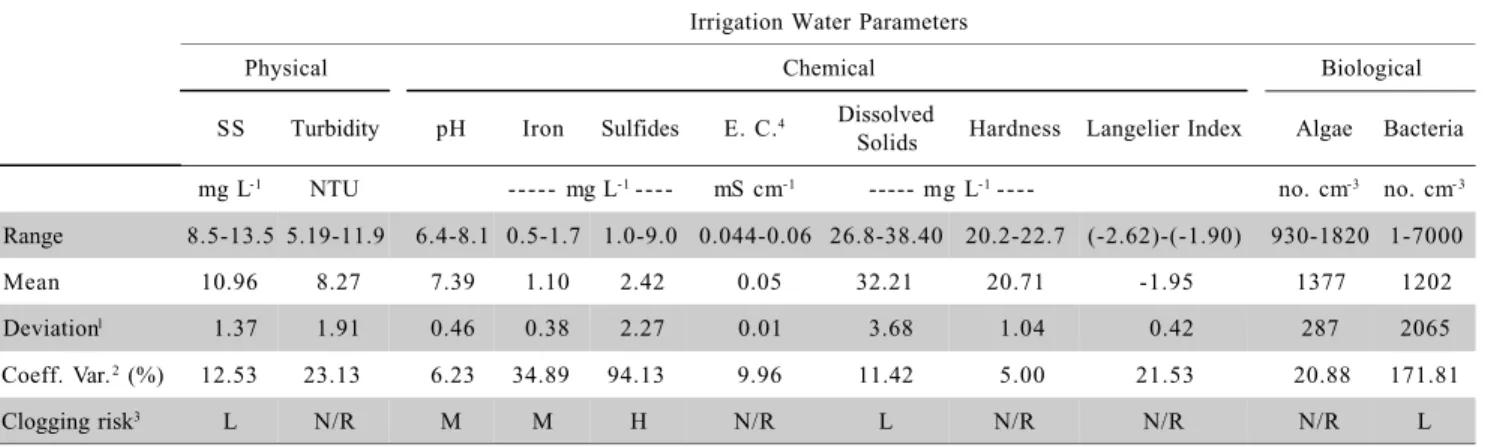
In the second collection period, the quality of the reservoir water presented significant changes in several parameters analyzed. These changes caused a drop in ir-rigation water quality, especially evidenced by an increase in the concentration of total suspended solids, turbidity, iron, sulfides, and algae. Despite the increase in the mean values for these parameters, only the increase in concen-tration of sulfides increased the clogging risk for the emit-ters from medium to high. The other values for the pa-rameters analyzed did not produce a change in clogging risk class. Irrigation water turbidity showed the same ten-dency as that observed for suspension solids, that is, there was an increase in mean turbidity value and a slight de-crease in variability of the data as compared to the pre-vious period (Table 2).
Water electric conductivity decreased in the sec-ond period in relation to the first, and its values were more stable than those previously observed, showing a low clogging risk (Table 2) and following the same ten-dency of the concentration of dissolved solids.
Table 1 - Physical, chemical, and biological factors of irrigation water during the first stage.
1Standard Deviation of the mean;2Coefficient of variation;3L - low risk; M - medium risk; H - high risk; N/R – not rated;4Electric
conductivity.
Irrigation Water Parameters
Physical Chemical Biological
SS Turbidity pH Iron Sulfides E. C.4 Dissolved
Solids Hardness Langelier Index Algae Bacteria mg L-1 NTU --- mg L-1--- mS cm- 1 --- mg L-1--- no. cm- 3 no. cm-3
Range 1.0-5.0 1.82-3.88 7.1-7.5 0.4-1.0 1.0-2.0 0.045-0.076 28.8-48.64 20.22-26.63 (-2.07)-(-1.39) 165-1295 270-6500
Mean 2.67 2.83 7.33 0.52 1.10 0.06 37.70 22.93 -1.95 497 2438
Deviation1 1.51 0.68 0.23 0.18 0.32 0.01 6.33 2.14 0.30 345 2812
Coeff. Var.2 (%) 56.46 24.18 3.09 33.68 28.75 16.80 16.79 9.32 15.57 69.46 115.36
Hardness of the reservoir water in the second col-lection period presented a decline in its mean value and a smaller variation of values when compared with those obtained previously. The water still presented a low clog-ging potential with regard to the formation of CaCO3 pre-cipitates, according to the classification by Pitts et al. (1990). The mean Langelier Index obtained was identi-cal to the previous, with a value of –1.95. However, higher standard deviation (0.42) and coefficient of varia-tion values (21.53%) were obtained (Table 2). An increase in the amount of algae present in the water and a substancial decrease in the variation of measurements were observed. Probably, the natural increase in tempera-ture and the number of daily hours of sun could explain this change in relation to the previous stage.
In the third collection period an increase in the mean values of physical parameters occurred (suspended solids and turbidity), with a decline in the chemical (ex-cept concentration of sulfides and Langelier index) and biological parameters (Table 3). The changes, however, were not substantial, so that the clogging risk classifica-tion for each factor analyzed remained unchanged.
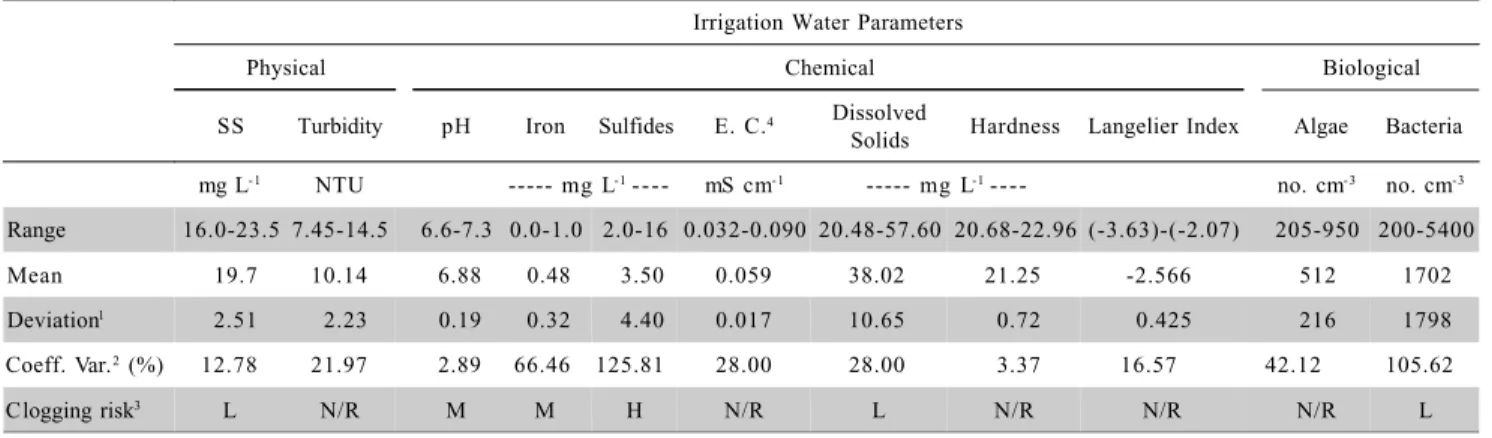
In the last period, except for water turbidity, pH, and iron concentration, there was an increase in all ana-lyzed water quality parameters (Table 4). However, the only change that occurred in relation to the clogging risk of drip emitters was a risk decrease with regard to pH.
The quality of the water used for irrigation in the drip irrigation system varied during the different seasons of the year, and the potential clogging risk of drip emit-ters was medium or high only in relation to chemical pa-rameters (iron, sulfides, and pH). The pH values found through this research are similar to those obtained by Testezlaf el al. (1994), who verified the potential for us-ing water from reservoirs and rivers in drip irrigation sys-tems at agricultural properties that produce vegetables in the region of Campinas. They observed that, among 27 water sources analyzed, 88.9% showed an alkaline pH and a moderate risk of clogging according to the same classification adopted in this research.
Problems with bacterium-iron interactions have occurred at iron concentrations as low as 0.1 mg L-1.
Con-tents of this ion higher than 0.2 mg L-1 are considered as
presenting a significant clogging risk (English, 1985).
Table 2 - Physical, chemical, and biological factors of irrigation water during the second stage.
1Standard Deviation of the mean;2Coefficient of variation;3L - low risk; M - medium risk; H - high risk; N/R – not rated;4Electric
conductivity.
Irrigation Water Parameters
Physical Chemical Biological
SS Turbidity pH Iron Sulfides E. C.4 Dissolved
Solids Hardness Langelier Index Algae Bacteria mg L-1 NTU --- mg L-1---- mS cm-1 --- mg L-1---- no. cm-3 no. cm- 3
Range 8.5-13.5 5.19-11.9 6.4-8.1 0.5-1.7 1.0-9.0 0.044-0.06 26.8-38.40 20.2-22.7 (-2.62)-(-1.90) 930-1820 1-7000
Mean 10.96 8.27 7.39 1.10 2.42 0.05 32.21 20.71 -1.95 1377 1202
Deviation1 1.37 1.91 0.46 0.38 2.27 0.01 3.68 1.04 0.42 287 2065
Coeff. Var.2 (%) 12.53 23.13 6.23 34.89 94.13 9.96 11.42 5.00 21.53 20.88 171.81
Clogging risk3 L N/R M M H N/R L N/R N/R N/R L
Irrigation Water Parameters
Physical Chemical Biological
SS Turbidity pH Iron Sulfides E. C.4 Dissolved
Solids Hardness Langelier Index Algae
Bacteri-a mg L-1 NTU --- mg L-1---- mS cm-1 --- mg L-1---- no. cm- 3 no. cm-3
Range 12.5-19 7.12-16.9 6.8-7.8 0.2-1.0 1.0-5.0 0.042-0.056 26.88-35.84 13.77-19.29 (-2.96)-(-0.98) 120-705 10-760
Mean 17.61 11.30 7.13 0.74 2.83 0.05 31.72 17.96 -2.23 459 223
Deviation1 4.17 2.93 0.42 0.26 1.17 0.01 2.64 1.96 0.66 179 236
Coeff. Var.2 (%) 23.66 25.95 5.86 34.97 41.39 8.33 8.33 10.90 29.76 38.97 105.74
Clogging risk3 L N/R M M H N/R L N/R N/R N/R L
Table 3 - Physical, chemical, and biological factors of irrigation water during the third stage.
1Standard Deviation of the mean;2Coefficient of variation;3L - low risk; M - medium risk; H - high risk; N/R – not rated;4Electric
Precipitated iron develops a red incrustation, which can adhere to the PVC piping and clog the emitters. Some filamentous bacteria, such as Gallionella, Crenothrix, and
Leptothrix oxidize Fe+2, transforming it into Fe+3 which
can precipitate and cause clogging (Ford & Tucker, 1986; Pizarro, 1996). These bacteria are important both eco-nomically and sanitarily, causing the formation of iron incrustations inside pipes or homes, as well as by precipi-tating ferric hydroxide into waters that are rich in this el-ement. They even form extensive geological deposits of iron, and in pipes they constitute frequent causes of ob-structions, in addition to making water take on a brown-reddish coloration. Some types of disinfectants, such as chlorine and copper sulfate, have been used to control these bacteria. The latter has been successfully used at dose rates of 0.3 to 0.5 mg L-1 for the control of iron
bac-teria, such as Crenothrix (White, 1986).
The concentrations of algae and bacteria showed high coefficients of variation during each season of the year, as well as variations between seasons. The dynamic changes in algae populations can represent a hazard to the system if an efficient treatment of irrigation water is not put into action, and indicate great sensitivity of these or-ganisms in relation to variations in water quality. The sea-sonal variations of algal biomass in tropical regions, where light and water temperature do not change much through-out the year, are due to the effects of rains or drought, and essentially to the action of winds. The coincidence between a slight decrease in temperature and an increase in the in-tensity and duration of winds can bring about water circu-lation at greater depths, and consequently cause a sudden variation in algae concentration. In quantitative studies on algae, it is necessary to take into account that the spatial distribution of algal populations is not uniform and that variations, both seasonal and spatial, can be considerable. There is no universal sample-collection method that would ensure the presence of all forms of phytoplankton organ-isms, since some algal species show great diversity in size, sample, and mobility (Di Bernardo, 1995).
Rapid changes in bacterial concentration values were also verified. These sharp changes were detected through variations in the reservoir water measurements made in the laboratory. The sharp variations in bacte-rial growth are due to different conditions in the envi-ronment, such as temperature, pH, and oxygen and nu-trient requirements (Soares & Maia, 1999). For most bacteria, the optimum pH for growth occurs between 6.5 and 7.5. The water reservoir pH varied, on average, from 7.39 (second collection period) to 6.88 (third col-lection period). When sharp changes in biological pa-rameter values occur due to environment-related factors, the filtering efficiency of trickle irrigation systems can become compromised, with the consequent occurrence of emitter clogging problems (Nakayama & Bucks, 1991).
Water hardness showed a low clogging potential in relation to the formation of CaCO3 precipitates in all seasons of the year. This can be confirmed by the Langelier Index, which was always negative during the year.
The Langelier Saturation Index (SI), determined based on the Ca+2, Mg+2, HCO
-3, and CO
2-3 contents at a
given concentration of ions calcium and bicarbonate, pHc, and at the measured pH value, was used to provide a sys-tematic approximation for determination of the risk of formation of calcium carbonate precipitates (United States, 1965). Manganese concentration values below the limit of detection of the equipment were always found in the reservoir water for all samples collected in the four periods.
A constant growth in mean values was observed for both turbidity and concentration of suspended solids in the water from the irrigation reservoir. Even with a growth of about nine times from the first to the fourth stage, on average, the concentration of suspended solids did not reach magnitudes high enough to attain medium to high emitter clogging risks, according to Nakayama & Bucks (1986) classification.
Irrigation Water Parameters
Physical Chemical Biological
SS Turbidity pH Iron Sulfides E. C.4 Dissolved
Solids Hardness Langelier Index Algae Bacteria mg L-1 NTU --- mg L-1---- mS cm-1 --- mg L-1---- no. cm-3 no. cm-3
Range 16.0-23.5 7.45-14.5 6.6-7.3 0.0-1.0 2.0-16 0.032-0.090 20.48-57.60 20.68-22.96 (-3.63)-(-2.07) 205-950 200-5400
Mean 19.7 10.14 6.88 0.48 3.50 0.059 38.02 21.25 -2.566 512 1702
Deviation1 2.51 2.23 0.19 0.32 4.40 0.017 10.65 0.72 0.425 216 1798
Coeff. Var.2 (%) 12.78 21.97 2.89 66.46 125.81 28.00 28.00 3.37 16.57 42.12 105.62
Clogging risk3 L N/R M M H N/R L N/R N/R N/R L
Table 4 - Physical, chemical, and biological factors of irrigation water during the fourth stage.
1Standard Deviation of the mean;2Coefficient of variation;3L - low risk; M - medium risk; H - high risk; N/R – not rated;4Electric
Correlation between physical and biological param-eters
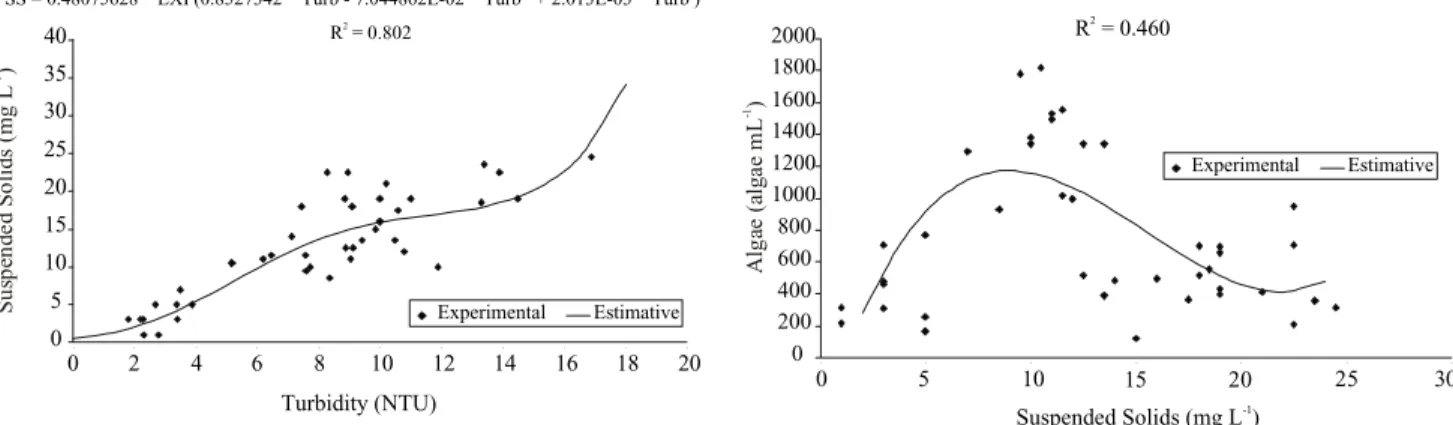
A correlation analysis was made between physi-cal and biologiphysi-cal parameters. Equations showing the best coefficients of regression were obtained for the fol-lowing parameters: turbidity in relation to suspended sol-ids (Figure 1), suspended solsol-ids in relation to turbidity (Figure 2), and algae in relation to suspended solids (Fig-ure 3).
Turbidity is a suspended-solids indicator, due to the dispersion of light beams caused by the presence of particles in suspension, such as silt, sand, colloidal masses, microorganisms, and so forth. (Branco, 1986). However, turbidity alone is not a precise parameter for determination of the degree of emitter clogging risk in surface water sources (Pitts et al., 1990). This physical parameter should be analyzed jointly in a filtering test in the laboratory to be able to measure emitter clogging risk potential (Gilbert & Ford, 1986).
There were high-coefficient correlations between total suspended solids concentration and algae, such as: 0.93 between the total number of particles and algae con-centration; 0.90 between the total number of particles in the size range from 2 to 4µm and the total
concentra-tion of algae; 0.93 and 0.96, between the number of par-ticles in the size ranges from 10 to 15µm and from 15 to 20 µm, respectively, and green algae concentration (Silverman et al., 1983). The same authors mentioned that algae are directly responsible for increases in turbidity.
Since algae behave in water as particles in sus-pension, they may constitute a factor directly responsible for turbidity. Especially in cases where the algal bloom phenomenon occurs, the turbidity caused by algae may reach very high values, preventing light from penetrat-ing but a few centimeters into the mass of water. In ad-dition, in the presence of a large amount of algae con-taining green, bluish, brown, or reddish pigmentation, apparent water coloration phenomena may occur. This coloration, when produced by small flagellates such as
Chlamydomonas and others, gives rise to problems that
are sometimes difficult to solve, especially when a good coagulation and filtration system is not available (White, 1986).
Influence of Fertirrigation on irrigation water quality
Some analyses were carried out beginning in the middle of the third stage, in order to verify the influence of fertilizer injection on irrigation water quality. The only analyses performed were for water turbidity and concen-tration of suspended solids. The water sample collection sites were: Upstream from injection (corresponding to res-ervoir water), downstream from injection (water arriving at the filters), and water in the reservoir tank containing the fertilizer solution. The samples were collected simul-taneously.
Figures 4 and 5 show results obtained for both turbidity and suspended solids. The analyses were per-formed in the period from 14 to 28 March 2002, during the third stage. Figure 4 displays a variation in turbidity for the water sampled from the fertilizer solution reser-voir. In other words, a continuous change in water qual-ity occurred in the fertilizer tank. In the period from days 14 to 26, turbidity increased from 1.36 NTU to 13 NTU. Figure 1 - Correlation between turbidity (Turb) and suspended solids
(SS).
Turb = 1.5029448 * EXP(0.2287658 * SS - 8.98918E-03 * SS + 1279773E-04 * SS )2 3
R = 0.8342
0 2 4 6 8 10 12 14 16 18
0 5 10 15 20 25 30
Suspended Solids (mg L )-1
Experimental Estimative
T
ur
bid
ity
(N
T
U
)
Figure 2 - Correlation between suspended solids (SS) and turbidity (Turb).
SS = 0.48075628 * EXP(0.8527342 * Turb - 7.044862E-02 * Turb + 2.013E-03 * Turb )2 3 R = 0.8022
0 5 10 15 20 25 30 35 40
0 2 4 6 8 10 12 14 16 18 20
Turbidity (NTU)
Experimental Estimative
Su
sp
en
de
d
S
olid
s
(m
g
L
)
-1
Figure 3 - Correlation between amount of algae (algae) and suspended solids (SS).
Algae = -416.6158 + 410.1762 * SS - 32.21755 * (SS) + 0.6948543 (SS)2 3
R = 0.4602
0 200 400 600 800 1000 1200 1400 1600 1800 2000
Al
ga
e
(al
ga
e
m
L)
-1
Experimental Estimative
Suspended Solids (mg L )-1
During the period when the assays were carried out, it was possible to visually notice the development of algae inside the tank, which could be related to this rapid in-crease in turbidity values. Turbidity downstream from the fertilizer injection site was always higher than the mea-surement taken upstream. This means that the water which effectively arrived at the filters had its quality de-preciated in relation to the water that supplied the irriga-tion system.
Similarly as verified for turbidity, there was a continuous growth in the concentration of suspended sol-ids inside the fertilizer tank (Figure 5). The water in the reservoir was also affected by the influence of fertirrigation, since the samples collected after fertilizer injection showed a greater concentration of suspended solids than those collected before that point, except on March 18 2002.
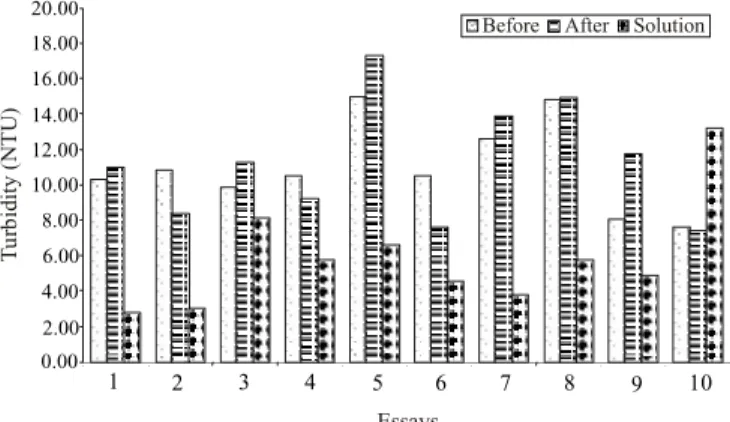
Figures 6 and 7 contain results of analyses per-formed in the fourth and last stage of the experiment to evaluate the influence of fertirrigation on the quality of water used for irrigation. Measurements made
down-stream from the fertilizer injection point showed values higher than those obtained in samples collected upstream of the fertilizer injection point in six of ten assays (Fig-ure 6). In addition, high variability can be noticed in the data corresponding to the fertilizer solution itself, indi-cating that variation in water quality occurred with time inside the solution reservoir tank. In the tenth assay, the turbidity value for the reservoir water was higher than the values measured either before or after the injection point. A rapid development of algae and bacteria probably oc-curred because of the abundance of nutrients in the solu-tion, which resulted in increased water turbidity.
There was some similarity between variation in water turbidity in the fertilizer solution and variation in the concentration of total suspended solids. Turbidity in the fertilizer solution was certainly much more affected by the development of algae and bacteria inside the tank than the concentration of suspended solids. The concen-tration of suspension solids in the solution never showed a value near those obtained in the two other collection points. The total suspended solids concentration in the
Figure 5 - Variation in suspended solids concentration of water sampled upstream and downstream from the fertilizer injection site, and in the fertilizer solution proper, during the third research stage.
14/3/2002 16/3/2002 18/3/2002 20/3/2002 22/3/2002 24/3/2002 26/3/2002 28/3/2002
Date
15.00 30.00 35.00
10.00 5.00 0.00 25.00 20.00
S
us
pe
nde
d
S
olid
s
(m
g
L
)
-1
Solution Before After
Figure 4 - Variation in turbidity of water sampled upstream and downstream from the fertilizer injection site, and in the fertilizer solution proper, during the third research stage.
Figure 6 - Variation in water turbidity upstream and downstream from the fertilizer injection site, and in the fertilizer solution proper, during the fourth research stage.
Figure 7 - Variation in suspended solids concentration of water sampled upstream and downstream from the fertilizer injection site, and in the fertilizer solution proper, during the fourth research stage.
10.00 12.00 14.00 16.00 18.00 20.00
6.00 4.00 2.00 0.00 8.00
Essays
1 2 3 4 5 6 7 8 9 10
T
ur
bi
di
ty
(N
T
U
)
Solution Before After
Essays
1 2 3 4 5 6 7 8 9 10
15.00 30.00
10.00 5.00 0.00 25.00 20.00
S
usp
en
de
d
S
oli
ds(
m
g
L
)
-1
Solution Before After
15.00 20.00 25.00
10.00
5.00
0.00
14/3/2002 16/3/2002 18/3/2002 20/3/2002 22/3/2002 24/3/2002 26/3/2002 28/3/2002 Date
T
ur
bid
ity
(N
T
U
)
water, measured after the fertilizer injection point, was equal or higher than the concentration obtained before that point in 8 of the 10 assays conducted at that stage (Figure 7).
In face of the results obtained in the five final as-says of the third stage and in all those conducted in the fourth, it can be stated that an influence of fertirrigation on irrigation water quality exists, as evidenced by the in-crease in both turbidity and concentration of suspension solids in the water downstream from the point where fer-tilizers were introduced into the irrigation water.
Effect of chlorination on filters
Water samples were collected downstream from the filters that received chlorination to determine the con-centrations of free chlorine, and thereby to compare the filter elements with regard to where the greatest consump-tion occurred. The concentraconsump-tions were calculated to pro-vide approximately 2 mg L-1 free chlorine after the
fil-ters, according to the methodology adopted in this re-search.
The graph in Figure 8 presents the mean chlorine concentration results in the four stages of the research. In the first two stages, the free chlorine concentration means were higher, and a reduction occurred in the other two for both filters. Variations in free chlorine occurred due to variation in water quality along the year with re-gard to the concentrations of algae and bacteria.
There are a series of factors that influence the bactericidal effect of chlorine, among which are the con-tent of oxidable organic matter, concentration of micro-organisms, water pH, temperature, contact time, and wa-ter chemical composition (presence of iron salts, ammo-nia, etc.) (Soares & Maia, 1999). The concentrations of free chlorine were always higher in the disc filter efflu-ents, in all stages. This fact occurred because the non-woven synthetic fabric filter element has greater perme-ability, thus causing greater retention of impurities, and consequently greater free chlorine consumption.
Head loss evolution versus volume filtered into the fil-tering systems.
Figures 9, 10, 11, and 12 contain results of four research stages with regard to head loss evolution at both irrigation filters with time. Head loss showed a continu-ous growth until a moment when an abrupt drop was veri-fied; next, a new growth occurred followed by another decline, and so on. Sharper declines, in which head loss returned to values below 20 kPa represent moments when the filter element was washed, whereas smaller intensity decreases only represent the transition between one irri-gation shift and the next. Head loss evolution in the fab-ric filter was much faster than that observed in the disc filter during the first stage (Figure 9). In this initial ex-perimentation period, reservoir water quality was always very good, with low concentrations of suspended solids, algae, and bacteria (Table 2). Starting at the fourth filter element wash (with a filtered volume in the order of 32.0 m3), head loss increase in the fabric filter became more
expressive. During that stage, it was not necessary to per-form any cleaning operation in the disc filters; the head loss developed at them was nearly stable and always stayed in the interval from 5 to 10 kPa.
During the first stage of the research, the fabric filter had to be cleaned fourteen times. The disc filter did not need to be washed. Filter element cleanings were
per-Figure 8 - Mean concentration of free chlorine in fabric and disc filters during 4 stages.
1 2 3 4
Phase
C
hl
or
in
e
(m
g
L
)
-1
2.00 3.50 4.00
1.50
0.50 3.00 2.50
0.00
Non woven synthetic fabrics with chlorine Disc with chlorine
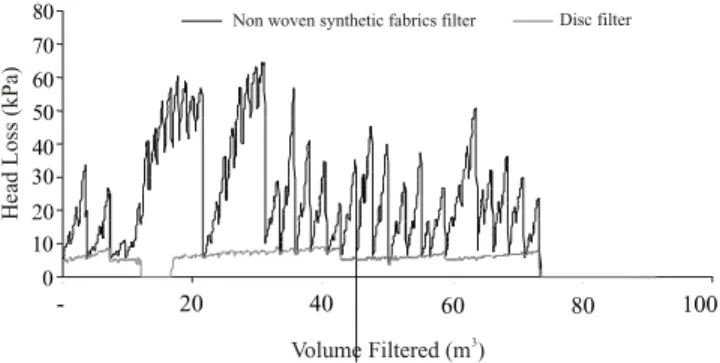
Figure 10 - Head loss variation versus filtered volume for disc and non-woven synthetic fabric filters during the second stage.
He
ad
L
os
s
(k
P
a)
Volume Filtered (m )3
20 40 60 80 100
0
40 60
30
10 50
0
Non woven synthetic fabrics filter Disc filter
Figure 9 - Head loss variation versus filtered volume for disc and non-woven synthetic fabric filters during the first stage.
Non woven synthetic fabrics filter Disc filter
Volume Filtered (m )3
20 40 60 80 100
40 70 80
30
10 60 50
0
He
ad
L
os
s
(k
P
a)
-formed manually between irrigation shifts, with the wa-ter normally supplied by the city.
In the second stage (Figure 10), water quality be-came worse, as evidenced by the increase in mean val-ues obtained for the analyzed concentrations of param-eters suspended solids, turbidity, and algae (Table 2). Similarly as observed in the first stage of the research, the head loss evolution developed during the second stage in the fabric filter occurred faster than in the disc filter. Again, the fabric filter showed greater head loss as com-pared to the disc filter. Eight washes were needed for the fabric filter, while none was needed for the disc filter. As irrigation water quality worsened, head loss ranged from 5 to 35 kPa in the disc filter, and was more commonly between 20 and 30 kPa during the entire second stage.
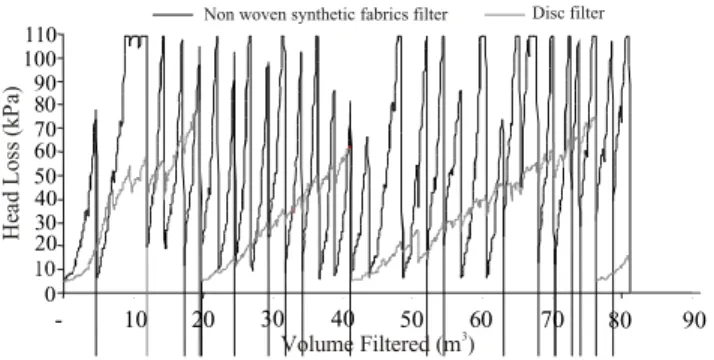
The trends observed in the first and second stages were repeated in the third stage, that is, more filter clean-ing was required because of water quality deterioration. Twelve cleaning operations were performed for the fab-ric filter, and in some instances head loss achieved val-ues of 100 kPa because of the velocity with which local-ized losses occurred (Figure 11). Two cleanings were needed for the disc filter during that period.
The worsening in reservoir water quality during the third stage, as evidenced by an increase in the mean concentration of suspension solids and turbidity in the reservoir water (Table 2), caused a fast increase in head
loss at the filters. At several moments, head loss in the fabric filter exceeded 50 kPa due to the quickness with which the material suspended in water would cause pore obstruction in the filter elements, since the plan was to clean the filters whenever localized head loss reached 40 kPa.
During the last stage (Figure 12), the mean con-centrations of suspended solids and turbidity attained their highest values (Table 2); for this reason, the filters oper-ated under more severe conditions. Similarly as observed in previous stages, the head loss developed in the non-woven synthetic fabric filter was higher than that devel-oped in the disc filter. At some moments, head loss in the disc filter quickly exceeded the maximum programmed loss of 40 kPa. During the period, 23 cleaning operations were needed for the fabric filter, and 3 were needed for the disc filter. The fabric filter’s high wash frequency, as well as the high head loss values attained in the disc fil-ter are compatible with the increase in mean concentra-tions of suspended solids and turbidity for the reservoir water.
After completion of the four research stages, it can be stated that head loss evolution as a function of fil-tered volume in the non-woven synthetic fabric filter was quicker than in the disc filter. Therefore, a higher num-ber of washes occurred for the synthetic fabric filter. This apparent disadvantage of the fabric filter happens because it presents greater retention of particles suspended in wa-ter. The same problem occurred in a study performed by Scatolini (2001), where the author concluded that the faster head loss increase in the non-woven synthetic fab-ric filter was due to a greater retention of suspended sol-ids that partially obstructed the filtering medium.
Another factor that must be considered is that the structure of the fabric filter has greater effective filtering area than the disc filter; therefore, head loss development is faster in the fabric filter. In their paper, Nakayama and Bucks (1991) reported that when high concentrations of particles in suspension are present in irrigation water, the filtering systems of a trickle irrigation system require more frequent cleaning. The authors suggest that for a better suspended particle removal control, an automatic backwash filter should be used.
CONCLUSION
The irrigation water biological parameters showed greater variation. Head loss evolution in the non-woven synthetic fabric and disc filters was influenced by water quality, and this influence was higher in the first filter, resulting in a greate r number of cleaning opera-tions. Future researches involving different types of fab-ric, thicknesses, and filtering areas might indicate which are the best specifications for this filter element to be used in trickle irrigation.
Figure 12 - Head loss variation versus filtered volume for disc and non-woven synthetic fabric filters during the fourth stage.
Volume Filtered (m )3
10 20 50 60
- 30 40 70 80 90
He
ad
L
oss
(k
P
a)
30 80 90
20 0 70
40 50 60 100110
Non woven synthetic fabrics filter Disc filter
Figure 11 - Head loss variation versus filtered volume for disc and non-woven synthetic fabric filters during the third stage.
Volume Filtered (m )3
10 20 50 60
-He
ad
L
os
s
(kP
a)
30 80 90
20 0 70 40 50 60 100110
Non woven synthetic fabrics filter Disc filter
ACKNOWLEDGEMENTS
To FAPESP for financially supporting the project (Proceeding:00/01292-5) and for scholarships granted (Proceedings: 01/02058-9 and 01/01719-1).
REFERENCES
ADIN, A.; ALON, G. Mechanisms and process parameters of filter screens.
Journal of Irrigation and Drainage Engineering, v.112, p.293-304, 1986
AYRES, R.S.; WESTCOT, D.W. A qualidade da água na agricultura. Campina Grande: UFPB, 1991. 218p.
AMERICAN PUBLIC HEALTH ASSOCIATION.Standard methods for examination of water and wastewater. Washington: APHA, 1992a p.9.32-9.34: Heterotrophic plate count.
AMERICAN PUBLIC HEALTH ASSOCIATION:Standard methods for the examination of water and wastewater. 16. ed. Washington: APHA; AWWA; APCF 1985. 1268p
BRANCO, S. M. Hidrobiologia aplicada à engenharia sanitária. 3a
edição. CETESB/ASCETESB, São Paulo/SP, 1986. 640p.
ENGLISH, S.D. Filtration and water treatment for micro-irrigation. In. INTERNACIONAL DRIP/TRICKLE IRRIGATION CONGRESS, 3., Fresno, 1985. Proceedings. St Joseph: ASAE, p.50-57.
DI BERNARDO, L. Algas e suas influências na qualidade das águas e nas tecnologias de tratamento. Rio de Janeiro: ABES; 1995. 140p. FORD, H.A.; TUCKER, D.P.H. Clogging of drip systems from metabolic
products of iron and sulfur bacteria. In: INTERNACIONAL DRIP IRRIGATION CONGRESS, 2., San Diego, 1986.Proceedings. San Diego, 1986. p.212-214
GILBERT, R.G.; FORD, H.W. Operational principles/emitter clogging. In: NAKAYAMA, F.S.; BUCKS, D.A. Trickle irrigation for crop production: Design, operation and management. Amsterdam: Elsevier, 1986. cap.3, p.142-163.
NAKAYAMA, F.S.; BUCKS, D.A Trickle irrigation for crop production: Design, operation and management. Amsterdam: Elsevier, 1986. 383p NAKAYAMA, F.S.; BUCKS, D.A. Water quality in drip/trickle irrigation:
a review. Irrigation Science, v.12, p.187-192, 1991.
PITTS, D.J.; HAMAN, D.Z.; SMAJSTLA, A.G.Causes and prevention of emitter plugging in microirrigation systems. Gainesville: Florida Cooperative Extension Service, University of Florida, 1990. (Bulletin, 258)
PIZARRO, F. Riegos localizados de alta frequencia. 3.ed. Madrid: Mundi Prensa, 1996. 513p.
SCATOLINI, M.E. Utilização de mantas não tecidas como elemento filtrante em sistemas de irrigação localizada. Tese (Doutorado) – Faculdade de Engenharia Agrícola, Universidade Estadual de Campinas. Campinas, 2001.
SOARES, J.B.; MAIA, A.C.F. Água: microbiologia e tratamento. Fortaleza: UFC, 1999. 206p.
SILVERMAN, G.S.; NAGY, L.A.; OLSON, B.H. Variations in particulate matter, algae and bacteria in an uncovered, finished-drinking-water Reservoir.Journal of the American Water Works Association, v.75, p.191-195, 1983.
TESTEZLAF, R.; MATSURA, E.E.; ROSTON, D.M.; PAULA JR., D.R.; PATERNIANI, J.E.; RIBEIRO, T.A.P. Potencialidade do uso de irrigação por gotejamento em propriedades agrícolas produtoras de hortaliças da região de Campinas – SP. In: CONGRESSO BRASILEIRO DE IRRIGAÇÃO E DRENAGEM, 10, Salvador, 1994. p.364-371. UNITED STATES. Department of Agriculture. An index of the tendency of
CaCO3 to precipitate from irrigation waters. U.S. Salinity Laboratories. Soil Science Society of America Proceedings,v.29, p.91-92, 1965.