Presence of riparian vegetation increases biotic condition of fish
assemblages in two Brazilian reservoirs
A vegetação ripária aumenta a condição biótica da assembleia de peixes em dois
reservatórios brasileiros
Fabio Cop Ferreira1, Ursulla Pereira Souza2 and Miguel Petrere Junior2,3
1Departamento de Ciências do Mar, Universidade Federal de São Paulo – Unifesp, Av. Alm. Saldanha da
Gama, 89, Campus Baixada Santista, Ponta da Praia, CEP 11030-400, Santos, SP, Brazil e-mail: fabiocferreira@gmail.com
2Programa de Pós-graduação em Sustentabilidade de Ecossistemas Costeiros e Marinhos, Universidade
Santa Cecília – UNISANTA, Rua Cesário Mota, 08, Boqueirão, CEP 11045-040, Santos, SP, Brazil e-mail: upsouza@gmail.com
3Programa de Pós-graduação em Planejamento e Uso de Recursos Renováveis – PPGPUR, Centro de
Ciências e Tecnologias para a Sustentabilidade – CCTS, Universidade Federal de São Carlos – UFSCar, Rod. João Leme dos Santos, Km 110, CEP 18052-780, Sorocaba, SP, Brazil
e-mail: mpetrerejr@gmail.com
Abstract: The riparian vegetation in lakes and reservoirs is source of course wood
structures such as trunks and branches and is used as sheltering, spawning and foraging habitats for fishes. The reduction of these submerged structures can thus, affect the composition and structure of fish assemblages in reservoirs. Aim: To evaluate the influence of riparian vegetation on the biotic condition of fish assemblage by adapting the Reservoir Fish Assemblage Index (RFAI) to two reservoirs in the Upper Paranapanema river basin, São Paulo State, Brazil. Methods: The RFAI was adapted from metrics related to the
functional characteristics and composition of fish assemblages through a protocol of metric selection and validation, and to its response to the presence of riparian vegetation.
Results: The final RFAI was composed by nine metrics, been lower in sites without riparian vegetation as consequence of the predominance of larger individuals and the percent of piscivorous and detritivorous fishes. Conclusions: These results suggest that increasing shore habitat complexity in reservoirs by maintaining riparian vegetation increases fish biotic integrity.
Keywords: small hydropower plants; RFAI; habitat complexity; biotic integrity; high Paranapanema River Basin.
Resumo: A vegetação riparia em lagos e reservatórios provê estruturas como troncos e galhos que são utilizados como locais de refúgio, desova e alimentação para espécies de peixes. A diminuição destas estruturas submersas pode afetar a composição e estrutura das comunidades de peixes em reservatórios. Objetivo: Avaliar a influência da vegetação ripária sobre a condição biótica das assembleias de peixes por meio da adaptação do Índice de Assembleia de Peixes em Reservatórios (IAPR) a duas represas na bacia do Alto Paranapanema, Estado de São Paulo, Brasil. Métodos: O IAPR foi adaptado a partir de métricas referentes às características funcionais e à composição das assembleias de peixes por meio de um protocolo de seleção e validação e de sua resposta à presença de vegetação ripária. Resultados: O IAPR final foi composto por nove métricas, sendo menor em locais sem vegetação, em função da predominância de indivíduos de grande porte, percentual de piscívoros e detritívoros. Conclusões: Os resultados sugerem que o aumento na complexidade de habitats litorais em reservatórios por meio da manutenção da vegetação ripária aumenta a integridade biótica em peixes.
Palavras-chave: pequenas centrais hidrelétricas; IAPR; complexidade de habitat;
1984; Hughes et al., 2010) and incorporates attributes from the biota that are sensitive to habitat degradation (Angermeier & Karr, 1994). MIs was largely adapted to streams and rivers (Lyons et al., 1995; Ganasan & Hughes, 1998; Araújo et al., 2003; Bozzetti & Schulz, 2004; Pinto et al., 2006; Ferreira et al., 2007; Whittier et al., 2007; Zhu & Chang, 2008; Casatti et al., 2009; Hermoso et al., 2010), lakes and wetlands (Gassner et al., 2003; Irz et al., 2008; Wilson et al., 2013), and reservoirs (Jennings et al., 1995; McDonough & Hickman, 1999; Petesse et al., 2007a; Terra & Araújo, 2010).
By their own nature, reservoirs lack reference areas free of anthropogenic disturbances. Thus adaptation of MIs to such environments has to define the kind of disturbance and to which spatial scale the index will be applied. Here, disturbance refers to the lack of riparian vegetation and the scale refers to segments of the shore area within the reservoir with or without riparian vegetation. Thus, the MI herein adapted (hereafter RFAI) aims to differentiate shoreline segments with riparian vegetation from those where riparian vegetation were removed. We presented a protocol based on the literature for metric selection, calculation and validation of the RFAI.
2. Material and Methods
2.1. Study areaWe sampled two reservoirs (Paineiras and Jorda Flor) in the Turvo river at the headwater of the Upper Paranapanema river basin in the São Paulo State (southeastern Brazil) (Figure 1). The region includes small towns, each with less than 30 thousand inhabitants. The agriculture is the most important economic activity, being the
1. Introduction
Restoration actions in environments under anthropogenic pressures require identifying keystone structures that will help maintaining regional species diversity and biological condition (Tews et al., 2004). In lakes, keystone elements are generally related to underwater structures as artificial reefs, submerged trees or natural coarse woody debris that promote habitat heterogeneity for fishes and invertebrates (Freitas & Petrere Junior, 2001; Sass et al., 2006; Santos et al., 2011; Gois et al., 2012).
The loss of wood debris are among the highest sources of fish habitat degradation in reservoirs across United States (Miranda et al., 2010). Removal of these coarse woody habitats (CWH) has complex effects on ecosystem functioning by altering percent of sheltering and spawning habitats and predator-prey interactions (Roth et al., 2007). Helmus & Sass (2008) for example, showed that experimental removal of CWH resulted in a rapid declining of the yellow perch (Perca flavescens (Mitchill, 1814)) abundance, probably due to losing of sheltering habitats and spawning structures. In another experiment, the piscivorous fish largemonth bass (Micropterus salmoides (Lacepede, 1802)) reduced its home range and lowering its consumption rates after CWH removal, while the opposite pattern was observed after CWH placement (Ahrenstorff et al., 2009).
A natural source of wood debris and trunks is the riparian vegetation, which also influence physical and chemical processes through local temperature control, enhancing bank stability and being source of terrestrial invertebrates for fishes (Washington, 2009). Kaufmann et al. (2014) showed that the structural complexity of riparian cover in lakes are positively correlated with richness of intolerant taxa over a broad range of anthropogenic disturbance, thus being an element promoting biological integrity.
In this study we investigate whether the presence of riparian vegetation enhances condition of fish assemblages in two small reservoirs at southeast Brazil. Assemblage condition was measured by the Reservoir Fish Assemblage Index (RFAI), a multimetric index developed to detect and monitor ongoing impacts on fish biota (Jennings et al., 1995; McDonough & Hickman, 1999; Petesse et al., 2007a; Terra & Araújo, 2010).
Multimetric indices (MIs) has been used for about three decades to evaluate the quality of aquatic environments (Karr, 1981; Fausch et al.,
water demand estimated in 1.64 m3/s for urban use, 4.49 m3/s for industry and 21.7 m3/s for irrigation (São Paulo, 2009). The Turvo river has a drainage area of 1,617 km2 and 70 km extension, crossing only one urban area, the town of Pilar do Sul, which 684.22 km2 and 26.2 thousands of inhabitants, 30% living in the rural zone (IBGE, 2009). The precipitation is about 1,300 mm/year with a dry season between April and September (average of 63 mm/month) and a wet season between October and March (average of 159 mm/month). The average temperatures vary from 23.4 °C between January and March to 16.5 °C between June and July (CEPAGRI, 2011).
The Paineiras reservoir has a longitudinal axis of 10 km, a volume of 35.35 × 10⁶ m3 and a 32 m high dam. It was built in 1912 to supply the Batista power plant, one of the oldest SHPs of the São Paulo State that nowadays generates 2,704 kW (CSPE, 2004). The Jorda Flor reservoir has 2 km of extension, 250 m wide, 1.2 × 10⁶ m3 and a dam of 26.5 m high. It was built in 1949 and generates 1,392 kW (CSPE, 2004). The littoral zones in the reservoirs are composed by secondary forest, pasture and eucalypt plantation, and the reservoirs do not receive significant amounts of urban effluents, as they are above the town of Pilar do Sul. As the majority of the oldest SHPs, there are no fish passages connecting the reservoirs to the lower portions of the basin. In addition, there is a waterfall of approximately 20 m high isolating the Paineiras reservoir from the upstream portion of Turvo river basin. The water retention time and the variability in the operational water level were not available.
2.2. Fish sampling
In each season (dry - September and wet - December 2009), seven sites were sampled in Paineiras reservoir and three in Jorda Flor. Sampling took seven days of fieldwork in each season. In each reservoir, the sampling locations were spatially separated by 1000 m on average, placed at increasing distances from the dam. The fishes were caught using 10 gillnets (mesh sizes from 3 to 12 cm between opposite knots) measuring 20 m length and between 1.50 and 2.40 m high. In order to capture small fishes, we complemented the samples with two funnel traps. The gillnets were positioned perpendicularly to the shore line of the reservoirs and the funnel traps were placed in the margins beside the gillnets. Gillnets and funnel traps were let in the water from late afternoon to the next morning (approximately 12 hours). In September
we lost one gillnet battery in Jorda Flor, so that the total data set consisted of 19 samples (Figure 1).
All fishes were fixed in 10% formalin and, in the laboratory identified at the species level, weighed (grams) and measured (standard length – cm). The species abundance was expressed as capture per unit of effort in number of individuals (CPUEN) and weight (CPUEW). Thus, CPUE represented the number of fishes or total weight captured by 400 m2 of gillnets plus the two funnel traps. Voucher specimens were photographed and deposited at the fish collection of the Departamento de Zoologia e Botânica da Universidade Estadual Paulista, São José do Rio Preto, São Paulo State.
The species were classified by their trophic guild as piscivorous, insectivorous, omnivorous, and herbivorous or detritivorous, defined after the analysis of 850 stomachs. The riparian vegetation at each sampling locaiton was coded as 0 - Absent/Fragmented (no vegetation or only sparse trees) or 1 – Present (dense riparian vegetation). After sampling we registered the limnological variables: temperature (°C), pH, conductivity (μScm–1), turbidity (NTU) and dissolved oxygen (mgl–1), using an electronic device (Horiba, model U-10). The average depth was measured with a demarcated rope (precision of 10 cm).
2.3. Metric selection
Table 1. Description of the candidate metrics and their expected behavior in response to disturbance.
i - Species richness Expected Response
to disturbance
1.Total number of native species (S): As in other adaptations of multimetric indexes, the number of native species is expected to decrease with anthropic degradation following pollution, loss of habitat diversity or introduction of non-native species.
Decrease
ii - Abundance
2.W statistic from ABC curve (W)*: This method was proposed by Warwick (1986) and Clarke (1990) as a tool to infer about the effect of anthropic stress on the biota. The assumption is that less disturbed assemblages have larger and long live species, which in general are less abundant, but have higher dominance in weight. In this case, the dominance in weight is higher than in number of individuals and W has positive values. In disturbed environments, it is expected a predominance of small and opportunistic species that have high abundance but low biomass, resulting in negative values of W (Magurran, 2004). The metric was calculated byW =∑SBi−A / 50 S 1i ( − )
i=1
: , were Bi = the species weight in score i, Ai = the species numeric
abundance in score i and S = species richness. The response of ABC curve to damming was analyzed by Penczak & Agostinho (1997) in Segredo reservoir, and by Gonçalves & Braga (2008) in the SHP Mogi-Guaçu. The pattern followed the expected behavior in all examples.
Decrease
3.Percent of dominance (PDOM): The percent of dominance of the most abundant species is an
indicative of habitat simplification (McDonough & Hickman, 1999) and was used in Brazilian reservoirs by Petesse et al. (2007a) and by Terra & Araújo (2010).
Increase
4.Total number of individuals (N): This metric assumes that the total abundance decreases with
disturbance. As different fish groups can vary in their response to environmental disturbance,
the metric is complemented by the next three metrics (number 5 to 7) referent to different
fish Orders and Families.
Decrease
5.Percent abundance of Characiformes (CHAR)*: This metric was used to evaluate fishes that
use the water column, have visual orientation and are capable to colonize a wide variety of habitats. It was used in substitution to Characiformes richness (Araújo et al., 2003; Petesse et al., 2007a; Terra & Araújo, 2010), with justify in situation such as the present study were there is a small number of species (Magalhães et al., 2008).
Decrease
6.Percent abundance of Siluriformes (SIL)*: This metric intends to evaluate the benthic habitats as a substitution for the number of sucker species proposed by Karr (1981). The number of
Siluriformes was first used in African rivers by Hugueny et al. (1996), and in Brazilian rivers and reservoirs by Araújo et al. (2003), Bozzetti & Schulz (2004), Petesse et al. (2007a) and Terra & Araújo (2010). It is assumed that the abundance of Siluriformes is reduced by the degradation of benthic habitat, which in reservoir can occur as result of siltation or oxygen depletion.
Decrease
7.Percent abundance of Cichlidae (CICH)*: This metric was considered in substitution for Cichlidae species richness used by Petesse et al. (2007a) as an indicator of degradation of the littoral zones used to nest construction.
Decrease
8.Percent abundance of introduced species (INTR)*: Used in substitution for the metric number of introduced species (Araújo et al., 2003; Petesse et al., 2007a). In reservoirs where these species are established, there are in general negative effects on native assemblage structure.
Increase
9.Percent abundance of individuals larger than 30 cm (L30): This metric was proposed by Petesse et al. (2007a) to evaluate the decrease of k-strategists species in favor of r-strategists.
The dominance of r-strategists was verified by Gonçalves & Braga (2008) in the SHP Mogi-Guaçu.
Decrease
iii - Trophic structure
10.Weight percent of piscivorous (PIS): Piscivorous species are in the top of aquatic foodwebs
and their abundance indicates an assemblage well diversified and structured (Karr, 1981).
For all metric related to trophic structure it was use the weight percent because it is a better
indicator of energy assimilation and transfer in foodwebs.
Decrease
11.Weight percent of insectivorous (INS): Insectivorous species, especially those feeding on allochthonous items are dependent on riparian vegetation well structured (Casatti, 2002; Esteves & Aranha, 1999; Menezes et al., 2007; Sabino & Castro, 1990).
Decrease
12.Weight percent of omnivorous (OMNI): A metric related to omnivory was proposed by Karr (1981) as evidence of disruption of the foodweb base. These species are in general
opportunistic and predominate when the foodweb is simplified.
Increase
13.Weight percent of detritivorous (DET)*: It is proposed to evaluate the increase in detritus
sedimentation favoring the species that use this alimentary resource. Increase
as response and the environmental variables as the explanatory matrix. Metrics that did not correlate (Pearson correlation coefficient, p > 0.05) with any of the RDA axes were excluded. The statistical significance of the RDA axes was verified by a permutation procedure (5,000 randomizations). The criterion of redundancy aimed to identify pairs of metrics that expressed the same kind of information. If two metrics were considered redundant (Pearson correlation coefficient ≥ 0.70) the one with the lowest responsiveness were excluded.
2.4. Metric scoring and RFAI calculation
After selecting the metrics each value were ranked with the scores 1, 3 or 5, using as reference the best observed condition (Jennings et al., 1995). For metrics in which high values indicate high environmental quality, the 95th percentile were identified and the observed distribution trisected in the 63th and 32th percentiles. The score 5 was given to values above the 63th percentile, the score 1 to those below the 32th percentile, and the score 3 to values in between these percentiles. For metrics that decrease with anthropic stress, it was considered the values above the 5th percentile and inverted the scores 1 and 5.
The RFAI for each site were obtained summing the individual scored metrics. To verify if the RFAI differed between reservoirs and seasons a two way ANOVA was applied and to identify the most influence metrics it was calculated the Pearson correlation coefficient between the RFAI and each metric. Statistically significant relationships with the environmental variables were used to validate the index. It was done by calculating the Pearson correlation between the RFAI and the limnological variables and depth, and performing a t test to verify the influence of riparian vegetation. A potential source of confusion was the fact that only one site
in the Jorda Flor reservoir had riparian vegetation. Therefore, the t test was repeated only for the Paineiras reservoir in order to see if the results change.
3. Results
3.1. Assemblage composition
Samples yielded 1,952 individuals within five orders, nine families, and 15 species. Each reservoir had 12 species and similar CPUEN. Nonetheless, the CPUEW was approximately 1.6 times greater in Paineiras reservoir. The most abundant species were Geophagus brasiliensis (Quoy & Gaimard, 1824) and Astyanax altiparanae Garutti & Britski, 2000, whereas Hoplias malabaricus (Bloch, 1794) and G. brasiliensis accounted for the highest total weight. Schizodon nasutus Kner, 1858 and Oligosarcus paranensis Menezes & Géry, 1983 occurred only in Jorda Flor while Hyphessobrycon anisitsi (Eigenmann, 1907), Piabina argentea Reinhardt, 1867 and Gymnotus carapo Linnaeus, 1758 only in the Paineiras reservoir. The fish assemblages was composed by five trophic groups. Omnivorous were the most common (8 species), whereas insectivorous, detritivorous and piscivorous were represented by two species each, and herbivorous by only one (Schizodon nasutus). The two piscivorous species (H. malabaricus and Rhamdia quelen (Quoy & Gaimard in Freycinet, 1824) represented 50.3% of the CPUEW in Paineiras reservoir and only 16.7% in Jorda Flor (Table 2).
3.2. Metric selection
Only two introduced species (Oreochromis niloticus (Linnaeus, 1758) - 17 individuals and Cyprinus carpio Linnaeus, 1758 - 9 individuals) were caught, they represented less than 1% of total CPUEN, 2.7% of total CPUEW, and were absent
iii - Trophic structure Expected Response
to disturbance
14.Weight percent of herbivorous (HER)*: The number of herbivorous species was used by Araújo et al. (2003) and Petesse et al. (2007a). This metric intent to evaluate the contribution of species with high-specialized diet, which should be sensible to habitat disruption (Ganasan & Hughes, 1998; Petesse et al., 2007a). In Neotropical reservoirs this group is naturally rare (Agostinho et al., 2007).
Decrease
iv - Reproduction
15.Weight percent of species with parental care (PC)*: This metric was used to evaluate the effect of disruption of littoral zones resulted from siltation or hydrological stress (Petesse et al., 2007b). The species with parental care (Geophagus brasiliensis, Hoplias malabaricus,
Hoplosternum littorale, Oreochromis niloticus and the genera Hypostomus) were based on Suzuki et al. (2005).
Decrease
* Metrics proposed in the present study.
in 10 (52.6% of total) out of the 19 samples. Insectivorous species were absent in 12 sites (63.2%) and herbivorous in 14 (73.7%). Therefore, the metrics related to abundance of introduced species (INTR), percent of insectivorous (INS) and percent
of herbivorous (HER) were excluded from the RFAI due to low variability.
Only the first two RDA axes were statistically significant, explaining 18.2% (p = 0.003) and 12.6% (p = 0.022) of total variability. Species
Table 2. Species captured in the Paineiras and Jorda Flor reservoirs. CPUEN - capture per unit of effort in number of individuals; CPUEW - capture per unit of effort in weight (grams).
Common name
Trophic guild
Parental care
Jorda
For Paineiras
Jorda
For Paineiras
CPUEN CPUEW
Ordem CHARACIFORMES Família ANOSTOMIDAE
Schizodon nasutus
Kner, 1858 Timborê Herbivorous 8.60 708.70
Família CHARACIDAE
Astyanax altiparanae
Garutti & Britski, 2000 Lambari Omnivorous 16.40 26.40 337.30 373.30
Astyanax fasciatus
(Cuvier 1819) Lambari Omnivorous 3.80 3.60 62.00 19.40
Hyphessobrycon anisitsi
(Eigenmann 1907) Lambari Omnivorous 14.00 26.30
Piabina argentea
Reinhardt, 1867 Lambari Omnivorous 0.70 1.40
Oligosarcus paranensis
Menezes & Géry, 1983
Peixe-cachorro Insectivorous 33.00 859.70
Família ERYTHRINIDAE
Hoplias malabaricus
(Bloch 1794) Traíra Piscivorous X 3.80 10.90 747.70 2915.10
Ordem SILURIFORMES Família CALLICHTHYIDAE
Hoplosternum littorale
(Hancock 1828) Caborja Omnivorous X 0.40 11.50 70.00 955.70
Família LORICARIIDAE
Hypostomus ancistroides
(Ihering 1911) Cascudo Detritivorous X 5.20 9.90 371.10 646.10
Hypostomus margaritifer
(Regan 1908) Cascudo Detritivorous X 0.20 47.00
Família HEPTAPTERIDAE
Rhamdia quelen (Quoy & Gaimard in Freycinet
1824)
Bagre Piscivorous 0.20 2.90 78.70 1046.10
Ordem GYMNOTIFORMES Família GYMNOTIDAE
Gymnotus carapo
Linnaeus, 1758 Tuvira Insectivorous 0.60 0.20 63.20 16.51
Ordem PERCIFORMES Família CICHLIDAE
Geophagus brasiliensis
(Quoy & Gaimard 1824) Cará Omnivorous X 26.60 21.90 1589.10 1539.50
Oreochromis niloticus
(Linnaeus 1758) Tilápia Omnivorous X 0.20 1.20 4.20 97.70
Ordem CYPRINIFORMES Família CYPRINIDAE
Cyprinus carpio
Linnaeus, 1758 Carpa Omnivorous 0.60 240.30
richness (S) and percent of dominance (PDOM) did not pass in the responsiveness test, as they were not correlated with any of these axes. The first RDA axis expressed the gradients of conductivity and turbidity and the presence/absence of riparian vegetation. It was correlated with the percent of larger individuals (L30, r = 0.63, p = 0.004), species with parental care (PC, r = 0.72, p < 0.001), percent of piscivorous (PIS, r = 0.47, p = 0.042), positive values of W statistic (r = 0.76, p < 0.001), and small percent of Characiformes (CHAR, r = –0.61, p = 0.006). The second axis expressed a gradient of depth, being correlated positively with the percent of Cichlidae (CICH, r = 0.65, p = 0.003), number of individuals (N, r = 0.50, p = 0.028) and percent
of omnivorous (OMNI, r = 0.67, p = 0.001), and negatively with the percent of Siluriformes (SIL, r = –0.72, p = < 0.001) and detritivorous species (DET, r = –0.54, p = 0.017). The correlation between CHAR and CICH indicated that these metrics were redundant (r = –0.70). We excluded CHAR because it had the lowest responsiveness, i.e. the weakest correlation with the RDA axes (Figure 2).
3.3. Validation of RFAI
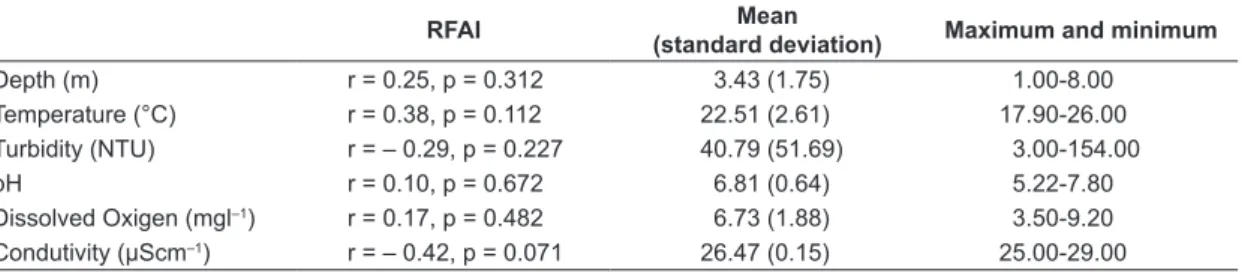
After selecting the metrics, nine composed the final RFAI (Table 3). Two are expected to increase with disturbance and seven to decrease (Table 1). The RFAI varied from 13 to 41, being significantly correlated with W statistic (r = 0.56, p = 0.012), percent of larger individuals (r = 0.71, p = 0.001), piscivorous (r = 0.70, p = 0.001) and detritivorous (r = -0.56, p = 0.012), and marginally correlated with the predominance of individuals with parental care (r = 0.42, p = 0.076) (Table 3). The Jorda Flor reservoir had lower integrity (mean RFAIJorda Flor = 19, mean RFAIBatista = 29.14, F1;15 = 11.12, p = 0.005, Figure 3a), the sampling season did not influence the RFAI (mean RFAIdry = 25.4, mean RFAIwet = 27.4, F1;15 = 1.06, p = 0.320, Figure 3b), and there was no interaction between reservoir and season (F1;15 = 0.72, p = 0.410). Among the limnological variables, only conductivity was marginally correlated with the RFAI (r = –0.42, p = 0.071, Table 4).
Sites without riparian vegetation had on average lower integrity than those with riparian vegetation (mean RFAIno riparian vegetation = 22.3, mean RFAIwith riparian
vegetation = 30.2, t = 2.75, df = 17, p = 0.014), and this pattern did not change if only the Paineiras reservoir is considered (mean RFAIno riparian vegetation = 24.6, mean RFAIwith riparian vegetation = 31.7, t = 2.38, df = 12, p = 0.034) (Figure 3c).
Figure 2. Results of the Redundancy Analysis (RDA) showing the two significant axes (p ≤ 0.05). Black circles: Paineiras reservoir. Open circles: Jorda Flor reservoir. See Table 1 for metrics that correspond to abbreviations.
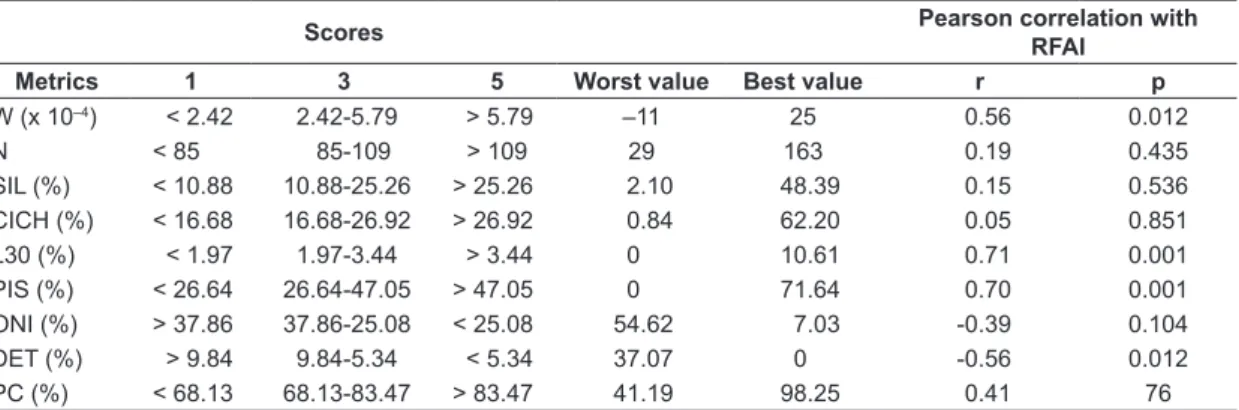
Table 3. Observed intervals and limits used to score the metrics. See Table 1 for metrics that correspond to abbreviations.
Scores Pearson correlation with
RFAI
Metrics 1 3 5 Worst value Best value r p
W (x 10–4) < 2.42 2.42-5.79 > 5.79 –11 25 0.56 0.012
N < 85 85-109 > 109 29 163 0.19 0.435
SIL (%) < 10.88 10.88-25.26 > 25.26 2.10 48.39 0.15 0.536 CICH (%) < 16.68 16.68-26.92 > 26.92 0.84 62.20 0.05 0.851 L30 (%) < 1.97 1.97-3.44 > 3.44 0 10.61 0.71 0.001 PIS (%) < 26.64 26.64-47.05 > 47.05 0 71.64 0.70 0.001
ONI (%) > 37.86 37.86-25.08 < 25.08 54.62 7.03 -0.39 0.104
4. Discussion
Riparian vegetation has several influences on the functioning of lentic ecosystems such as local temperature control, shade, bank stability, providing structures that enhances underwater habitat complexity such as wood debris and trunks (Washington, 2009). These structures are used as spawning, foraging and shelter habitats for fishes (Sass et al., 2006).
Some authors have found that littoral zones with riparian vegetation and the presence of aquatic macrophytes are positively correlated with fish diversity (Amaral & Petrere Junior, 2001; Gomes et al., 2012), and that the presence of submerged trees increases the fish abundances (Gois et al., 2012). Experimental studies also proved that enhancing the underwater habitat complexity by means of artificial reefs or natural CWH structures increases fish diversity, and affects assemblage dynamics and trophic interactions (Freitas &
Petrere Junior, 2001; Ahrenstorff et al., 2009; Santos et al., 2011).
Adaptations of multimetric indexes to Brazilian reservoirs are recent and aimed to detect the influence of river-reservoir gradient in fish community condition (Petesse et al., 2007a; Terra & Araújo, 2010). Our adaptation focusing on evaluate the effects of sections of shoreline with and without riparian vegetation and found that biotic condition of fish assemblages was higher in the first. Biotic condition was not influenced by the limnological variables, depth or season, suggesting that RFAI were more sensitive to the structural shoreline heterogeneity than to the limnological variables. RFAI was also lower in Jorda Flor reservoir, where only one sampling location had riparian vegetation.
Four metrics (W statistic, L30, PIS and DET) were statistical correlated with the final RFAI.
L30 measures directly the percent of larger individuals in the samples, while the W statistic is a measure of relative dominance of biomass over numerical abundance. Local samples were riparian vegetation is absent had a predominance of small individuals that in general are abundant but have lower biomass. W statistic was proposed by Warwick (1986) to indicate locations under pollution stress, where community was composed mainly by small bodied-size organisms within abundant populations.
The other two metrics (PIS and DET) expressed the influence of riparian vegetation on the trophic structure of fish communities. In Paineiras reservoir, piscivorous biomass represented 50.3% of total capture whereas in Jorda Flor only 16.7%. When piscivorous biomass is high, a strong influence of predation on trophic structure is expected (Pelicice et al., 2005). The habitat patches provided by material from riparian vegetation is suggested as the structures that intermediate trophic interactions helping support such high piscivorous biomass. H. malabaricus for example, is an ambusher predator that adopt a sit-and-wait Figure 3. Distribution (median, 25th and 75th
percen-tiles, and extreme values) of the RFAI index comparing the reservoirs (a), seasons (b) and presence of riparian vegetation (c).
Table 4. Relationship among the RFAI and the environmental variables.
RFAI Mean
(standard deviation) Maximum and minimum
Depth (m) r = 0.25, p = 0.312 3.43 (1.75) 1.00-8.00 Temperature (°C) r = 0.38, p = 0.112 22.51 (2.61) 17.90-26.00 Turbidity (NTU) r = – 0.29, p = 0.227 40.79 (51.69) 3.00-154.00 pH r = 0.10, p = 0.672 6.81 (0.64) 5.22-7.80
Dissolved Oxigen (mgl–1) r = 0.17, p = 0.482 6.73 (1.88) 3.50-9.20
strategy to feed (Mazzeo et al., 2010) and submerged trunks and wood debris may provide the necessary foraging habitats. In this case, the removal of riparian vegetation may indirectly reduce predation efficiency and piscivorous abundance by means of reducing the number of submerged CWH structures (Ahrenstorff et al., 2009).
Detritivorous fishes have an specialized diet that in the present study were represented by two loricariids (Hypostomus ancistroides and H. margaritifer). We found no studies relating the influence of riparian vegetation removal and detritivory abundance, but the lack of shore line vegetation may increase the entering of sediments and fine detritus, thus increasing the source of food for these species.
We found no influence of metrics related to total species richness and number of introduced species which is probably attributed to the low number of species in the Paineiras and Jorda Flor reservoirs, a characteristic that are common to other small hydropower plants in headwater areas. In addition, Luiz et al. (2005) verified that the frequency of occurrence of introduced species was lower in the Paranapanema river basin than in other river basins of the state of Paraná.
We provided an evaluation of the influence of riparian vegetation on fish assemblage condition in two small headwater reservoirs and provided a protocol for metric selection and validation based on literature. The method can be extended to other reservoirs of the Paranapanema river basin. With more reservoirs included, the natural variability in age, size, and longitudinal position along the river basin should be taken in account, because these variables influence species richness and assemblage composition (Agostinho et al., 2007; Gerritsen et al., 2003; Luiz et al., 2005). After removing the effects of natural variability, the sampling of different environments within the reservoirs will allow identifying point sources of disturbances that reduce the habitat complexity and consequently the fish integrity.
Acknowledgements
This study was supported by the Fundação de Amparo à Pesquisa do Estado de São Paulo - FAPESP
(Thematic Project: Ecologia de Represas, #2007/50981-7 and the associated scholarships #2007/50982-3 and
#2009/10804-4). Dr. Francisco Langeani helped us with fish identification and IBAMA provided us with the license for fish collection.
References
AGOSTINHO, A.A., GOMES, L.C. and PELICICE, F.M. Ecologia e manejo de recursos pesqueiros em reservatórios do Brasil. Maringá: Eduem, 2007, 501 p.
AHRENSTORFF, T.D., SASS, G.G. and HELMUS, M.R. The influence of littoral zone coarse woody habitat on home range size, spatial distribution, and feeding ecology of largemouth bass (Micropterus salmoides). Hydrobiologia, 2009, 623(1), 223-233. http://dx.doi. org/10.1007/s10750-008-9660-1.
AMARAL, B.D. and PETRERE JUNIOR M. The α and β diversities in the fish assemblages of the Promissão reservoir (SP-Brazil): scales, complexities and ecotone heterogeneity. Ecohydrology & Hydrobiology, 2001, 1(1-2), 185-193.
ANGERMEIER, P.L. and KARR, J.R. Biological integrity versus biological diversity as policy directives. Bioscience, 1994, 44(10), 690-697. http:// dx.doi.org/10.2307/1312512.
ARAÚJO, F.G., FICHBERG, I., PINTO, B.C. and PEIXOTO, M.G. Preliminary index of biotic integrity for monitoring the condition of the Rio Paraiba do Sul, Southeast, Brazil. Environmental Management, 2003, 32(4), 516-526. http://dx.doi. org/10.1007/s00267-003-3003-9. PMid:14986900. BOZZETTI, M. and SCHULZ, U.H. An index of biotic
integrity based on fish assemblages for subtropical streams in southern Brazil. Hydrobiologia, 2004, 529(1-3), 133-144. http://dx.doi.org/10.1007/ s10750-004-5738-6.
CASATTI, L. Alimentação dos peixes em um riacho do Parque Estadual do Morro do Diabo, Bacia do Alto Paraná, sudeste do Brasil. Biota Neotropica, 2002, 2(2), 1-14. http://dx.doi.org/10.1590/S1676-06032002000200012.
CASATTI, L., FERREIRA, C.P. and LANGEANI, F. A fish-based biotic integrity index for assessment of lowland streams in southeastern Brazil. Hydrobiologia, 2009, 623(1), 173-189. http://dx.doi.org/10.1007/ s10750-008-9656-x.
CENTRO DE PESQUISAS METEOROLÓGICAS E CLIMÁTICAS APLICADAS À AGRICULTURA – CEPAGRI [online]. Campinas: CEPAGRI, 2011 [viewed 12 Mar. 2011]. Available from: http://www. cpa.unicamp.br
CLARKE, K.R. Comparison of dominance curves. Journal of Experimental Marine Biolog y and Ecology, 1990, 138(1-2), 143-157. http://dx.doi. org/10.1016/0022-0981(90)90181-B.
COMISSÃO DE SERVIÇOS PÚBLICOS DE ENERGIA DO ESTADO DE SÃO PAULO - CSPE. Pequenas centrais hidrelétricas no Estado de São Paulo. São Paulo: Páginas & Letras, 2004, 337 p.
MAZZONI and P.R. PERES-NETO, eds. Ecologia de peixes de riachos. Rio de Janeiro: PPGE-UFRJ, 1999, pp. 157-182.
FAUSCH, K.D., KARR, J.R. and YANT, P.R. Regional application of an index of biotic integrity based on stream fish communities. Transactions of the American Fisheries Society, 1984, 113(1), 39-55. http://dx.doi. org/10.1577/1548-8659(1984)113<39:RAOAIO >2.0.CO;2.
FERREIRA, T., CAIOLA, N., CASALS, F., OLIVEIRA, J.M. and DE SOSTOA, A. Assessing perturbation of river fish communities in the Iberian Ecoregion. Fisheries Management and Ecology, 2007, 14(6), 519-530. http://dx.doi.org/10.1111/j.1365-2400.2007.00581.x.
FREITAS, C.E. and PETRERE JUNIOR, M. Influence of artificial reefs on fish assemblage of the Barra Bonita Reservoir (São Paulo, Brazil). Lakes and Reservoirs: Research and Management, 2001, 6(4), 273-278. http://dx.doi.org/10.1046/j.1440-1770.2001.00160.x.
GANASAN, V. and HUGHES, R.M. Application of an index of biological integrity (IBI) to fish assemblages of rivers Khan and Kshipra (Madhya Pradesh), India. Freshwater Biology, 1998, 40(2), 367-383. http:// dx.doi.org/10.1046/j.1365-2427.1998.00347.x. GASSNER, H., TISCHLER, G. and WANZENBÖCK, J.
Ecological integrity assessment of lakes using fish communities - suggestions of new metrics developed in two Austrian prealpine lakes. International Review of Hydrobiology, 2003, 88(6), 635-652. http://dx.doi. org/10.1002/iroh.200310629.
GERRITSEN, J., CARLSON, R.E., DYCUS, D.L., FAULKNER, C., GIBSON, G.R., HARCUM, J. and MARKOWITZ, S.A. Lake and reservoir bioassessment and biocriteria: technical guidance document. Washington: US Environmental Protection Agency, 2003, 247 p.
GOIS, K.S., ANTONIO, R.R., GOMES, L.C., PELICICE, F.M. and AGOSTINHO, A.A. The role of submerged trees in structuring fish assemblages in reservoirs: two case studies in South America. Hydrobiologia, 2012, 685(1), 109-119. http://dx.doi. org/10.1007/s10750-011-0843-9. PMid:24683268. GOMES, L.C., BULLA, C.K., AGOSTINHO, A.A.,
VASCONCELOS, L.P. and MIRANDA, L.E. Fish assemblage dynamics in a Neotropical floodplain relative to aquatic macrophytes and the homogenizing effect of a flood pulse. Hydrobiologia, 2012, 685(1), 97-107. http://dx.doi.org/10.1007/s10750-011-0870-6.
GONÇALVES, C.S. and BRAGA, F.M.S. Diversidade e ocorrência de peixes na área de influência da UHE Mogi-Guaçu e lagoas marginais, bacia do alto Rio Paraná, São Paulo, Brasil. Biota Neotropica, 2008, 8(2), 103-114. http://dx.doi.org/10.1590/S1676-06032008000200012.
HELMUS, M.R. and SASS, G.G. The rapid effects of a whole-lake reduction of coarse woody debris on fish and benthic macroinvertebrates. Freshwater Biology, 2008, 53(7), 1423-1433. http://dx.doi. org/10.1111/j.1365-2427.2008.01974.x.
HERMOSO, V., CLAVERO, M., BLANCO -GARRIDO, F. and PRENDA, J. Assessing the ecological status in species-poor systems: A fish-based index for Mediterranean Rivers (Guadiana River, SW Spain). Ecological Indicators, 2010, 10(6), 1152-1161. http://dx.doi.org/10.1016/j.ecolind.2010.03.018. HUGHES, D.L., BROSSETT, M.P., GORE, J.A. and
OLSON, J.R. Rapid bioassessment of stream health. Boca Raton: CRC Press, 2010, 369 p.
HUGUENY, B., CAMARA, S., SAMOURA, B. and MAGASSOUBA, M. Applying an index of biotic integrity based on fish assemblages in a West African river. Hydrobiologia, 1996, 331(1-3), 71-78. http:// dx.doi.org/10.1007/BF00025409.
INSTITUTO BRASILEIRO DE GEOGRAFIA E ESTATÍSTICA – IBGE [online]. Rio de Janeiro: IBGE, 2009 [viewed 25 Oct. 2009]. Available from: http://www.ibge.gov.br
IRZ, P., DE BORTOLI, J., MICHONNEAU, F., WHITTIER, T.R., OBERDORFF, T. and ARGILLIER, C. Controlling for natural variability in assessing the response of fish metrics to anthropogenic pressures for Northeast U.S.A. lakes. Aquatic Conservation Marine and Freshwater Ecosystems, 2008, 18(5), 633-646. http://dx.doi.org/10.1002/aqc.859. JENNINGS, M.J., FORE, L.S. and KARR, J.R.
Biological monitoring of fish assemblages in Tennessee Valley reservoirs. Regulated Rivers: Research and Management, 1995, 11(3-4), 263-274. http:// dx.doi.org/10.1002/rrr.3450110303.
KARR, J.R. Assessment of biotic integrity using fish communities. Fisheries, 1981, 6(6), 21-27. http://dx.doi.org/10.1577/1548-8446(1981)006<0021:AOBIUF>2.0.CO;2. KAUFMANN, P.R., HUGHES, R.M., WHITTIER,
T.R., BRYCE, S.A. and PAULSEN, S.G. Relevance of lake physical habitat indices to fish and riparian birds. Lake and Reservoir Management, 2014, 30(2), 177-191. http://dx.doi.org/10.1080/10402381.20 13.877544.
LEGENDRE, P. and LEGENDRE, L. Numerical ecology. 3th ed. Amsterdam: Elsevier, 2012, 990 p.
PETESSE, M.L., PETRERE JUNIOR, M. and SPIGOLON, R.J. Adaptation of the Reservoir Fish Assemblage Index (RFAI) for assessing the Barra Bonita Reservoir (São Paulo, Brazil). River Research and Applications, 2007a, 23(6), 595-612. http:// dx.doi.org/10.1002/rra.1001.
PETESSE, M.L., PETRERE JUNIOR, M. and SPIGOLON, R.J. The hydraulic management of the Barra Bonita reservoir (SP, Brasil) as a factor influencing the temporal succession of its fish community. Brazilian Journal of Biology = Revista Brasileira de Biologia, 2007b, 67(3), 433-445. http:// dx.doi.org/10.1590/S1519-69842007000300008. PMid:18094826.
PINTO, B.C.T., ARAÚJO, F.G. and HUGHES, R.M. Effects of landscape and riparian condition on a fish index of biotic integrity in a large southeastern Brazil river. Hydrobiologia, 2006, 556(1), 69-83. http:// dx.doi.org/10.1007/s10750-005-9009-y.
REHN, A., ODE, P. and MAY, J. An Index of Biotic Integrity (IBI) for Perennial Streams in California’s Central Valley [online]. California: Surface Water Ambient Monitoring Program, 2008. Technical report [viewed 29 Sept. 2010]. Available from: http:// swrcb2.swrcb.ca.gov
ROTH, B.M., KAPLAN, I.C., SASS, G.G., JOHNSON, P.T., MARBURG, A.E., YANNARELL, A.C., HAVLICEK, T.D., WILLIS, T.V., TURNER, M.G. and CARPENTER, S.R. Linking terrestrial and aquatic ecosystems: the role of woody habitat in lake food webs. Ecological Modelling, 2007, 203(3-4), 439-452. http://dx.doi.org/10.1016/j. ecolmodel.2006.12.005.
SABINO, J. and CASTRO, R.M.C. Alimentação, período de atividade e distribuição espacial dos peixes de um riacho de floresta atlântica (sudeste do Brasil). Brazilian Journal of Biology = Revista Brasileira de Biologia, 1990, 50(1), 23-26.
S A N TO S , L.N., G A RC Í A - B E RT H O U , E., AGOSTINHO, A.A. and LATINI, J.D. Fish colonization of artificial reefs in a large Neotropical reservoir: material type and successional changes. Ecological Applications, 2011, 21(1), 251-262. http:// dx.doi.org/10.1890/09-1283.1. PMid:21516902. SÃO PAULO. Governo do Estado de São Paulo.
Secretaria do Meio Ambiente. Coordenadoria dos Recursos Hídricos. Situação dos recursos hídricos no Estado de São Paulo: ano base 2007. São Paulo, 2009, 146 p.
SASS, G.G., KITCHELL, J.F., CARPENTER, S.R., HRABIK, T.R., MARBURG, A.E. and TURNER, M.G. Fish community and food web responses to a whole-lake removal of coarse woody habitat. Fisheries, 2006, 31(7), 321-330. http://dx.doi. org/10.1577/1548-8446(2006)31[321:FCAFWR ]2.0.CO;2.
LYONS, J., NAVARRO-PÉREZ, S., COCHRAN, P.A., SANTANA, E. and GUZMÁN-ARROYO, M. Index of biotic integrity based on fish assemblages for the conservation of streams and rivers in West-Central Mexico. Conservation Biology, 1995, 9(3), 569-584. http://dx.doi.org/10.1046/j.1523-1739.1995.09030569.x.
M A G A L H Ã E S , M . F. , R A M A L H O , C . E . and COLLARES-PEREIRA, M.J. Assessing biotic integrity in a Mediterranean watershed: development and evaluation of a fish-based index. Fisheries Management and Ecology, 2008, 15(4), 273-289. http://dx.doi.org/10.1111/j.1365-2400.2008.00612.x.
MAGURRAN, A.E. Measuring biological diversity. Oxford: Blackwell Science, 2004, 248 p.
MAZZEO, N., IGLESIAS, C., MELLO, F.T., BORTHAGARAY, A., FOSALBA, C., BALLABIO, R., LARREA, D., VILCHES, J., GARCÍA, S., PACHECO, J.P. and JEPPESEN, E. Trophic cascade effects of Hoplias malabaricus (Characiformes, Erythrinidae) in subtropical lakes food webs: a mesocosm approach. Hydrobiologia, 2010, 644(1), 325-335. http://dx.doi.org/10.1007/s10750-010-0197-8.
MCDONOUGH, T.A. and HICKMAN, G.D. Reservoir Fish Assemblage Index development: a tool for assessing ecological health in Tennessee Valley Authority impoundments. In T.P. SIMON, ed. Assessing the sustainability and Biological Integrity of water resources using fish communities. Boca Raton: CRC Press, 1999, pp. 523-540.
MENEZES, N.A., WEITZMAN, S.H., OYAKAWA, O.T., LIMA, F.C.T., CASTRO, R.M.C. and WEITZMAN, M.J. Peixes de água doce da Mata Atlântica. São Paulo: Museu de Zoologia da USP, 2007, 407 p.
MIRANDA, L.E., SPICKARD, M., DUNN, T., WEBB, K.M., AYCOCK, J.N. and HUNT, K. Fish habitat degradation in U.S. Reservoirs. Fisheries, 2010, 35(4), 175-184. http://dx.doi.org/10.1577/1548-8446-35.4.175.
PELICICE, F.M., ABUJANRA F., FUGI, R., LATINI, J.D., GOMES, L.C. and AGOSTINHO, A.A. A piscivoria controlando a produtividade em reservatórios: explorando o mecanismo topdown. In L. RODRIGUES, S.M. THOMAZ, A.A. AGOSTINHO and L.C. GOMES, eds. Biocenoses em reservatórios: padrões espaciais e temporais. São Carlos: Rima, 2005, pp. 293-302.
Plan (HCP) [online]. Washington, 2009 [viewed 5 July 2015]. Available from: http://wdfw.wa.gov/ publications/00803/.
WHITTIER, T.R., HUGHES, R.M., STODDARD, J.L., LOMNICKY, G.A., PECK, D.V. and HERLIHY, A.T. A structure approach for developing indices of biotic integrity: three examples from streams and rivers in the Western USA. Transactions of the American Society, 2007, 136(3), 718-735. http:// dx.doi.org/10.1577/T06-128.1.
WILSON, M.J., BAYLEY, S.E. and ROONEY, R.C. A plant-based index of biological integrity in permanent marsh wetlands yields consistent scores in dry and wet years. Aquatic Conservation: Marine and Freshwater Ecosystems, 2013, 23, 698-709.
ZHU, D. and CHANG, J. Annual variations of biotic integrity in the upper Yangtze River using an adapted index of biotic integrity (IBI). Ecological Indicators, 2008, 8(5), 564-572. http://dx.doi.org/10.1016/j. ecolind.2007.07.004.
Received: 02 September 2014 Accepted: 28 September 2015 SUZUKI, H.I., BULLA, C.K., AGOSTINHO, A.A. and
GOMES, L.C. Estratégias reprodutivas de assembleias de peixes em reservatórios. In L. RODRIGUES, S.M. THOMAZ, A.A. AGOSTINHO and L.C. GOMES, eds. Biocenoses em reservatórios: padrões espaciais e temporais. São Carlos: Rima, 2005, pp. 223-242. TERRA, B.F. and ARAÚJO, F.G. A preliminary fish
assemblage index for a transitional river-reservoir system in southeastern Brazil. Ecological Indicators, 2010, 11(3), 874-881. http://dx.doi.org/10.1016/j. ecolind.2010.11.006.
TEWS, J., BROSE, U., GRIMM, V., TIELBÖRGER, K., WICHMANN, M.C., SCHWAGER, M. and JELTSCH, F. Animal species diversity driven by habitat heterogeneity/diversity: The importance of keystone structures. Journal of Biogeography, 2004, 31(1), 79-92. http://dx.doi.org/10.1046/j.0305-0270.2003.00994.x.
WARWICK, R.M. A new method for detecting pollution effects on marine macrobenthic communities. Marine Biology, 1986, 92(4), 557-562. http://dx.doi. org/10.1007/BF00392515.