BIOMEDICAL SCIENCES
AND
CLINICAL INVESTIGATION
www.bjournal.com.br
www.bjournal.com.br
Braz J Med Biol Res, March 2012, Volume 45(3) 273-283
doi: 10.1590/S0100-879X2012007500026
Comparative proteomics analysis of chronic atrophic gastritis:
changes of protein expression in chronic atrophic gastritis without
Helicobacter pylori infection
Lin Zhang, Yanhong Hou, Kai Wu and Dan Li
Institutional Sponsors
The Brazilian Journal of Medical and Biological Research is partially financed by
Faculdade de Medicina de Ribeirão Preto Campus
Ribeirão Preto
Explore High - Performance MS Orbitrap Technology In Proteomics & Metabolomics
Comparative proteomics analysis of chronic
atrophic gastritis: changes of protein
expression in chronic atrophic gastritis
without
Helicobacter pylori
infection
Lin Zhang, Yanhong Hou, Kai Wu and Dan Li
Department of Gastroenterology and Hepatology, The 309 Hospital of People’s Liberation Army, Beijing, China
Abstract
Chronic atrophic gastritis (CAG) is a very common gastritis and one of the major precursor lesions of gastric cancer, one of the most common cancers worldwide. The molecular mechanism underlying CAG is unclear, but its elucidation is essential for the prevention and early detection of gastric cancer and appropriate intervention. A combination of two-dimensional gel electrophoresis and mass spectrometry was used in the present study to analyze the differentially expressed proteins. Samples from 21 patients (9 females and
12 males; mean age: 61.8 years) were used. We identified 18 differentially expressed proteins in CAG compared with matched normal
mucosa. Eight proteins were up-regulated and 10 down-regulated in CAG when compared with the same amounts of proteins in indi-vidually matched normal gastric mucosa. Two novel proteins, proteasome activator subunit 1(PSME1), which was down-regulated in CAG, and ribosomal protein S12 (RPS12), which was up-regulated in CAG, were further investigated. Their expression was validated
by Western blot and RT-PCR in 15 CAG samples matched with normal mucosa. The expression level of RPS12 was significantly higher in CAG than in matched normal gastric mucosa (P < 0.05). In contrast, the expression level of PSME1 in CAG was significantly lower
than in matched normal gastric mucosa (P < 0.05). This study clearly demonstrated that there are some changes in protein expression between CAG and normal mucosa. In these changes, down-regulation of PSME1 and up-regulation of RPS12 could be involved in the development of CAG. Thus, the differentially expressed proteins might play important roles in CAG as functional molecules.
Key words: Differentially expressed proteins; Chronic atrophic gastritis; Proteomic study; Ribosomal protein S12 (RPS12); Proteasome activator subunit 1 (PSME1)
Introduction
Correspondence: Lin Zhang, Department of Gastroenterology and Hepatology, The 309 Hospital of PLA, Beijing 100091, China. E-mail: [email protected]
Received July 4, 2011. Accepted February 1, 2012. Available online March 2, 2012. Published March 19, 2012. Chronic atrophic gastritis (CAG) is currently recognized
as a special form of chronic gastritis characterized by mucosa atrophy, exposed vessels and mucosal nodules. These features appear to be unusual and different from those seen in other types of chronic gastritis. The diagnosis can be easily made by endoscopic examination and histopathologic evaluation. A number of studies have been conducted to determine the prevalence of CAG in countries having high mortality from gastric cancer, especially in Eastern Asia (1,2). However, recently, the morbidity of CAG has been rapidly increasing in China. The Helicobacter pylori bacterium colonizes the stomach
mucosa and triggers a series of inflammatory reactions. It is
considered to be an important cause of CAG (3,4), as shown in rodent models (5-7). Although a close relationship between this type of gastritis and H. pylori has been suggested to
ex-ist during the last few years, the role of H. pylori still remains unknown. Why are there many CAG patients without H. pylori infection? Globally, gastric cancer is the second most common malignancy. Each year, roughly 798,000 people are diagnosed with gastric cancer worldwide (9.9% of total cancer cases) and 628,000 people die from the disease (8). CAG plays a crucial role in the development of the intestinal type gastric cancer
and has been considered to be the first step in a sequence
of mucosal changes in the stomach leading to cancer. It is widely accepted that gastric carcinogenesis is a continuous process leading from non-atrophic gastritis to CAG (loss of
specialized glands), to metaplasia and dysplasia, and finally
underlying this first step leading to gastric cancer is still
unknown because molecular biology investigations of CAG are very scarce. Therefore, it is crucial to elucidate the molecular mechanism underlying CAG.
Because the pattern of expressed proteins represents a “library” of information about the functional status and health of the tissue, in recent years, protein extraction, display, and analysis have been developed as new
meth-ods representing a new field of clinical proteomics. In this field, the above-mentioned techniques are used to identify
functional molecular markers or biomarkers of cancer and other diseases (14), but there are hardly any studies on the differential expression of proteins between CAG and normal-appearing mucosa.
Most current researches focus mainly on the clinical characteristics of this disease, with much less attention paid
to molecular changes occurring in the normal-appearing mucosa from which such lesions emerge. In the present
study, we used proteomic techniques to test the hypothesis
that normal gastric mucosa from a patient with CAG would exhibit patterns of protein expression distinct from the af-fected mucosa from the same patient. This approach pro-vides a comparison of anatomically normal and disordered tissues against the same genetic background to analyze the molecular mechanism underlying CAG.
Material and Methods
Sample collection
Samples were taken from 21 patients with CAG from the 309 Hospital of the General Hospital of the People’s Liberation Army (PLA) (Table 1). Normal gastric mucosa was
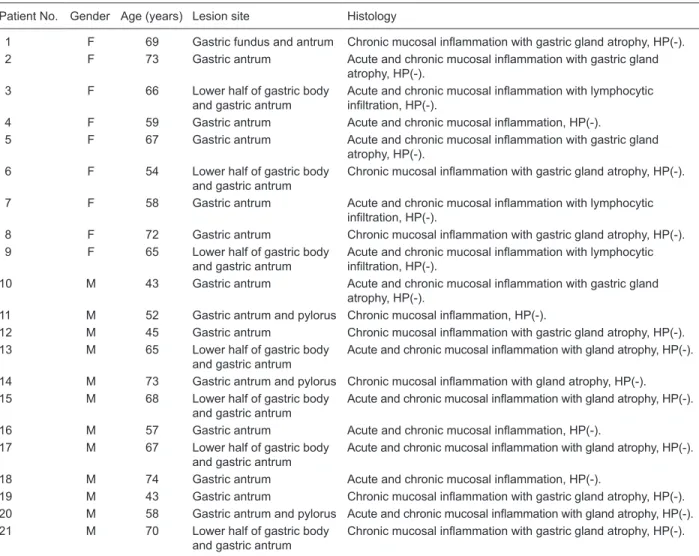
Table 1. Characteristics of chronic atrophic gastritis (CAG) patients from whom normal mucosal and CAG lesion biopsies were
ob-tained in the present study.
Patient No. Gender Age (years) Lesion site Histology
1 F 69 Gastric fundus and antrum Chronic mucosal inflammation with gastric gland atrophy, HP(-).
2 F 73 Gastric antrum Acute and chronic mucosal inflammation with gastric gland
atrophy, HP(-).
3 F 66 Lower half of gastric body
and gastric antrum
Acute and chronic mucosal inflammation with lymphocytic infiltration, HP(-).
4 F 59 Gastric antrum Acute and chronic mucosal inflammation, HP(-).
5 F 67 Gastric antrum Acute and chronic mucosal inflammation with gastric gland
atrophy, HP(-).
6 F 54 Lower half of gastric body
and gastric antrum
Chronic mucosal inflammation with gastric gland atrophy, HP(-).
7 F 58 Gastric antrum Acute and chronic mucosal inflammation with lymphocytic
infiltration, HP(-).
8 F 72 Gastric antrum Chronic mucosal inflammation with gastric gland atrophy, HP(-).
9 F 65 Lower half of gastric body
and gastric antrum
Acute and chronic mucosal inflammation with lymphocytic infiltration, HP(-).
10 M 43 Gastric antrum Acute and chronic mucosal inflammation with gastric gland
atrophy, HP(-).
11 M 52 Gastric antrum and pylorus Chronic mucosal inflammation, HP(-).
12 M 45 Gastric antrum Chronic mucosal inflammation with gastric gland atrophy, HP(-).
13 M 65 Lower half of gastric body
and gastric antrum
Acute and chronic mucosal inflammation with gland atrophy, HP(-).
14 M 73 Gastric antrum and pylorus Chronic mucosal inflammation with gland atrophy, HP(-).
15 M 68 Lower half of gastric body
and gastric antrum
Acute and chronic mucosal inflammation with gland atrophy, HP(-).
16 M 57 Gastric antrum Acute and chronic mucosal inflammation, HP(-).
17 M 67 Lower half of gastric body
and gastric antrum
Acute and chronic mucosal inflammation with gland atrophy, HP(-).
18 M 74 Gastric antrum Acute and chronic mucosal inflammation, HP(-).
19 M 43 Gastric antrum Chronic mucosal inflammation with gastric gland atrophy, HP(-).
20 M 58 Gastric antrum and pylorus Acute and chronic mucosal inflammation with gland atrophy, HP(-).
21 M 70 Lower half of gastric body
and gastric antrum
Chronic mucosal inflammation with gastric gland atrophy, HP(-).
defined as that 5 cm adjacent to the affected mucosa and
with no expression of CAG under endoscopy. All samples were obtained by biopsy in endoscopy examinations of these patients. Four tissue fragments of the CAG focus and of normal mucosa were obtained from each patient. One tissue fragment was used for pathological diagnosis, and the other was saved for future study. The 13C urea breath test was applied to the patients to detect H. pylori infection and the results were negative. The results of autoantibody detection were also negative. H. pylori infection and auto-immune disease were excluded. The Ethics Committee of Biomedicine of the 309 Hospital of the PLA, China, approved the study and all patients gave written informed consent to participate.
All samples were snap-frozen in liquid nitrogen and
stored in a deep freezer (-80°C) until use. Tissues
(70-140 mg) were then crushed in liquid nitrogen and lysed in
1 mL 7 M urea, 2 M thiourea, 4% 3-[(3-cholamidopropyl) dimethylammonio] propanesulfonate (CHAPS), 65 mM dithiothreitol (DTT), and 0.2% Bio-Lyte (pH 5-8; Bio-Rad, USA) with sonication on ice. The lysates were centrifuged at 20,000 g for 1 h at 4°C, the supernatants were removed and protein concentration was determined with the Bio-Rad AC DC protein assay kit (Bio-Rad). Protein samples were stored at -80°C. Before 2-dimensional electrophoresis
(2-DE) was performed, the protein samples were purified
using the Readyprep 2-D cleanup kit (Bio-Rad) according to manufacturer instructions.
Clinical data of the samples
Detailed clinical and pathological data from the health care information center were reviewed. None of the patients had received treatment prior to endoscopy examination. Of the 21 patients, 12 were men and 9 were women; the mean age at the time of the operations was 60.9 years (range: 43-74 years; Table 1). No patient suffered CAG with other concurrent gastric diseases. All CAG tissue samples had
definite histological diagnoses: acute and chronic mucosal inflammation (N = 3), acute and chronic mucosal inflamma -tion with mucosa or gland atrophy (N = 7), chronic mucosal
inflammation with gastric gland atrophy (N = 7), acute and chronic mucosal inflammation with lymphocytic infiltration (N = 3), and chronic mucosal inflammation. No sample showed
low-to-moderate dysplasia or intestinal metaplasia.
Two-dimensional gel electrophoresis
Individual paired samples of normal gastric mucosa and CAG were analyzed by 2-DE as described by Xing et
al. (15). Briefly, a 24-cm linear gradient, pH 5-8, ready strip
(Bio-Rad) was rehydrated overnight at 16°C with 200 µg protein in 500 µL rehydration buffer (7 M urea, 2 M thiourea, 4% CHAPS, 65 mM DTT, and 0.2% Bio-Lyte). Isoelectric focusing (IEF) was performed using the PROTEAN IEF Cell system (Bio-Rad). After IEF, the immobilized pH gradient
strip was immediately equilibrated for 15 min in equilibra
-tion buffer I (6 M urea, 2% sodium dodecyl sulfate (SDS), 0.375 M Tris-HCl, pH 8.8, 20% glycerol, and 2% DTT)
and then for 15 min in equilibration buffer II (6 M urea, 2%
SDS, 0.375 M Tris-HCl, pH 8.8, 20% glycerol, and 2.5% iodoacetamide). SDS-polyacrylamide gel electrophoresis was carried out on 12% SDS-polyacrylamide gels (25 cm x 20.5 cm x 1.0 mm) using the PROTEAN Plus Dodeca Cell system (Bio-Rad) at a constant voltage of 200 V, at 20°C. After electrophoresis, the gels were stained with the Silver Stain Plus Kit (Bio-Rad). The above processes were performed in triplicate for each sample.
Gel imaging and analysis
The silver-stained 2-DE gels were scanned on a GS-800 Calibrated Imaging Densitometer (Bio-Rad) at a resolution of 300 dots per inch. The intensities of protein spots were analyzed with the Amersham Biosciences Imagemaster v 5.0 (USA). The differential protein spots that showed more than 5-fold staining intensity and had the same directional change in at least 9 cases were taken as differentially expressed candidates. The gray values of the protein can-didates were analyzed statistically by the nonparametric Wilcoxon test.
Spot cutting and in-gel digestion
To obtain sufficient protein for mass spectrometry, 2-D gels from 21 samples were used for spot cutting. Equal
protein masses of each of the 21 samples (normal gastric mucosa and CAG tissue) were pooled, and 300 µg of the mixture was loaded for 2-DE. The differentially expressed
protein spots were identified as described in the preceding
text. These spots were excised from the gels with the Pro-teome Works Spot Cutter (Bio-Rad), destained for 20 min in 30 mM potassium ferricyanide/100 mM sodium thiosulfate (1:1, v/v), and washed in Milli-Q water until the gels shrank and were bleached. The pieces of gel were incubated in 0.2 M NH4HCO3 for 20 min and dried by lyophilization. Twenty microliters of 20 µg/mL trypsin (Sigma, USA) was added to each gel fragment and the pieces were then incubated at 37°C overnight. The peptides were extracted three times
with 50% acetonitrile (ACN) and 0.1% trifluoroacetic acid
and dried in a vacuum centrifuge.
Mass spectrometry (MS)
The digests were analyzed using a Bruker Autoflex II
TOF/TOF mass spectrometer (Bruker Daltonics Inc., USA)
with delayed extraction in which α-cyano-4-hydroxycinnamic
acid was exploited as the matrix (in 50% ACN and 0.05% MS). The total 2-µL solution was applied to a target disk and allowed to air dry. Mass-to-charge ratios were measured
in a reflector/delayed extraction mode with an accelerating
voltage of 20 kV, a grid voltage of 63-65%, positive polar-ity, and a delay time of 200 nanoseconds. Laser shots at
300 per spectrum were used to acquire the spectra with a
were used for internal mass calibration. Database search-ing was performed ussearch-ing the Mascot software (http://www. matrixcience.com). The search parameters were the nrNCBI database, human, 10-150 kDa, trypsin (1 missed enzymatic cleavage), and 100-ppm mass tolerance. The best match
was the one with the highest score, and a significant match
was typically a score of the order of 70 (P < 0.05).
Western blot analysis of proteasome activator subunit 1 (PSME1) and ribosomal protein S12 (RPS12)
After the analysis of selected proteins, two differential
proteins were confirmed by Western blot analysis in ad -ditional samples to validate the 2-DE spot protein content results. Fifteen CAG with individually matched normal mu-cosa were used for Western blot analysis. Tissue samples were lysed as described above and protein extracts (50 µg) were separated on a 12% SDS-polyacrylamide gel.
Proteins were then transferred to a poly-vinylidene difluoride
membrane (Bio-Rad). After blocking, the membranes were incubated with a PSME1 goat polyclonal antibody (1:1000 dilution; GenWay Biotech, Inc., USA) and a polyclonal rab-bit anti-RPS12 antibody (1:1000 dilution; Sigma-Aldrich,
USA). Subsequently the membranes were incubated
with anti-goathorseradish peroxidase and anti-rabbit IgG horseradish peroxidase (Abcam, UK), respectively. The
specific proteins were visualized with a chemiluminescent reagent (Pierce Biotechnology, USA). As a control for equal
protein loading, blots were restained using antiactin antibody (1:4000 dilution; Santa Cruz Biotechnology, USA). The band intensity was analyzed with the PDQuest software ver7.1. The amount of relative expression was calculated as the intensity ratio of RPS12orPSME1 to that of actin. The association between categorical data was analyzed by the nonparametric Wilcoxon test or the Friedman test, when appropriate, using the SPSS11.0 software package. The
level of significance was established at 0.05 (two-tailed).
RT-PCR of PSME1 and RPS12
The total RNAs of additional tissue samples were extracted by homogenization in Trizol (Invitrogen, USA) to validate the 2-DE results and cDNA synthesis was performed in a 20-µL reverse transcription reaction mixture including
5 µg RNA. Amplification of PSME1, RPS12 and β2-MG
acting as internal control was then carried out in a DNA thermal cycler(Perkin Elmer, USA)using equal cDNA as template. PCR products were separated by 1.5% agarose gel electrophoresis, scanned and analyzed with the image master VDS system(Pharmacia, USA).
Preliminary functional analysis of PSME1 and RPS12
To understand the roles of PSME1 and RPS12 in CAG, they were imported into Pathway Studio (USA), and an interaction map was generated and visualized with informa-tion from the Ensembl database, the Pfam protein families database, Prosite database, GNF GeneAtlas database, and
PDB database. Each node represents either a protein entity or a control mechanism of the interaction.
According to the visualized interaction map established by the Pathway Studio, the key pathways including PSME1, RPS12 and other proteins were shown. Furthermore, some preliminary molecular mechanisms underlying CAG were analyzed based on these key pathways.
Results
Differential protein expression of CAG
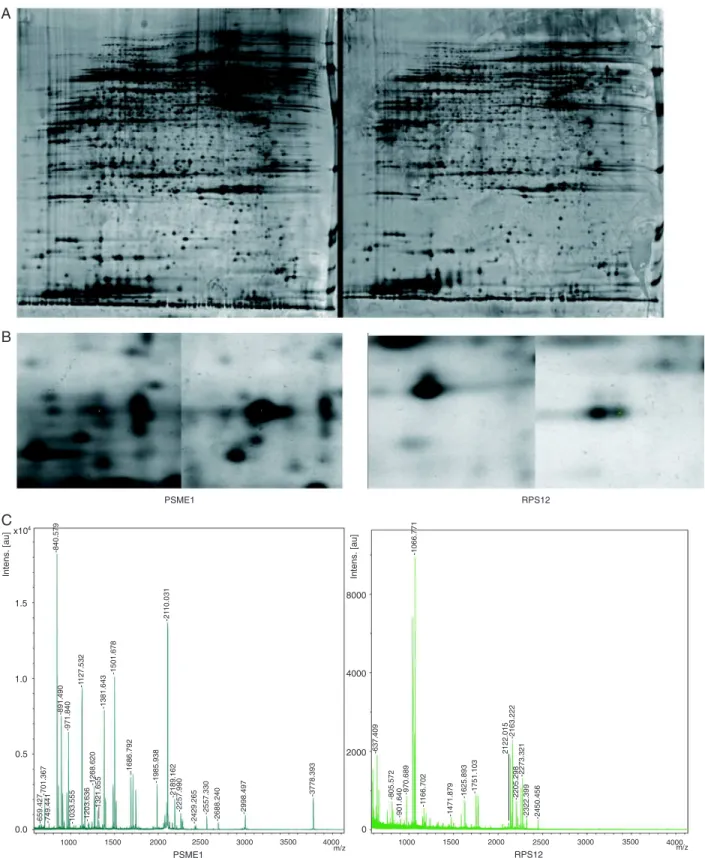
The 2-DE protein patterns were studied in 21 patients with CAG and individually matched normal mucosa tis-sue. About 2100 proteins were detected on each gel. The proteins expressed in CAG tissue were compared to those in matched normal tissue. The protein spots that showed 5-fold greater differential expression in at least 9 cases were considered to be differentially expressed candidates
(Figure 1A and B). In this study, 18 significantly different
candidate protein spots were found. Eight proteins were up-regulated and 10 down-regulated in CAG compared to the same proteins in individually matched normal gastric
mucosa. The quantities of all detected spots were analyzed
statistically by the nonparametric Wilcoxon test. We then
analyzed these candidate spots by MS and identified a
total of 15 proteins (Figure 1C and Table 2). The Mascot
scores for the protein identified by Bruker Autoflex II TOF/
TOF, and other parameters are given in Table 2. We failed to detect 3 protein spots. There might be several reasons for this result, such as lower abundance, some errors in the operation, lower reliability of the MS results, and some characteristics of these proteins. More work will be done on the 3 protein spots in a further study.
Validation of PSME1 and RPS12 by RT-PCR
Using semiquantitative RT-PCR, a 432-bp fragment
of PSME1, a 387-bp fragment of RPS12 and an 876-bp
control fragment of β2-MG were amplified (Figure 2). The
mean ratios of the intensity of the PSME1 band normalized to the control band were 0.23 ± 0.06 and 1.34 ± 0.31 in 15 CAG and normal mucosa tissues, respectively. The P value was lower than 0.05 when the ratios of the two groups were analyzed by the Student t-test (Figure 2A). The results of RPS12 were 1.28 ± 0.15 and 0.36 ± 0.09 in 15 CAG and normal mucosa tissues, respectively (P < 0.05; Figure 2B). These results suggest that the difference ofPSME1and RPS12 in CAG and normal mucosa tissues can be obvious at the mRNA level.
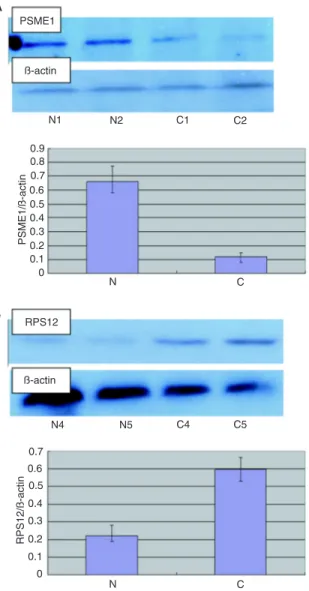
Validation of PSME1 and RPS12 by Western blot
The two novel candidate proteins, PSME1 and RPS12, were studied further among the differentially expressed
proteins. Their expression profiles in CAG have not been
reported previously. Western blot analysis showed that
Figure 1. Detection and analysis of differentially expressed proteins in chronic atrophic gastritis (CAG). A, Representative 2-DE im-ages of matched CAG and normal gastric mucosa tissue. The proteins expressed in CAG tissue were compared with those expressed
in matched normal tissue. Fifteen spots were identified by mass spectrometry in 18 differentially expressed protein spots (Table 2). B,
Magnified regions of the 2-DE gel of down-regulated PSME1 (left) and up-regulated RPS12 (right) in CAG tissue when compared with
± SD: 0.59 ± 0.08) but not in normal gastric mucosa tissue (mean ± SD: 0.22 ± 0.06; Figure 3B). Compared to normal mucosa (mean ± SD: 0.66 ± 0.10),PSME1 was significantly down-regulated in CAG tissue (mean ± SD: 0.12 ± 0.03) (P < 0.05, Student t-test or Friedman test) (Figure 3A).
Preliminary functional analysis
PSME1 and RPS12 were imported into Pathway Studio to build an interaction network. The connectivity of PSME1 andRPS12 was 64 and 38, respectively. The average
con-nectivity of the proteins identified was about 43. Our results
showed that PBP, RAF1, Braf, MAPK1, and MAP2K1 were hot points with more connectivity. Based on the molecular
network, we concluded that the PBP-RAF/MAPK pathway
and NF-kappaB (NF-κB) signaling pathway could be the
cores of the whole network. Cancer and other phenotypes
interested in downstream such as inflammation, necrosis and
hyperplasia were linked to the two pathways (Figure 4).
Discussion
It is well known that chronic CAG plays a crucial role in the development of gastric cancer, which is one of the most common causes of cancer deaths globally. H. pylori has been thought to be the major trigger of CAG (16). But there are still many CAG patients without H. pylori infection and
Table 2. Differentially expressed proteins in chronic atrophic gastritis (CAG).
ID No. Protein identified Gene
identified Accession No. Mass (Da)/pI Cover rate (%) Mascot scores Relative intensity (mean ± SD)
General function/comments
Up-regulated proteins 1 C-C chemokine receptor
type 10
CCR10 P46092 38416.4/5.6 42 158 42.8 ± 6.6
5.5 ± 0.6
Receptor for chemokines SCYA27 and
SCYA28. Subsequently transduces a signal
by increasing the intracellular calcium ion level and stimulates chemotaxis in a pre-B cell line. 2 DNA repair protein RAD51
homolog 2
RAD51L1 O15315 42196.6/6.2 39 201 25.6 ± 3.1
4.2 ± 0.6
Involved in the homologous recombination repair (HRR) pathway of double-stranded DNA breaks arising during DNA replication or induced by DNA-damaging agents. 3 Serine/threonine-protein
kinase 19
STK19 P49842 40916.1/4.67 56 106 72.0 ± 12.5
14.3 ± 3.3
Seems to be a protein kinase. In vitro it can phosphorylate casein-alpha on serine and threonine residues and histones on serine residues.
4 Hsp90 co-chaperone Cdc37 CDC37 Q16543 44468.4/7.2 47 139 54.3 ± 6.5
8.7 ± 1.4
Co-chaperone that binds to numerous kinases and promotes their interaction with the Hsp90 complex.
5 40S ribosomal protein S12 RPS12 P25398 14515/5.9 64 234 33.7 ± 5.7
6.1 ± 1.4
Belongs to the ribosomal protein S12e family.
6 Protein FAM3C FAM3C Q92520 24680.2/6.5 73 231 52.7 ± 4.6
3.8 ± 0.8
Belongs to the FAM3 family.
Down-regulated proteins
7 Proteasome activator complex subunit 1
PSME1 Q06323 38966.2/7.6 67 173 14.9 ± 5.3
74.2 ± 11.6
Implicated in immuno-proteasome assembly
and required for efficient antigen processing.
8 BRCA2 and CDKN1A interacting protein
BCCIP Q9P287 35979.6/5.8 42 149 5.5 ± 0.8
33.7 ± 8.4
May promote cell cycle arrest by enhancing the inhibition of CDK2 activity by CDKN1A.
9 BTG1 protein BTG1 P62324 19209.7/6.6 49 204 11.8 ± 1.9
57.2 ± 4.2
Anti-proliferative protein. Its expression is associated with the early G1 phase of the cell cycle.
10 Ubiquitin carboxyl terminal hydrolase isozyme L5
UCHL5 Q9Y5K5 37607.4/8.1 63 224 6.1 ± 1.3
52.8 ± 13.2
Deubiquitinating enzyme associated with the
proteasome.
11 Succinate dehydrogenase
[ubiquinone] iron-sulfur
subunit, mitochondrial
SDHB P21912 31636/6.2 50 161 13.9 ± 3.1
75.3 ± 12.8
Involved in complex II of the mitochondrial electron transport chain.
12 Caspase-7 CASP7 P55210 34277.1 /8.2 39 211 4.9 ± 1.3
39.2 ± 5.4
Involved in the activation cascade of caspases responsible for apoptosis execution.
13 Apoptosis-associated speck-like protein containing a CARD
PYCARD Q9ULZ3 21627.7 /4.6 61 147 2.3 ± 0.3
14.8 ± 2.9
Promotes caspase-mediated apoptosis.
14 Histone deacetylase 3 HDAC3 O15379 48848.4 /5.6 68 230 12.4 ± 3.4
74.3 ± 13.1
Responsible for the deacetylation of lysine residues on the N-terminal part of the core histones.
15 Protein fem-1 homolog B FEM1B Q9UK73 70264.2/8.3 54 163 4.6 ± 1.1
34.4 ± 7.5
Component of an E3 ubiquitin-protein ligase
complex, in which it may act as a substrate recognition subunit.
most of the previous studies were clinical investigations in which very few genes and proteins were connected with the disease. Thus, we still do not clearly know what occurs in the change from morphologically normal mucosa to CAG. Meanwhile, the patients could face a higher risk of gastric cancer. Thus, it is important to investigate the molecular mechanism underlying CAG. Proteomic methods will help
us to understand the early stages in the progress of CAG for the prevention and treatment of gastric cancer. In this study, we used the common 2-DE approach coupled with MS to study the differentially expressed proteins in individu-ally matched cases of normal mucosa and CAG lesion and
Figure 3. Western blot analysis of PSME1andRPS12. A,
Down-regulation of PSME1 in chronic atrophic gastritis (CAG) (C) tissue. Western blot assays were performed to demonstrate the differen-tial expression of the PSME1 protein between CAG and normal
(N) gastric mucosa. The specific proteins were visualized with a chemiluminescent reagent. As a control for equal protein loading,
blots were restained with antiactin antibody. Immunosignals were
quantified by densitometry scanning. The relative quantification
was calculated as the ratio of PSME1 to actin as shown in the bar graph. B, Up-regulation of RPS12 in CAG (C) tissue compared to normal (N) mucosa. The same experimental process was
per-formed. The relative quantification was calculated as the ratio of
RPS12 to actin as also shown in the bar graph.
Figure 2. RT-PCR analysis of PSME1 and RPS12. A,
Down-regulation of PSME1 in chronic atrophic gastritis (CAG) (C)
tis-sue. RT-PCR assays were performed to confirm the differential
expression of the PSME1 protein between CAG and normal (N)
gastric mucosa. Amplification of PSME1 and of β2-MG acting as
internal control was then carried out in a DNA thermal cycler. The
bands were quantified by densitometry scanning. The relative quantification was calculated as the ratio of PSME1 expression to β2-MG expression as shown in the bar graph. B, Up-regulation of RPS12 in CAG (C) tissue compared to normal (N) mucosa. The
same experimental process was performed. The relative quantifi
-cation was calculated as the ratio of RPS12 expression to β2-MG
confirmed the differential expression of PSME1 and RPS12
by Western blot and RT-PCR analysis.
Eighteen differentially expressed proteins were identified
in CAG in the study, and none of them (Table 2) had been reported in previous studies on this disease. We used a cut-off of 5-fold in the research. This high cut-off may have
Figure 4. Biological interaction networking of PSME1 and RPS12 in chronic atrophic gastritis (CAG). PSME1 and RPS12
were imported into Pathway Studio (USA) and an interaction map was generated with information from the Ensembl da-tabase, the Pfam protein families dada-tabase, Prosite dada-tabase, GNF GeneAtlas dada-tabase, and PDB database. Each node
represents either a protein or a control mechanism of the interaction. The NF-κB and PBP-RAF/MAPK signaling pathways
missed some potentially important changes, although it could minimize the possibility of individual difference and
ensure the fidelity of the change. In the current study, we
only found 18 differentially expressed proteins between
CAG and normal mucosa in the fluorescence difference
gel electrophoresis study. But we believe that some major molecular mechanisms underlying the disease should be implicated. A concept of cancer biology is that tumors arise and grow from some precancerous lesionas a result of the multiple changes of some genes or proteins, which
could influence some cell functions via different molecular
biological pathways. Thus, it would be very important to determine these molecular changes and their functional pathways. There may be not too many changes in the expressions of proteins in the original step towards gastric cancer, namely CAG, and therefore only 18 differentially expressed proteins were found. There were also some methodological discrepancies in the processes of our pro-teomic study, including sample collection, the separation
and identification of proteins and analysis of the results.
Some low-abundance protein spots could not be displayed clearly and these proteins should be further analyzed by a more advanced method.
In the present study, we confirmed that PSME1 ex
-pression was significantly down-regulated in CAG tissue compared to normal mucosa. The same finding about this
protein has been reported in previous studies (17-20). An alternative name of PSME1 is PA28 alpha that encodes the alpha subunit of the 11S regulator.This 11S regulator is an important componentofthe 26S proteasome, which is composed of 2 complexes, a 20S core, and a 19S or 11S regulator. The proteasomeis expressed throughout
eukaryotic cells and disintegrates proteins in a
ubiquitin-dependent pathway in which many products of oncogenes and anti-oncogenes are decomposed.The other essential function of the proteasome is the processing of class I major histocompatibility complex peptides, namely immunoprotea-some. The results of previous studies (17-20) have revealed that the noticeable function of PSME1 was immunoregu-lation, which, to some extent, could enhance anticancer immunological reaction. The relationship between PSME1 and some cancers has been reported recently. Zhang et al. (21) found that PSME1 was down-regulated in HBV-infected hepatocellular carcinoma in a comparative proteomics research to analyze the differential proteome of tumor and adjacent non-tumor tissues, and thought that PSME1 could play an important role in the onset of hepatocarcinogenesis.
Miyagi et al. (22) confirmed that the expression of PSME1
was impaired in some human colon cancer cell lines, and they thought that this change could be involved in the loss of HLA class I expression in human colon cancer cells. Lemaire et al. (23) reported that PSME1 could be regarded as a potential biomarker of ovary cancer because of its outstanding differential expression between ovary cancer and normal tissue. Collectively, these studies suggest that
the PSME1 gene could be involved in cancer initiation and progression because of impaired immunoprotection.Our
results confirmed that PSME1 expression is down-regulated
in CAG compared to normal mucosa. We postulated that this down-regulation of PSME1 might denote a step of the potential cancerous transformation of the gastric mucosa due to weakened immunological function.
RPS12 was significantly up-regulated in CAG tissue
although its expression remained unchanged in normal mucosa. The RPS12 gene encodes a ribosomal protein, which is an important component of the 40S subunit of ribosomes. Ribosomes are highly conserved large ribo-nucleoprotein particles consisting of a large 60S subunit and a small 40S subunit that perform protein synthesis. There are many different ribosomal proteins (r-proteins), which are encoded by different genes scattered about the genome. The function of ribosomes is very complex, with different steps occurring in different parts of the cell. Separate ribosomal subunits are then transported from the nucleolus to the cytoplasm where they assemble into mature ribosomes before functioning in translation. In this process, r-proteins such as the protein product of RPS12 form the ribosomal subunits and perform the functional
roles of identification, integration, and transport. Thus, the
change in the expression of an r-protein could result in up-regulation or down-up-regulation of newly synthesized proteins.
The change in the expression of RPS12 could influence the
expression of some proteins. On the other hand, because there are many r-proteins and their roles may overlap, the changes in expression of a single ribosomal protein could have a very limited impact on global gene expression. Thus, the up-regulation of RPS12 could result in the changes in the expression of some proteins but the number of these changed proteins could be limited. The results of some previous investigations have revealed that this gene could be related to some human cancer. Cheng et al. (24), using RT-PCR differential display and cDNA microarray methods, found that the expression of RPS12 may be up-regulated in
the adjacent histopathologically “normal” cervical squamous
initiation of cancerization.
Our bioinformatics results suggested that the PBP-RAF/
MAPK and NF-κB pathways could be the crucial signal
transduction pathways of the molecular change in CAG. The
NF-κB and PBP-RAF/MAPK signaling pathways regulate the growth of many tumors or inflammation, suggesting co -operation between these two pathways in the regulation of cell proliferation and apoptosis in CAG. It is well known that H. pylori is the cause of many gastric diseases, including CAG. The results of some investigations on H. pylori have
revealed that the PBP-RAF/MAPK and NF-κB pathways
could be the crucial mechanism of the pathopoiesis of H. pylori. Fox and Wang (27), Shibata et al. (28), and Lee et
al. (29) have confirmed that the induction of cytokines and
chemokines and growth-related genes by H. pylori is
medi-ated by the PBP-RAF/MAPK and NF-κB signaling pathways.
In our molecular interaction network of CAG, the changes
of PSME1 or RPS12 and the impact on the NF-κB and
PBP-RAF/MAPK signaling pathways could be analogous to the reaction to H. pylori infection. But the patients in our study were not infected with H. pylori, and therefore, ac-cording to previous reports, we supposed that CAG without H. pylori infection could involve a pathogenesis similar to that of CAG with H. pylori infection, in which a series of molecular interactions were induced by an immunological reaction against H. pylori infection. But in CAG without H. pylori infection, the initiating agent could not be H. pylori but other infectious agents or molecules.
Of 16 other differentially expressed proteins, 7 were up-regulated and 9 down-regulated in CAG when com-pared to the same proteins in individually matched normal gastric mucosa. Some of the up-regulated proteins are
mainly involved in inflammation, such as CCR10 and CDC37 (30,31), with effects on the release of inflammatory
cytokines or angiogenesis. The RAD51L1 protein may be involved in the homologous recombination repair pathway of double-stranded DNA in cells (32) and STK19 may be involved in transcriptional regulation (33). FAM3C is a
member of the family with sequence similarity 3 (FAM3)
and encodes a secreted protein with a GG domain and may be up-regulated in some cancer cells like other members of this family (34). Many of the down-regulated proteins are involved in cell cycle regulation or in the promotion of apoptosis. For example, BCCIP and BTG1 may regulate the cell cycle and promote cell cycle arrest (35). CASP7 and PYCARD proteins are involved in caspase-mediated apoptosis (36). Other down-regulated proteins may inhibit cell growth and proliferation and may be considered to be potential tumor suppressor genes, such as HDAC3 (37). In summary, many up-regulated proteins could participate in the regulation of transcription, in DNA repair or proliferation, whereas many down-regulated proteins could inhibit cell division and promote apoptosis.
In short, our study showed a differential protein expression
profile of CAG compared to matched normal mucosa. The candidate proteins confirm the conclusion that CAG is one
of the major precursor diseases of gastric cancer; thus, more effective treatment should be applied to the disease.
Acknowledgments
We thank the Beijing Proteomic Research Center, the Institute of Biochemistry and Cell Biology, the Fourth Military Medical University.
References
1. Weck MN, Brenner H. Prevalence of chronic atrophic gastri-tis in different parts of the world. Cancer Epidemiol Biomark-ers Prev 2006; 15: 1083-1094.
2. Ferlay J, Bray F, Pisani P, Parkin DM. GLOBOCAN 2002: Cancer incidence, mortality and prevalence worldwide. IARC CancerBase No. 5, version 2.0. Lyon: IARC Press; 2004.
3. Tsugane S, Kabuto M, Imai H, Gey F, Tei Y, Hanaoka T, et al. Helicobacter pylori, dietary factors, and atrophic gastritis
in five Japanese populations with different gastric cancer
mortality. Cancer Causes Control 1993; 4: 297-305. 4. Fukao A, Komatsu S, Tsubono Y, Hisamichi S, Ohori H,
Kizawa T, et al. Helicobacter pylori infection and chronic atrophic gastritis among Japanese blood donors: a cross-sectional study. Cancer Causes Control 1993; 4: 307-312. 5. Tatematsu M, Yamamoto M, Shimizu N, Yoshikawa A,
Fu-kami H, Kaminishi M, et al. Induction of glandular stomach cancers in Helicobacter pylori-sensitive Mongolian gerbils treated with N-methyl-N-nitrosourea and N-methyl-N’-nitro-N-nitrosoguanidine in drinking water. Jpn J Cancer Res
1998; 89: 97-104.
6. Sugiyama A, Maruta F, Ikeno T, Ishida K, Kawasaki S, Katsuyama T, et al. Helicobacter pylori infection enhances N-methyl-N-nitrosourea-induced stomach carcinogenesis in the Mongolian gerbil. Cancer Res 1998; 58: 2067-2069. 7. Shimizu N, Inada K, Nakanishi H, Tsukamoto T, Ikehara Y,
Kaminishi M, et al. Helicobacter pylori infection enhances glandular stomach carcinogenesis in Mongolian gerbils treated with chemical carcinogens. Carcinogenesis 1999; 20: 669-676.
8. Parkin DM, Pisani P, Ferlay J. Global cancer statistics. CA Cancer J Clin 1999; 49: 33-64.
9. Correa P. A human model of gastric carcinogenesis. Cancer Res 1988; 48: 3554-3560.
10. Correa P. The epidemiology of gastric cancer. World J Surg
1991; 15: 228-234.
11. Correa P. Human gastric carcinogenesis: a multistep and multifactorial process - First American Cancer Society Award Lecture on Cancer Epidemiology and Prevention. Cancer Res 1992; 52: 6735-6740.
in Finland during a 20-year period. Scand J Gastroenterol
1987; 22: 865-871.
13. Rios-Castellanos E, Sitas F, Shepherd NA, Jewell DP. Changing pattern of gastric cancer in Oxfordshire. Gut 1992; 33: 1312-1317.
14. Wulfkuhle JD, Liotta LA, Petricoin EF. Proteomic applications for the early detection of cancer. Nat Rev Cancer 2003; 3: 267-275.
15. Xing X, Lai M, Gartner W, Xu E, Huang Q, Li H, et al.
Iden-tification of differentially expressed proteins in colorectal
cancer by proteomics: down-regulation of secretagogin.
Proteomics 2006; 6: 2916-2923.
16. Peek RM Jr, Blaser MJ. Helicobacter pylori and gastroin-testinal tract adenocarcinomas. Nat Rev Cancer 2002; 2: 28-37.
17. Obata C, Zhang M, Moroi Y, Hisaeda H, Tanaka K, Murata S,
et al. Formalin-fixed tumor cells effectively induce antitumor
immunity both in prophylactic and therapeutic conditions. J Dermatol Sci 2004; 34: 209-219.
18. Sun Y, Sijts AJ, Song M, Janek K, Nussbaum AK, Kral S, et al. Expression of the proteasome activator PA28 rescues the presentation of a cytotoxic T lymphocyte epitope on melanoma cells. Cancer Res 2002; 62: 2875-2882. 19. Kuckelkorn U, Ferreira EA, Drung I, Liewer U, Kloetzel PM,
Theobald M. The effect of the interferon-gamma-inducible processing machinery on the generation of a naturally tumor-associated human cytotoxic T lymphocyte epitope
within a wild-type and mutant p53 sequence context. Eur J Immunol 2002; 32: 1368-1375.
20. Sijts A, Sun Y, Janek K, Kral S, Paschen A, Schadendorf D, et al. The role of the proteasome activator PA28 in MHC class I antigen processing. Mol Immunol 2002; 39: 165-169.
21. Zhang D, Lim SG, Koay ES. Proteomic identification of
down-regulation of oncoprotein DJ-1 and proteasome acti-vator subunit 1 in hepatitis B virus-infected well-differentiated hepatocellular carcinoma. Int J Oncol 2007; 31: 577-584. 22. Miyagi T, Tatsumi T, Takehara T, Kanto T, Kuzushita N,
Sug-imoto Y, et al. Impaired expression of proteasome subunits and human leukocyte antigens class I in human colon cancer cells. J Gastroenterol Hepatol 2003; 18: 32-40.
23. Lemaire R, Menguellet SA, Stauber J, Marchaudon V, Lucot
JP, Collinet P, et al. Specific MALDI imaging and profiling
for biomarker hunting and validation: fragment of the 11S proteasome activator complex, Reg alpha fragment, is a new potential ovary cancer biomarker. J Proteome Res 2007; 6: 4127-4134.
24. Cheng Q, Lau WM, Tay SK, Chew SH, Ho TH, Hui KM.
Identification and characterization of genes involved in the carcinogenesis of human squamous cell cervical carcinoma.
Int J Cancer 2002; 98: 419-426.
25. Deng SS, Xing TY, Zhou HY, Xiong RH, Lu YG, Wen B, et al. Comparative proteome analysis of breast cancer and adja-cent normal breast tissues in human. Genomics Proteomics Bioinformatics 2006; 4: 165-172.
26. Sun XJ, Hao DM, Zheng ZH, Fu H, Xu HM, Wang MX, et al. [Screening and analysis of associated genes in the car-cinogenesis and progression of gastric cancer]. Zhonghua Yi Xue Yi Chuan Xue Za Zhi 2005; 22: 31-34.
27. Fox JG, Wang TC. Helicobacter pylori infection: pathogen-esis. Curr Opin Gastroenterol 2002; 18: 15-25.
28. Shibata W, Hirata Y, Ogura K, Omata M, Maeda S. [NF-kappaB and MAPK-signaling pathways contribute to the gene expression and host response induced by Helicobacter pylori infection]. Nihon Rinsho 2005; 63 (Suppl 11): 132-137.
29. Lee JS, Kim HS, Hahm KB, Sohn MW, Yoo M, Johnson JA, et al. Inhibitory effects of
7-carboxymethyloxy-3’,4’,5-trimethoxyflavone (DA-6034) on Helicobacter pylori-induced NF-kappa B activation and iNOS expression in AGS cells.
Ann N Y Acad Sci 2007; 1095: 527-535.
30. Marchese A, Docherty JM, Nguyen T, Heiber M, Cheng R, Heng HH, et al. Cloning of human genes encoding novel G protein-coupled receptors. Genomics 1994; 23: 609-618. 31. Dai K, Kobayashi R, Beach D. Physical interaction of
mam-malian CDC37 with CDK4. J Biol Chem 1996; 271: 22030-22034.
32. Rice MC, Smith ST, Bullrich F, Havre P, Kmiec EB. Isolation of human and mouse genes based on homology to REC2, a recombinational repair gene from the fungus Ustilago maydis. Proc Natl Acad Sci U S A 1997; 94: 7417-7422. 33. Sargent CA, Anderson MJ, Hsieh SL, Kendall E,
Gomez-Escobar N, Campbell RD. Characterisation of the novel gene G11 lying adjacent to the complement C4A gene in the human major histocompatibility complex. Hum Mol Genet
1994; 3: 481-488.
34. Zhu Y, Xu G, Patel A, McLaughlin MM, Silverman C, Knecht K, et al. Cloning, expression, and initial characterization of a novel cytokine-like gene family. Genomics 2002; 80: 144-150.
35. Liu J, Yuan Y, Huan J, Shen Z. Inhibition of breast and brain cancer cell growth by BCCIPalpha, an evolutionarily con-served nuclear protein that interacts with BRCA2. Oncogene
2001; 20: 336-345.
36. Entrez Gene: CASP7 caspase 7, apoptosis-related cysteine peptidase. Gene ID: 840.