JULIO MARCOS FILHO2, FRANCISCO GUILHIEN GOMES JUNIOR3, MARK A. BENNETT4, ARTHUR A. WELLS5, SUSAN STIEVE6
USING TOMATO ANALYZER SOFTWARE TO DETERMINE
EMBRYO SIZE IN X-RAYED SEEDS
1ABSTRACT - A primary interest of image analysis of X-rayed seeds is to identify whether the extent of fill in the embryo cavity is associated with to seed physiological quality. The objective of this research was to verify the accuracy of the freely available Tomato Analyzer (TA) software developed at The Ohio State University to determine the ratio of embryo size over total seed area. Seeds of pumpkin, watermelon, cucumber and cotton were X-rayed and analyzed by the software which defines seed and embryo boundaries and automatically generates numerical values to quantify that ratio. Results showed that the TA has the sensitivity to evaluate the extent of embryo growth within the cucurbits and cotton seeds and is a promising alternative for this assessment in other seed species.
Index terms: cotton, cucurbits, imaging analysis, X-ray.
SOFTWARE Tomato Analyzer PARA A DETERMINAÇÃO DO TAMANHO DO EMBRIÃO EM SEMENTES RADIOGRAFADAS
RESUMO - Uma das prioridades atuais da pesquisa sobre análise de imagens de sementes radiografadas é determinar a proporção entre a área ocupada pelo embrião e o espaço disponível na cavidade interna da semente e associar esse parâmetro ao potencial fisiológico. Este trabalho procurou avaliar a eficiência do software Tomato Analyzer para quantificar o grau de desenvolvimento do embrião. Sementes de abóbora, melancia, pepino e algodão foram radiogafadas e as imagens processadas foram submetidas à análise pelo software, que define o perímetro da semente e o do embrião e gera valores utilizados para expressar a relação percentual entre a área do embrião e a da cavidade interna da semente. Os resultados indicaram que o software Tomato Analyzer permite determinar o grau de desenvolvimento do embrião de sementes de cucurbitáceas e de algodão, indicado pela área embrionária ou do espaço livre existente entre o embrião e o tegumento; essa alternativa pode ser viável para avaliar sementes de outras espécies.
Termos para indexação: algodão, cucurbitáceas, análise de imagens, raios X.
1Subbmited on 21/09/2009. Accepted for publication on 11/01/2010.
2Eng. Agr., Dr., Professor, Departament of Production Vegetal, USP/
ESALQ, Caixa Postal 9, 13418-900 Piracicaba, SP. CNPq Scollarship. [email protected].
3Eng. Agr., Ph.D., USP/ESALQ. [email protected].
4B.A. in Biology, PhD, Professor, Department of Horticulture and Crop
Science, The Ohio State University (OSU), 312 A Kottman Hall, 2021
Coffey Road, Columbus, Ohio, 43210-1086, USA. [email protected].
5B.S. in Agriculture, Research Assistant, Ornamental Plant Germplasm
Center (OPGC/OSU), 670 Vernon L. Tharp Street, Columbus, Ohio 43210-1086. USA. [email protected].
6B.S. in Agriculture, M.S., Interim Head Researcher, OPGC/OSU. stieve.1@
INTRODUCTION
Seed analysis is a dynamic activity which is constantly evolving and is characterized by continuing improvements and the standardization of developing procedures. The inclusion of new approaches depends directly of research initiatives and actions. Considering the available resources for evaluating the different seed quality attributes, image analysis is a relatively recent alternative for clarifying diverse aspects of seed performance. Thus, the capture and processing of seed seedling images and or their parts, has allowed the establishment of relationships between seed morphology, integrity and development as well as determining physiological potential.
Analyses using X-rays are considered an advantage because they do not damage the seeds and it is possible to examine their structure and then use them for subsequent tests. The X-ray analysis has been considered as useful to define objective, standardized, and consequently, more precise criteria than those based exclusively on human observation (Cicero et al., 1998; Carvalho et al., 1999; ISTA - International Seed Testing Association, 2004).
Research on the subject has resulted in valuable information which can be used in different stages of seed production, including: identification of physically pure seeds and “empty glumes” in purity analysis of oat seed (Craviotto et al., 2002); evaluation of damage caused by pathogens in soybean and corn seeds (Gunasekaran, 1988); determining the relationship between physical and physiological seed characteristics (Illipronti Jr. et al., 1997); development of a protocol for determining corn seed length and width (Vieira Junior, 1998); determining the relationship between morphological abnormalities and seed germination (Van der Burg et al., 1994); characterization of the seed development stages during maturation (Carvalho et al., 1999; Machado and Cicero, 2003; Mondo and Cicero, 2005); evaluation of mechanical injuries in soybean (Flor et al., 2004) and corn seeds (Cicero et al., 1998), including the relationship with germination and seed vigor (Cicero and Banzatto Junior, 2003); identification of damages caused to soybean seed by stinkbugs (Pinto et al., 2009).
Plant flowering is not absolutely uniform even in cultivars of determinate growth habit. Thus, pollination, fertilization and maturation usually show lack uniformity due to genetic characteristics of the species and cultivars and also climate effects. Consequently, mature seed may show significant structural variations including the occurrence of abnormalities which may directly affect germination and vigor.
One of the morphological variations probably related
to seed performance is embryo size, that is, the ratio between the degree of embryonic development and the available space in the internal seed cavity. This characteristic has been evaluated using image analysis, especially in X-rayed seeds (Machado and Cicero, 2003; Pupim et al., 2005), in an attempt to separate the seeds into different categories (e.g.: ratio less than 50%, between 50% and 75%, 75% to 90%, more than 90%) and associate those results to germination and vigor. This classification is based on visual estimates but more precise determinations of these parameters are necessary to develop more consistent models to define the extent of embryonic development categories or free spaces inside seeds.
Therefore, the documented knowledge of the potential use of the X-ray analysis of seed structure is still insufficient considering the wide variety of species produced, their production systems and respective problems and, as a consequence, the development of more efficient procedures for its extensive use.
According to Liu et al, (1993), free space is an expression used to describe the occurrence of empty spaces between the embryo and the endosperm or between the seed contents and the tegument and was first determined for tomato seeds. These areas, detected by X-rays, have been studied in seeds of other species with the aim of identifying their relationship with germination and vigor.
Based on results from X-ray tests, Dell’Aquilla (2007) found that green pepper seeds, which had free areas between the embryo and the endosperm greater than 2.7%, showed a progressive reduction in the formation of normal seedlings. It was considered that the quantification of this area could be an indication of seed germination potential or, on the other hand, of the evolution of the process of deterioration.
More recently, researchers from The Ohio State University in the USA, have developed a software, called the Tomato Analyzer (TA), for the semi-automatic evaluation of the phenotypic characteristics of fruits and which can be adapted to seed analysis. The software can substitute the determination of some morphological attributes measured manually or estimated subjectively (Brewer et al., 2006; Brewer et al., 2007), and allow a faster phenotypic analysis resulting in information with a high degree of consistency and repeatability.
groups of seeds, there are still no published data on this. Further research could establish an efficient alternative for identifying relationships between seed structure (morphology) and the physiological potential; the procedures are relatively simple, quick and economic and represent an important initiative for standardization and advances in seed technology.
Consequently, the principal objective of this study was to verify the possibility of the use and efficiency of the Tomato Analyzer software for determining the degree of embryonic development in relation to the total seed area. The research included X-ray analyses and the use of software with cotton and cucurbit seeds.
MATERIAL AND METHODS
The research was performed at the Image Analysis Laboratory, Department of Crop Science, E.S.A., “Luiz de Queiroz, University of São Paulo (LPV/USP/ESALQ) and in the Seed Laboratory of the Ornamental Plant Germplasm Center (OPGC), The Ohio State University (OSU), in May/July 2009. Cucurbit and cotton seed samples were X-rayed and the images processed with the Adobe Photoshop 7.0 software before being analyzed by the Tomato Analyzer (TA) software.
X-rays imaging
a) Cotton: seeds of the cultivars Delta Penta and HIC5 were used. First of all, the X-ray images of ‘Delta Penta’ were obtained at the LPV/USP/ESALQ, using the non-digital Faxitron X-Ray, model MX-20 equipment; seeds were exposed to 15 kV for 360 s, at 38 cm from the radiation source. Three replications of 25 seeds each placed in individual wells in an acrylic plate, were examined. Film development was provided in a Hope X-Ray processor, model 319 Micromax. Later, the X-ray film images were digitalized in an Umax Scanner, model Power Look 1100, adjusted for a 3600 dpi resolution, enlarged and visualized in a computer.
The X-rays of three replications of 10 seeds each from cv. HIC5 were obtained in the laboratory of the OPGC/OSU, from a Faxitron model MX-20 digital equipment at 20 kV for 20 s, also at 38 cm from the radiation source.
In both cases, after the computer processing of the images, brightness/contrast adjustments were provided to improve visualization of the seed structure and allow its recognition by the TA software.
b) Cucurbits: cucumber seeds of Jóia and Muncher cultivars were used for the analyses performed at the LPV/USP/ESALQ and at the OPGC/OSU, respectively. The procedures, including the equipment, were as described for the cotton seed analysis, except for the radiation intensity and exposure period: from 35
kV/15 s, for ‘Jóia’ seeds, and from 18 kV/20 s, for ‘Muncher’ seeds.
Images of watermelon (45 kV/ 20 s) and squash seeds (45 kV/25 s) were also examined in an attempt to expand the possible use of the TA software by X-raying in a Faxitron-HP, model 43085-N., supplied by Maria Laene M. de Carvalho, of the Universidade Federal de Lavras (UFLA/MG).
Evaluation of embryo size using the Tomato Analyzer software
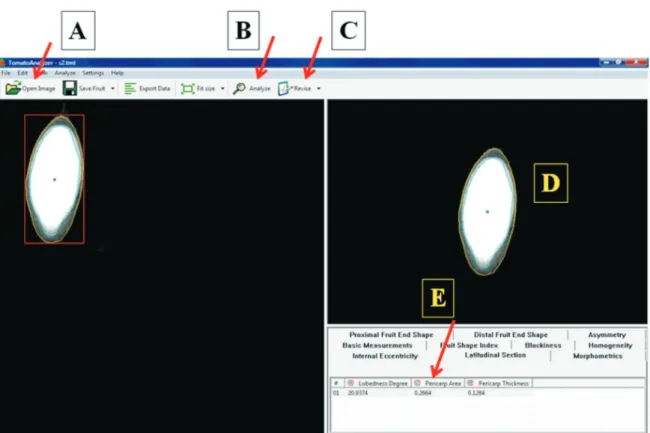
The analysis procedure was the same for all the seed species examined. After obtaining the X-ray images, the seeds were examined individually with the software. After opening the image (“Open Image”), the option “Analyze” was chosen and the external perimeter of the seed was traced in yellow.
Since this tracing is not perfect, adjustments of the perimeter shape are usuaally needed to correct distortions. Therefore, “Revise”, option “Boundary” were chosen from the menu and the necessary corrections are made with the help of the left-hand button on the mouse, as described in the software manual (Brewer et al., 2008). Both the file with the software and the instruction manuals may be freely accessed at www.oardc. ohio-state.edu/vanderknaap .
Once the seed perimeter is defined, the next stage was to trace the embryo perimeter, selecting once more “Revise” from the menu; the option “Default Pericarp Boundary” allows movement of the pointer to define a percentage value estimated for embryo size (e.g., 80%, in relation to the seed perimeter). The image is processed and the embryo perimeter is traced in blue.
Then, as described for tracing the seed periphery, adjustments to the embryo shape may be necessary. This is done by once again selecting “Revise”, option “Adjust Pericarp Boundary” and, with the help of the left-hand button on the mouse, correcting all the distorted points.
After each seed is analyzed and evaluated, the software automatically generates numbers for the parameters analyzed. The direct reading of the value corresponding to the “Pericarp Area”, expressed in decimals (e.g., 0.23) identifies the free space between the embryo and the tegument; the difference for 1.0 represents the ratio between the embryo area and the internal seed cavity to be directly obtained; therefore, in this case, it would be 77.0% (1.0 – 0.23). After analyzing and processing the image and the software calculations, each seed’s file was saved in a previously identified folder in the computer.
FIGURE 1. General view of the Tomato Analyzer software screen, showing an analyzed image of a cucumber seed with the main menu options and the numerical result, where A = “Open Image”; B = “Analyze”; C = “Revise”; D = Image Analyzed; E = “Pericarp Area”.
RESULTS AND DISCUSSION
This research did not generate data which could be statistically analyzed because no treatments effects or causes of variation related to seed or embryo characteristics were evaluated. The main objective of the study was to verify whether the Tomato Analyzer software could provide precise and consistent data on the ratio of the embryo area to the internal seed cavity.
The TA software was developed on the Wooster campus of OSU to be used in vegetable plant breeding programs and considering that the tomato is an excellent model for improving knowledge about the molecular basis of genetic diversity (Gonzalo et al., 2009). Thus, the TA could constitute a standard procedure for the morphological characterization of tomato fruits and it could be potentially used in other plant species and seed structure studies.
This research is probably the first attempt to verify the viability of using this software for seed studies. Promising results were obtained as shown in Figure 3; it was possible to identify and trace the seed perimeter in watermelon, the shape of the embryo and calculate the percentage area ratio of the embryo/internal seed cavity, which was 78% in this case.
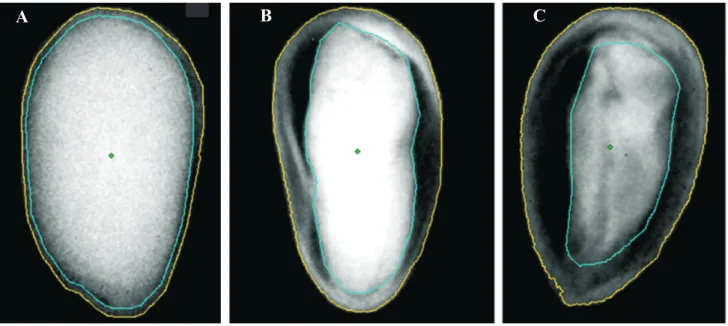
Similar information was produced for squash seeds (Figure 4), which showed differences regarding the seed area filled by the embryo. Image B is a damaged seed (embryo/internal cavity ratio = 45%), with the damage causing a reduction of the embryo area compared to the value for a normally-formed seed (image A). Therefore, it was confirmed that the TA software can be an important tool for evaluating seed structure.
FIGURE 3. Analysis of the X-ray image (45 kV / 15 s) of watermelon seed. Value obtained for “Pericarp Area” = 0.22, corresponding to the ratio embryo/ internal seed cavity = 78%.
X-ray supplied by Maria Laene M. de Carvalho, Universidade Federal de Lavras.
A
B
FIGURE 4. Analysis of seed X-ray images (45 kV / 25 s) of squash seeds. Values obtained for “Pericarp Area” = 0.30 (A) and 0.55 (B), corresponding to the ratios embryo/internal seed cavity = 70% and 45%, respectively.
X-rays supplied by Maria Laene M. de Carvalho, Universidade Federal de Lavras.
It should be emphasized that the images shown in Figures 3 and 4 were printed scanned versions and not their original ones. Brewer et al. (2008) declared that an essential condition for precise results from TA analyses is the quality of the image to be evaluated. However, it was seen that even in a situation where there was a loss in image quality (e.g. from scanned images) compared to the original, reliable results were possible.
The cucumber seed structure, smaller than those of watermelon and squash, were also efficiently identified (Figure 5), indicating that the TA can also evaluate smaller seeds where it is more difficult to determine free spaces. In this case, special precautions are needed to obtain clear X-rays and process the images with the Adobe Photoshop or other software.
As previously mentioned, one of the present research priorities for the seed X-ray images analysis is the identification of free spaces inside the seeds (Liu et al., 1993; Dell’Aquila, 2007) or the ratio embryo area/ internal area of the seed cavity (Pupim et al., 2005), in an attempt to relate these parameters with physiological potential. Previous studies have demonstrated some lack of precision of information based only on the
A
B
FIGURE 5. Analysis of seed X-ray images (18 kV / 15 s) of cucumber seeds. Values obtained for “Pericarp Area” = 0.13 (A) and 0.25 (B), corresponding to the ratios embryo/internal seed cavity = 87% and 75%, respectively. A = cv.A = cv. Jóia; B = cv. Muncher.Muncher.
visual seed examination which may provide imprecise results, difficult to standardize owing to the subjectivity involved. The development of consistent methodology supported by computer techniques, such as the TA software, represents a significant evolution for improving seed image analysis.
Evaluation of cotton seeds also produced consistent results. The images included in Figure 6, obtained from digital equipment (Faxitron MX-20), permit the detection of differences regarding the area filled by the embryo and show that the X-rays produced by this equipment allowed a more precise evaluation of embryonic development compared to X-rays from the non-digital version of the Faxitron MX-20. This emphasizes the importance of the image quality being analyzed.
Therefore, the results from this study provided interesting information on the possibility of using the Tomato Analyzer software to evaluate seed structure, more specifically the degree of embryonic development. Therefore, besides future observations on the relationship of this parameter with the possible establishment of limiting values for differentiating viable from unviable seeds, there are other approaches which
FIGURE 6. Analysis of seed X-ray images (20 kV / 20 s) of cotton seeds ‘HCI 5’. Values obtained for “Pericarp Area” = 0.14 (A), 0.43 (B) and 0.59 (C), corresponding to the ratios embryo/internal seed cavity of 86%, 57% and 41%, respectively.
REFERÊNCIAS
BREWER, M.T; LANG, L.; K.; DUJMOVIC, N.; GRAY, M.; VAN DER KNAAP, E. Development of a controlled vocabulary and software application to analyze fruit shape variation in tomato and other plant species. Plant Physiology, v.141, n.1, p.15-25, 2006.
BREWER, M.T.; MOYSEENKO, J.B.; MUNFORTE, A.J.; VAN DER KNAAP, E. Morphological variation in tomato: a comprehensive study of quantitative trait loci controlling fruit shape and development. Journal of Experimental Botany, v.58, n.6, p.1339-1349, 2007.
BREWER, M.T.; RODRIGUEZ, G.; GONZALO, M.J.; LANG, L.; SULLIVAN, D.; DUJMOVIC, N.; FUJIMURA, K.; GRAY, S.; van der KNAAP, E. Tomato Analyzer (TA) user manual version 2.2.00. 18p., 2008. Disponível em:�18p., 2008. Disponível em:�http:// www.oardc.ohio-state.edu/vander knaap>. Acesso em: 20 out. 2008.
CARVALHO, M.L.M.; AELST, A.C.V.; ECK, J.W.V.; HOEKSTRA, F.A. Pre-harvest stress cracks in maize (Zea mays L.) kernels as characterized by visual, X-ray and low temperature scanning electron microscopical analysis: effect
A
B
C
Species whose seeds have a tegument and embryo with no endosperm seem to be more indicated for this type of analysis because these seeds often have recognizable free spaces between the embryo periphery and the tegument. Certainly, the dynamism of Seed Technology researchers should significantly contribute to increasing knowledge in this area through more diverse approaches and new suggestions for research in the area of seed and plant image analysis.
CONCLUSIONS
Information generated by this study showed that the Tomato Analyzer software is sensitive enough to consistently evaluate the degree of development of the seed embryo in cucurbit and cotton seeds, expressed by the embryonic area or by the free space between the embryo and seed coat. This procedure is considered promising for seeds from other species which have a structure similar to those seeds studied here.
ACKNOWLEDGEMENTS
To Dr. Esther van der Knaap for the excellent suggestions provided during this research conception and development. Maria Laene M. de Carvalho is also
on kernel quality. Seed Science Research, v.9, n.3,
p.227-236, 1999.
CICERO, S.M.; BANZATTO JUNIOR., H.L. Avaliação do relacionamento entre danos mecânicos e vigor, em sementes de milho, por meio da análise de imagens. Revista Brasileira de Sementes, v.25, n.1, p.29-36, 2003.
CICERO, S.M.; VAN DER HEIJDEN, G.W.A.M.; VAN DER BURG, W.J.; BINO, R.J. Evaluation of mechanical damages in seeds of maize by X-ray and digital imaging. Seed Science and Technology, v.26, n.3, p.603-612, 1998.
CRAVIOTTO, R.M.; YOLDJLAN, A.M.; SALINAS, A.R.; ARANGO, M.R.; BISARO, V; MATURO, H. Description of a pure seed fraction of oat through usual evaluations and radiographic images. Pesquisa Agropecuária Brasileira, v.37, n.8, p.1183-1188, 2002.
DELL’AQUILLA, A. Towards new computer imaging techniques applied to seed quality testing and sorting. Seed Science and Technology, v.35, n.3, p.519-538, 2007.
FLOR, E.P.O.; CICERO, S.M.; FRANÇA NETO, J.B.; KRZYZANOWSKI, F.C. Avaliação de danos mecânicos em sementes de soja por meio da análise de imagens. Revista Brasileira de Sementes, v.26, n.1, p.68-76, 2004.
GONZALO, M.J.; BREWER, M.T.; ANDERSON, C.; SULLIVAN, D.; GRAY, S.; VAN DER KNAAP, E. Tomato fruit shape analysis using morphometric and morphology attributes implemented in tomato analyzer software program.
Journal of the American Society of Horticultural Science, v.134, n.1, p.77-87, 2009.
GUNASEKARAN, S.; COOPER, T.M.; BERLAGE, A.G. Evaluating quality factors of corn and soybeans using a computer vision system. Transactions of ASAE, v.31, n.4,
p.1264-1271, 1988.
ILLIPRONTI JUNIOR., R.A.; LANGERAK, C.J.; LOMMEN, W.J.M. Variation in and relationships between
physical and physiological seed attributes within a soybean seed lot. Seed Science and Technology, v.25, n.2,
p.215-231, 1997.
INTERNATIONAL SEED TESTING ASSOCIATION (ISTA). International rules for seed testing. 174p. 2004.
LIU, Y.; VAN DER BURG, W.J.; AARTSE, J.W.; VAN ZWOL, R.A.; JALINK, H.; BINO, R.J. X-ray studies on changes in embryo and endosperm morphology during priming and imbibition of tomato seeds. Seed Science Research, v.3, n.3, p.171-178, 1993.
MACHADO, C.F.; CICERO, S.M. ‘Aroeira branca’ seed quality evaluation by the X-ray test. Scientia Agricola, v.60,
n.2, p.393-397, 2003.
MONDO, V.H.V.; CICERO, S.M. Análise de imagens na
avaliação da qualidade fisiológica de sementes de milho localizadas em diferentes posições na espiga. Revista Brasileira de Sementes, v.27, n.1, p.9-18, 2005.
PINTO, T.L.F.; CICERO, S.M.; FRANÇA NETO, J.B.F.; FORTI, V.A. An assessment of mechanical and stink bug damage in soybean using X-ray analysis test. Seed Science and Technology, v.37, n.1, p.110-120, 2009.
PUPIM, T.L.; PEIXOTO, M.R.; CARVALHO, M.L.M. Qualidade fisiológica de sementes de cucurbitáceas submetidas ao teste de raio X. Informativo Abrates, v.15,
n.1/2/3, p.238, 2005.
VAN DER BURG, W.J.; AARTSE, J.W.; VAN ZWOL, R.A.; BINO, R.J. Predicting tomato seedling morphology by X-ray analysis of seeds. Journal of the American Society of Horticultural Science, v.119, n.2, p.258-263, 1994.