F
ACULDADE DEE
NGENHARIA DAU
NIVERSIDADE DOP
ORTODigital Image Colorimetry for
Determination of Sulfonamides in
Water
Paulo Jorge Teixeira Silva
Mestrado Integrado em Engenharia Eletrotécnica e de Computadores Supervisor: Hélder Filipe Pinto de Oliveira
Co-Supervisor: Marcela Alves Segundo Co-Supervisor: Sílvia Neto Bessa Co-Supervisor: Patricia S. Peixoto
Resumo
Agentes antimicrobianos são considerados poluentes emergentes na água, devido ao seu po-tencial para acelerar a propagação de genes de resistência bacteriana e ao seu efeito nocivo para o ecossistema através da morte ou inibição da microbiota natural. As sulfonamidas (SAs) são um importante grupo antimicrobiano amplamente utilizado em medicina humana e veterinária. Estudos demonstraram que as SAs estão altamente presentes no solo sem bioacumulação. Além disso, estes compostos parecem ser bastante resistentes à biodegradação em águas superficiais, o que pode beneficiar a contaminação do meio aquático envolvente. Dito isto, a monitorização dos níveis de concentração de SAs na água é muito importante para determinar o risco de contami-nação do meio aquático.
Vários métodos para a determinação de SAs na água já foram desenvolvidos. A maioria deles é baseada no acoplamento de cromatografia líquida de alta performance (LC) e espectrometria de massa (MS). LC-MS é frequentemente utilizado devido à sua alta sensibilidade e especificidade. No entanto, esta abordagem é muito dispendiosa e não permite análises in situ. Assim, é necessário o desenvolvimento de métodos capazes de realizar triagem no campo.
Métodos baseados em colorimetria de imagens digitais já são usados em testes de campo, análises forenses e monitorização ambiental. Estes métodos são alternativas promissoras para técnicas de triagem de campo porque são métodos rápidos, de baixo custo, portáteis e de fácil manuseamento.
Nesta dissertação, propõe-se uma técnica de colorimetria de imagens digitais que consiste em analisar a resposta de cor de imagens digitais com um algoritmo de processamento de imagem automático para estabelecer uma relação entre as características de cor de um analito e sua con-centração. Garantido este relacionamento, um protótipo para uma aplicação Android é fornecido. A aplicação Android é uma alternativa rápida, fácil e eficiente para a detecção de SAs na água.
Para desenvolver a referida técnica, foram estudados e comparados vários métodos de segmen-tação de imagem e métodos de correção de cor, para determinar a melhor solução a implementar no produto final. O objetivo final desta dissertação foi criar um algoritmo independente do dis-positivo utilizado capaz de determinar a concentração de SA numa determinada amostra de água. Este objetivo não foi totalmente alcançado porque, devido ao baixo desempenho dos métodos de correção de cor usados, a constância de cores entre os vários dispositivos utlizados não foi assegu-rada. No entanto, uma alternativa dependente do dispositivo utilizado foi criada. Esta alternativa pode ser usada para determinar a concentração de SA de uma determinada amostra com um erro médio inferior a 10% que é aceitável para este tipo de aplicações.
No entanto, como esta foi, segundo o meu melhor conhecimento, uma abordagem inovadora para resolver o problema em questão, estes primeiros resultados sugerem que, no futuro, é possível atingir o objetivo final, melhorando o desempenho dos métodos de correção de cor implementados. Palavras-Chaves: Química Analítica baseada em Visão Computacional, Processamento de Imagens, Segmentação de Imagens, Correção de cor.
Abstract
Antimicrobial agents are considered emerging pollutants in water, because of their potential to accelerate spread of bacterial resistance genes, and due to their harmful effect to ecosystem through death or inhibition of natural microbiota. Sulfonamides (SAs) are an important antimicro-bial group that is widely used in both human and veterinary medicine. Studies have demonstrated that SAs are highly available in the soil with no bioaccumulation. Furthermore, these compounds seem to be quite resistant to biodegradation in surface water which can promote contamination of aquatic environment. Thus, monitoring of SA levels in water is very important to determine their aquatic risk assessment.
Several methods for determination of SAs in water have been developed. Most of them are based on the coupling of high-performance liquid chromatography (LC) and mass spectrometry (MS). LC-MS is widely used due to their high sensitivity and specificity, however, this approach is very expensive and does not allow in situ analysis. Hence, development of field deployable screening methods is required.
Methods based on digital image colorimetry have been broadly applied for point-of-care tests, forensic analysis and environmental monitoring. These digital image based methods are very promising as field screening techniques because they are fast, low cost, portable and easy handling methodologies.
In this dissertation, a digital image colorimetric technique is proposed. This technique consists in analyzing the color response of digital images with an automatic image processing algorithm to establish a relationship between the color characteristics of an analyte and its concentration. Once this relationship has been established, a prototype for an Android application is provided. The Android application is a quick, easy and efficient alternative for screening SAs in water.
To develop such technique, various image segmentation methods and color correction methods were studied and compared, in order to determine the best solution to implement in the final product. One of the goals of this dissertation was to create a device-independent algorithm capable of determining the SA concentration in a given sample of water. Although a satisfactory device-independent algorithm was not achieved, due to the under-performance of the color correction methods used, color constancy throughout the multiple devices could not be guaranteed. However, a device-dependent alternative was created. This alternative can be used to determine the SA concentration of a given sample with an average error lower than 10%, which is satisfactory for such an application.
Since this was, to the best of my knowledge, an innovative approach to solve the problem at hand, these first results suggest that, in the future, it is possible to achieve the ultimate objective by improving the performance of the color correction methods implemented.
Keywords: Computer Vision Analytical Chemistry, Image Processing, Image Segmentation, Color Correction.
Agradecimentos
Depois de todos estes anos de universidade, reservo esta página da minha dissertação para agradecer às pessoas que me apoiaram e que tornaram esta fase da minha da minha vida em algo inesquecivél. Aproveito ainda para agradecer às pessoas que contribuiram para a realização deste trabalho.
Primeiramente, gostaria de agradecer ao meu orientador, o Professor Hélder Oliveira, não só pela motivação e orientação oferecida ao longo deste trabalho prático, mas também pela paciência que demonstrou ter comigo, quando nem sempre sou a pessoa mais fácil de orientar.
Gostaria de agradecer ainda à minha co-orientadora, Sílvia Bessa, pelas suas sugestões de abordagem aos problemas que me iam surgindo e também pela enorme disponibilidade que demon-strou para me ajudar.
Quero agradecer também à minha outra co-orientadora, Patricia Peixoto, pela sua boa dis-posição, pelos bons momentos passados durante as experiências laboratoriais e pela ajuda prestada durante o processo de escrita desta dissertação.
Deixo também uma palavra de agradecimento à Professora Marcela Segundo, pelos inúmeros conhecimentos que me transmitiu durante a duração deste trabalho.
Desejo ainda agradecer ao INESC TEC e à Faculdade de Farmácia da Universidade do Porto pela disponibilização de excelentes condições de trabalho.
Sem assinalar ninguém em particular, gostaria de agradecer aos amigos e colegas com quem partilhei estes últimos anos da minha vida e que, de uma forma ou de outra, contribuiram para criar memórias que jamais irei esquecer.
Por último, mas não menos importante, gostaria de agradecer aos meus pais, não só pelo suporte financeiro ao longo do meu percurso académico, mas acima de tudo pelo afeto e carinho que sempre demonstraram ter por mim. Espero um dia conseguir retribuir um pouco daquilo que vocês sempre me deram. Quero também deixar uma palavra especial de apreço aos meus irmãos, pela sua companhia e prontidão em ajudar-me sempre que necessário. Considero-me um pessoa extremamente feliz por fazer parte desta família. É com grande orgulho que vos dedico a conclusão da minha jornada académica.
A todos, o meu Muito Obrigado! Paulo Silva
“Intellectual growth should commence at birth and cease only at death”
Albert Einstein
Contents
1 Introduction 1 1.1 Context . . . 1 1.2 Motivation . . . 1 1.3 Objectives . . . 2 1.4 Contributions . . . 2 1.5 Document Structure . . . 22 State of the Art 5 2.1 Sulfonamide Detection . . . 5
2.2 Chromogenic reaction between SAs and p-DMACA . . . 8
2.3 Computer vision-based analytical procedures . . . 9
2.4 Colorimetry and Color Spaces . . . 12
2.5 Image Acquisition, processing and analysis . . . 15
2.6 Digital Image Processing . . . 16
2.7 Summary . . . 18
3 Digital Image Colorimetry for SA Determination 19 3.1 Chemical Reaction . . . 19
3.2 Materials and Methods . . . 20
3.3 Extraction Procedure . . . 20
3.4 Database Acquisition Protocol . . . 21
3.5 Image Processing and Analysis . . . 24
3.5.1 Sample Segmentation . . . 25
3.5.2 Color Checker Segmentation . . . 25
3.6 Color Constancy . . . 28
3.6.1 White Balance . . . 29
3.6.2 Color Correction . . . 29
3.7 Color/Concentration Model . . . 30
3.7.1 Color Space Comparison . . . 30
3.7.2 Color Stability . . . 30 3.8 Evaluation Metrics . . . 31 3.8.1 Image Segmentation . . . 31 3.8.2 Color Constancy . . . 31 3.8.3 Color/Concentration Model . . . 32 3.9 Summary . . . 32 ix
4 Results 33
4.1 Database Acquisition . . . 33
4.2 Image Processing and Analysis . . . 34
4.2.1 Sample Segmentation . . . 34
4.2.2 Color Checker Segmentation . . . 36
4.3 Color Constancy . . . 44
4.3.1 White Balance . . . 44
4.3.2 Color Correction (RGB-RGB) . . . 47
4.3.3 Color Correction (RGB-XYZ) . . . 51
4.4 Color/Concentration Model . . . 55
4.4.1 Color Space Comparison . . . 55
4.4.2 Curve Fitting . . . 57 4.4.3 Model Validation . . . 58 4.4.4 Limit of Detection . . . 64 4.4.5 Color Stability . . . 65 4.4.6 Summary . . . 66 5 Android Application 67 5.1 Functional Requirements . . . 67 5.2 System Architecture . . . 68 5.3 Mock-up . . . 69 5.4 Initial Prototype . . . 72 5.5 Summary . . . 74
6 Conclusions and Future Work 75 6.1 Conclusions . . . 75
6.2 Future Work . . . 75
List of Figures
2.1 Analytical methods that have usually been applied to the detection of sulfonamides
over the past years [1]. . . 7
2.2 Condensation of p-dimethylaminocinnamaldehyde with aniline, nitroanilines, aminophe-nols, toluidines, and aminobenzoic acids [2]. . . 9
2.3 Schematic representation of DMACA and SAs reaction in acidic medium [3]. . . 9
2.4 The computer vision-base analytical chemistry approach [4]. . . 10
2.5 Number of CVAC paper published between 1960 and 2015 [5] . . . 11
2.6 Macbeth Color Checker . . . 17
3.1 Schematic of colorimetric reaction between p-dimethylaminocinnamaldehyde (DMACA) and sulfonamides (SAs). . . 20
3.2 Schematic view of extraction procedure and colorimetric analysis of sulfamethox-azole. . . 21
3.3 Smartphones used for the acquisition of the database. . . 21
3.4 Support used for the databse acquisition . . . 22
3.5 X-Rite color rendition Chart . . . .R 23 3.6 Example of an image from the acquisitions database . . . 23
3.7 Sample segmentation algorithm pipeline . . . 25
3.8 Edge Based (Canny) Segmentation Pipeline . . . 27
3.9 Adaptive Threshold 1 Pipeline . . . 28
3.10 Intensity Profile based Segmentation Pipeline . . . 28
4.1 Color variation between different concentrations . . . 34
4.2 Sample Segmentation Algorithm . . . 34
4.3 Color Checker Segmentation Algorithm . . . 36
4.4 Image Rotation Algorithm . . . 37
4.5 Edge-based Segmentation (Canny Method) . . . 38
4.6 Segmentation with a higher sensitivity adaptive threshold value . . . 39
4.7 Segmentation with a lower sensitivity adaptive threshold value . . . 40
4.8 Intesity Profile Based Segmentation . . . 41
4.9 White Balance Results: Before and After . . . 44
4.10 White Balance Results - Absolute Error . . . 45
4.11 White Balance Results - Relative Error . . . 46
4.12 White Balance Results: Before and After . . . 47
4.13 RGB-RGB Color Correction Results - Absolute Error . . . 48
4.14 RGB-RGB Color Correction Results - Relative Error . . . 49
4.15 White Balance Results: Before and After . . . 51
4.16 RGB-XYZ Color Correction Results - Absolute Error . . . 52 xi
4.17 RGB-XYZ Color Correction Results - Relative Error . . . 53
4.18 Color Space Comparison . . . 56
4.19 Curve Fitting using the Hue component . . . 57
4.20 Curve Fitting using the a* component . . . 57
4.21 Model Validation (a): Concentration: Expected vs Calculated; (b): Absolute Er-ror; (c): Relative Error . . . 59
4.22 Image Database Comparison . . . 60
4.23 Smarthphone Camera Comparison . . . 61
4.24 Color Measurements Analysis . . . 61
4.25 "Leave-one-out" cross validation method [6] . . . 62
4.26 New Model Validation (a): Concentration: Expected vs Calculated; (b): Absolute Error;(c): Relative Error . . . 62
4.27 Horwitz Funtion also known as "Horwitz Trumpet" [7] . . . 63
4.28 Illustration of the concept of LOD and LOQ [8] . . . 64
4.29 Results form the color stability study . . . 65
5.1 System Architecture of the Android application . . . 68
5.2 Home Screen and Main Menu . . . 69
5.3 The 3 step process for SA determination . . . 70
5.4 Additional Functionality: Consult past results . . . 70
5.5 About Us, FAQ and Options Menu . . . 71
5.6 Initial Prototype: Upload an Image . . . 72
List of Tables
3.1 Smartphone specifications. . . 22
3.2 SMZ concentrations used in the database acquisition . . . 24
3.3 SMZ concentrations used in color stability test . . . 31
4.1 Results obtained from the evaluation of algorithm used for the sample segmentation 35 4.2 Results obtained from the evaluation of the different methods used to segment the color patches from the color checker. . . 42
4.3 Results from the White Balance algorithm . . . 46
4.4 Results from the RGB-RGB color correction algorithm . . . 50
4.5 Results from the RGB-XYZ color correction algorithm . . . 54
4.6 SMZ concentrations used in the database acquisition . . . 58
Abbreviations and Symbols
CE Capillary Electrophoresis CC Color Corretion
CVAC Computer Vision Analytical Chemistry FAQ Frequently Asked Questions
HPLC High Performance Liquid Chromatography HTTP Hypertext Transfer Protocol
LC Liquid Chromatography LOD Limit of Detection LOQ Limit of Quantification MS Mass Spectometry MSE Mean Squared Error OS Operating System
p-DMACA p-Dimethylaminocinnamaldehyde PHP PHP: Hypertext Preprocessor RGB Red-Green-Blue
ROI Region of Interest
RMSE Root Mean Squared Error StD Standard Deviation SA Sulfonamide SMZ Sulfmethoxazole
SQL Structured Query Language SSE Sum of Squares Due to Error SSR Sum of Squares of the Regression SST Total Sum of Squares
UHPLC Ultra High Performance Liquid Chromatography WB White Balance
XML Extensible Markup Language
Chapter 1
Introduction
1.1
Context
Antimicrobial resistance is one of the most serious health threats. Infections from resistant bacteria are now too common, and some pathogens have even become resistant to multiple types or classes of antibiotics (antimicrobials used to treat bacterial infections). The loss of effective antibiotics will undermine our ability to fight infectious diseases and manage the infectious com-plications common in vulnerable patients undergoing chemotherapy for cancer, dialysis for renal failure, and surgery, especially organ transplantation, for which the ability to treat secondary in-fections is crucial.
The misuse of antibiotics is the single most important factor leading to antibiotic resistance around the world. Antibiotics are among the most commonly prescribed drugs used in human medicine. However, up to 50% of all the antibiotics prescribed for people are not needed or are not optimally effective as prescribed. Antibiotics are also commonly used in food animals to prevent, control, and treat disease, and to promote the growth of food-producing animals.
The other major factor in the growth of antibiotic resistance is spread of the resistant strains of bacteria from person to person, or from the non-human sources in the environment, including food. There are four core actions that will help fight these deadly infections: preventing infections and preventing the spread of resistance; tracking resistant bacteria; improving the use of today’s antibiotics and promoting the development of new antibiotics and developing new diagnostic tests for resistant bacteria.
1.2
Motivation
Antibiotic resistance is a worldwide problem. New forms of antibiotic resistance can cross in-ternational boundaries and spread between continents with ease. Many forms of resistance spread with remarkable speed. World health leaders have described antibiotic resistant microorganisms as “nightmare bacteria” that “pose a catastrophic threat” to people in every country in the world. Each year in the United States, at least 2 million people acquire serious infections with bacteria
that are resistant to one or more of the antibiotics designed to treat those infections. At least 23,000 people die each year as a direct result of these antibiotic-resistant infections and many more die from other conditions that were complicated by an antibiotic resistant infection [9].
When first-line and then second-line antibiotic treatment options are limited by resistance or are unavailable, healthcare providers are forced to use antibiotics that may be more toxic to the patient and frequently more expensive and less effective.
Because of the increasing seriousness of this threat, creating monitoring programs for deter-mination of antibiotic levels in the environment is important. The commonly used methods to monitor the antibiotic levels in the environment are expensive and difficult to use on a large scale. This discourages the authorities from deploying these monitoring programs. Therefore, there is a need for cheaper and easier to use solutions.
Thanks to the advancements made in computer vision-based analytical chemistry, more specif-ically in the field of digital image colorimetry, and the advent of the smarthphone, it is now possible to create affordable and easy to use solutions for large scale environmental monitoring. A innova-tive approach to determine SAs concentration, based on digital image colorimetry for hand-held devices is proposed in this thesis.
1.3
Objectives
The main goal of this thesis is to create a digital image colorimetry method to determine the SAs concentration in a sample of water. To do this, we need to establish a relationship between the color characteristics in a digital image of an analyte and its concentration. After that relationship has been established, a quick, easy and efficient way to detect the presence of SAs in water will be provided. Once detected, the polluted areas may be decontaminated therefore preventing the spread of bacterial resistant genes.
1.4
Contributions
The proposed solution consists in developing a digital image-based colorimetry Android appli-cation prototype for screening of SAs in water by analyzing the color response with an automatic image processing algorithm.
1.5
Document Structure
This dissertation is divided into 6 chapters. Following this first introductory chapter, comes a chapter that describes the state-of-the-art and contains a bibliographic review of the literature upon this work was based.
In chapter 3, a description of the materials, methods and procedures used in this work to achieve the proposed objectives is given.
1.5 Document Structure 3
In chapter 4, the results of the methods and procedures described in the previous chapter are presented and discussed.
Chapter 5 offers information regarding the creation of the prototype for the Android applica-tion.
Finally, in chapter 6, the final conclusions of this thesis are divulged. A critical evaluation of the work is done and suggestions for future works are given.
Chapter 2
State of the Art
2.1
Sulfonamide Detection
Several analytical methods for determination of sulfonamides (SA) residues have been devel-oped. These methods can be classified into three groups - quantitative, screening and confirma-tory [1]:
• Quantitative methods are mostly based on chromatography and different electrokinetic sep-aration methods such as capillary electrophoresis, that allow for the quantification of SAs. However, these methods usually require complex procedures, advanced laboratory equip-ment and trained operators, therefore these methods are time-consuming and expensive. • Screening methods can detect substances or chemical constituents at the level of interest
and usually provide semi-quantitative results. These methods must allow for the reliable checking of samples, and only those samples indicating the presence of the analyte should be selected for a thorough analysis. The advantages of screening methods are a low percentage of false compliant samples, short analysis time and high throughput, ease of use, acceptable selectivity and low cost.
• The main feature of confirmatory methods is their ability to reliably identify a compound. Since these methods are as expensive as they are complex, they are advised after a thorough screening process or when extremely precise measurements are required. An example of such method is mass spectrometry (MS) detection, which is used to identify and quantify a substance and can also be used to confirm a compound’s molecular structure. MS allows for the confirmation of the composition of the compound and provides its structural information. High-performance liquid chromatography (HPLC) has been widely used for the quantifica-tion of SAs due to its high sensitivity and broad linear range. Currently, the most widely used analytical methods for SAs are based on a reversed-phase HPLC (RP-HPLC) separation. Among these methods, HPLC-MS/MS, which can also be considered to be a confirmatory method, has become the main analytical technique for the identification of SAs due to its higher selectivity
and sensitivity than other instrumental methods. One of the advantages of MS/MS is the fact that complete HPLC separation of the target analytes is not necessary for selective detection. How-ever, it is always advisable to have good chromatographic separation in order to reduce matrix effects that typically result in the suppression or, less frequently, in the enhancement of analyte signals. Therefore, short HPLC columns are generally used, considerably speeding up the anal-ysis. Because MS detection is incompatible with most mobile phases, volatile organic modifiers should be used when HPLC is coupled to MS. In addition to HPLC, ultra-high-performance liq-uid chromatography (UHPLC) has increasingly been used for the rapid separation of SAs. Rapid multi-residue screening of veterinary antibiotics including SAs in food and environmental sam-ples is one of the most promising applications of UHPLC technology. A major drawback of a multi-residue method using HPLC-MS/ MS is the excessive cost of the organic solvents and the HPLC-MS/MS equipment.
A highly selective and sensitive method was developed for the simultaneous detection of twelve SAs in beef and milk by immunoaffinity chromatography purification coupled to UHPLC-MS/MS [10]. The limit of detection (LOD) for the studied SAs ranged from 0.4 to 2.0 mg/L. Shi et al. developed a novel method for the rapid separation and determination of twenty-four SAs in bovine milk by UHPLC-MS/ MS [11]. The samples were treated with acetonitrile followed by homogenization, ultrasound treatment and centrifugation. The analytes were detected by multiple reaction monitoring (MRM) in the positive ion scan mode. Liu et al. have presented a fast and sensitive UHPLC-MS/MS method for the simultaneous quantitative determination of 16 SAs in animal feeds [12].
Capillary electrophoresis (CE) is another good quantitative analytical approach that is mainly used when only small amounts of a sample are available [1]. Some advantages of CE are its high separation efficiency, ability to analyze several samples simultaneously in multicapillary systems, and low consumption of reagents and accessories. Farooq et al. [13] used CE for the separa-tion and detecsepara-tion of sulfonamides such as Sulfamethoxazole (SMZ), sulfamerazine (SMR) and sulfadimethoxine (SDM) in chicken and beef tissue samples.
Another method used for SAs determination are microbiological assays. The microbiological inhibition assays are based on the use of SA-sensitive bacteria as indicators. These assays assess the ability of microbes to reproduce in milk. When growth of these bacteria is suppressed, which is determined directly or indirectly by the metabolic activity of the bacteria, a conclusion is made about the presence of drugs. The presence of the residual substances is determined from inhibition plots of the bacterial growth obtained from an agar-diffusion method that uses cylinders, wells on the agar surface or discs of filter paper. These types of techniques usually meet the require-ments of a screening approach. The microbiological method was used for screening samples of milk for their SA and antibiotic contents before these compounds could be detected by enzyme immunoassay [14] or HPLC [15].
Immunoassays are characterized by high specificity, high sensitivity, simplicity and cost ef-fectiveness, which make them particularly useful for routine uses. These assays are based on a specific reaction between an antibody and an antigen, and they are capable of detecting the low
2.1 Sulfonamide Detection 7
concentration of residues in short amount of time and often do not require difficult extraction or clean-up steps. This is a very promising technique, and large number of papers have been devoted to the detection and identification of SAs using different immuno-methods. Enzyme-linked im-munosorbent assays (ELISA) are the most widely used immunoassays due to their high sample throughput. These methods can drastically reduce the number of analyses required to detect SA contamination in food samples [16].
G.G. Mohamed et al. developed a simple, sensitive and accurate spectrophotometric method for the detection of SMX in different pharmaceutical preparations [17]. The charge-transfer re-actions between SAs as p-electron donors and 7,7,8,8-tetra cyanoquinodimethane, 2,3-dichloro-5,6-dicyano-1,4-benzoquinone and 2,5-dichloro-3,6-dihydroxy-1,4- benzoquinone as p-acceptors result in highly colored complexes. p-Dimethylaminocinnamaldehyde (p-DMACA) has been sug-gested as a spectrophotometric reagent for the detection of SAs [18] and it has been shown that in acetonitrile medium, this reagent participated in a condensation reaction with SMX and SMZ, forming colored products that can be measured spectrophotometrically. This technique can be used as a screening method since it produces a small number of false non-compliant samples, as proven by a confirmatory HPLC method [19].
In general, the reported methods of SA determination can be grouped depending on the type of analytical technique applied. The corresponding percentages are depicted in Figure2.1. As it can be seen, HPLC-MS(/MS) is the most commonly used analytical method (38%), followed by HPLC with other detectors (22%) and electrophoresis (15%).
Figure 2.1: Analytical methods that have usually been applied to the detection of sulfonamides over the past years [1].
The currently proposed analytical approaches for the detection of SAs are mainly based on HPLC–MS or HPLC-MS/MS. Great advances in HPLC-MS/MS have made it a key technique for the determination of not only SAs but also other antibiotic residues [1]. These hybrid approaches have made a great contribution to the analysis of trace organic contaminants, including SAs, and have contributed to the development of multi-analyte techniques for the detection of a wide range of substances in a single analytical run [13]. These methods seem poised to be the most fre-quently used techniques for the purposes of analysis in the future. The main disadvantages of these methods are their complex equipment and excessive costs. This fact currently stimulates a great interest in the development of screening methods based on microbiological, immunoas-says and biosensors, which have the main advantages of low cost, short analysis times and the possibility of in situ use [16].
The clear trend in this field is the miniaturization of the screening systems (chips, microarrays, microtiter plates) as well as their automation. These features will maintain the sustainable progress of these methods in the near future.
2.2
Chromogenic reaction between SAs and p-DMACA
Condensation of primary aromatic amines with aldehydes is widely used in organic synthe-sis (preparation of secondary amines and heterocyclic compounds, protection of aldehyde group, etc) [20] and analytical chemistry (formation of colored Schiff bases) [21]. It is known that mi-cellar media formed by surface-active substances are capable of essentially changing the state of reactants in solution, the rate and mechanism of reactions, and their direction [22]. The catalytic effect of surfactant micelles in the condensation of aldehydes with aliphatic and aromatic amines was the subject of a number of publications. For example, Martinek et al. [23] and Krivova et al. [24] reported on the effect of sodium dodecyl sulfate micelles on the condensation of aromatic amines (aniline, benzidine, p-anisidine) with p-dimethylaminobenzaldehyde. The authors showed that the reaction rate increases due to increase in the reactant concentrations in the micellar pseudo-phase. The influence of salt on the mechanism and equilibrium in the condensation of hydrazine and phenylhydrazine with vanillin [25] and p-dimethylaminobenzaldehyde was also studied [26]. It was found that the apparent rate constants increased by more than 2 orders of magnitude for the reaction with hydrazine and by a factor of 20-30 for phenylhydrazine, which was attributed to increase of the reactant concentrations in the surfactant micelles.
R. K. Chernova et al. examined the effect of surfactant micelles on the condensation of p-dimethylamino cinnamaldehyde with aniline, nitroanilines, aminophenols, toluidines, and amino benzoic acids. The mechanism of condensation of primary aromatic amines with aldehydes was studied in sufficient detail [2]. The condensation includes two steps: the first step is nucleophilic addition of amine at the carbonyl carbon atom to give intermediate -amino alcohol, and the second step is elimination of water with formation of C=N bond (see Figure2.2). The final products are the corresponding colored Schiff bases that vary according to the intensity of the reaction.
2.3 Computer vision-based analytical procedures 9
N. N. Gusakova et al. [3] studied the chromogenic reaction between SAs and p-DMACA based on condensation of these compounds in acidic medium, which results in colored Schiff bases (Figure2.3) and concluded that the analytical effects caused by the anionic surfactants in the p-dimethylamino cinnamic aldehyde–primary aromatic amine systems form a basis for the pro-cedures of the photometric determination of aniline and its derivatives in environmental samples, pharmaceutical formulations and biological fluids. The procedures exhibit low detection limits (fractions of the maximum permissible concentrations) and they are simple and precise.
Figure 2.2: Condensation of p-dimethylaminocinnamaldehyde with aniline, nitroanilines, aminophenols, toluidines, and aminobenzoic acids [2].
Figure 2.3: Schematic representation of DMACA and SAs reaction in acidic medium [3].
2.3
Computer vision-based analytical procedures
Chemical analysis based on color changes recorded with imaging devices is gaining increasing interest due to its several significant advantages, such as simplicity of use, and the fact that it is easily combinable with portable and widely distributed imaging devices, resulting in friendly analytical procedures in many areas that demand out-of-lab applications for in situ and real-time monitoring. These characteristics make them very promising as field screening techniques for point-of-care test, forensic analysis and environmental monitoring [4].
Among the analytical properties, color, as perceived by the observer, has been used in chemical analysis as one of the main organoleptic properties that encodes qualitative and semi-quantitative information for separation and identification of reactions or to indicate the end point in titrations. A large number of tests using both reagents in solution and reagent-impregnated papers or cloths in which a color appears or changes in the presence of an analyte have been proposed since the 18th century and up to the present time (the naked eye test).
These procedures are mainly qualitative, many of them are not very sensitive, influenced by the background lighting and subjective in any case. Moreover, the quantitative or semi-quantitative approaches are usually comparison based, using naked-eye vision or color charts. After the fast de-velopment of instruments and materials in the second half of the 20th century, these chemical tests became limited to a few, although important, specific areas such as urinalysis and immunochro-matographic tests. However, the advent of color detectors and image sensors that duplicate and enhance human vision by electronically perceiving and understanding an image and the coupling of color reactions and processes with image sensors and software, along with the development of new selective chemistries, has opened the door to new strategies and opportunities in analytical chemistry. In the current field of chemical analysis, the use of color as an optical property of matter that contains chemical information and can be objectively measured is mainly connected with two domains: the use of imaging devices as analytical instruments and the development of fast analytical systems to be used in out-of-the-lab applications.
Thanks to the wide distribution and low price of these devices, they are being used as analytical tools instead of spectrophotometers, flame photometers or other equipment, and in diverse areas, including lab teaching and routine analysis. These devices are also used along with sensor systems involving the appearance or disappearance of color or any property that can be measured through a color change, i.e. luminescence, developing complete analytical systems that include chemical recognition and the transduction of the signal and especially consider the processing capacity of some current devices. Likewise, color has been used in a set of sometimes divergent and often overlapping strategies that may include: point-of-care testing [27], lab-on-a-chip [28], paper based devices [29], test express methods [30], or one-shot sensors [5]. Represent in Figure2.4is a typical computer vision-based analytical approach.
Figure 2.4: The computer vision-base analytical chemistry approach [4].
The advent of image sensors and the later explosive development of consumer electronics at the end of the 20th and beginning of the 21st century placed numerous devices with optical de-tection capabilities in the hands of end users. Their characteristics of sensitivity, ubiquity,
afford-2.3 Computer vision-based analytical procedures 11
ability and portability make them attractive as potential analytical tools, combining recognition of the event and signal processing in a single device. Mobile phones and tablets are particularly interesting because of the combination of their connectivity and their ability to take pictures with computational power. This made it possible to develop new concepts that can be included in health information technology and telemedicine and mobile health services through on-site pro-cessing and remote propro-cessing via data transfer to a centralized facility for archiving and analysis, e.g. rapid-diagnostic-test (RDT) for the quantification of immunoassay test strips [31]. Thanks to this rapid development of the technology available, the interest in CVAC has been exponentially growing.
The accumulated index of publications (Figure 2.5) shows that the number of papers pub-lished to date has steadily grown. Therefore, the appearance of imaging devices, combined with the analysis of color properties, has made it possible to objectify color for chemical information purposes.
Figure 2.5: Number of CVAC paper published between 1960 and 2015 [5]
Computer vision refers to the use of devices for optical, non-contact sensing to automatically receive and interpret the image of an object in order to obtain information, control machines and/or process images [32]. It has been widely used to examine, monitor and control a very broad range of applications from scientific, commercial, industrial, and military to biomedical applications. Typically, the images are acquired with a physical image sensor, and computing hardware and software are used to manage and analyze the images with the objective of performing a
prede-fined visual task [33]. The computer vision systems needed for chemical analysis purposes, also known as computer vision-based analytical chemistry (CVAC), can vary but generally consist of a few different basic components: an analytical device that modifies its color characteristics in contact with a sample, an imaging device (digital camera, scanner, webcam, smartphone or other) connected to a computer or microcontroller, an illumination system, and control and processing software. Additionally, the use of portable and widely distributed devices such as smartphones and tablets and their corresponding application software is an attractive factor that may contribute to the spread of the systems.
Digital image processing uses a series of mathematical operations, such as noise reduction, grey level correction and blurring correction, to enhance the quality of the image and remove de-fects. Then an image analysis algorithm selects the regions of interest (ROI), i.e. a membrane that contains the immobilized reaction product or a colored solution after reaction, from the back-ground and extracts the color information from them. The image segmentation process that makes it possible to obtain the ROI containing the chemical information can be done by thresholding, edge-based segmentation or region-based segmentation. From the color information, the analyti-cal parameter is built, and qualitative or quantitative analytianalyti-cal information is extracted by applying single calibration, pattern recognition and/or multivariate analysis.
With these kinds of colorimetric procedures, understood here in a broad sense as those based on color measurement and able to perform chemical identification, classification and/or quanti-tative multi-analyte analysis, the change of color is evaluated as it relates to the magnitude of interest. However, their efficiency primarily depends on the proper choice of recognition chem-istry and the sensing platforms, with the needed analytical elements: membranes, supports, cases, microfluidic devices, and others, which are used to determine the optical properties of the analyte.
2.4
Colorimetry and Color Spaces
The quantification of colors is performed by colorimetry, the science that studies the processes related to color by defining methods that allow the decomposition, analysis, and description of visible light to quantify color information for processing and analysis with several purposes in many scientific and technological fields [34].
Colors can be quantified using a number of different methods or color spaces that specify color from the three primary colors, similar to human color perception. As Helmholtz has stated about the trichromatic theory of color [34], any color can be formed by combining three properly chosen primary colors. Therefore, most of the color spaces use three component representation in order to accurately describe the human vision system.
RGB Color Space
RGB stands for red, green, and blue, which are the three color components used to completely define a color in this additive color space. The RGB color space is the most common color space
2.4 Colorimetry and Color Spaces 13
in capture devices since the human visual system works in a similar way, and, for this reason it is used as the initial color space from which the coordinates of some other spaces are obtained. Most color and image detectors have been conceived and designed to provide information in RGB coordinates. RGB is a device-dependent not globally standardized color space since the response of the device to each red, green, and blue wavelength depends on the manufacturer. For this reason, an RGB tuple can visually represent two different colors in two different devices. Valuable attempts at standardization have been made, such as sRGB and Adobe RGB [35]. However, regardless of their simplicity and direct measurement using electronic image detectors, their high illuminance dependence impedes their use in some high-resolution applications. The RGB color space has been widely used in the quantification of solutions and immobilized substances using digital processing of images and specific software that makes it possible to extract the colorimetric information by selecting the areas of interests in a image [36].
Instead of using the three coordinates separately, it is common in the literature to use a com-bination of the RGB coordinates or define a magnitude called intensity to define the colorimetric contribution of the incident light over the sensing elements of the detector. For example, Park et al. use the total color intensity of a pixel as a variable for oxygen determination. The total color intensity of a pixel was defined as the square root of R2+ G2+ B2.1001[37].
In a work by Meier et al. [38] the simultaneous analysis of pH and pO2 is carried out by capturing one single image and using the R/B ratio as the parameter for oxygen and G/B for pH, using a membrane with three fluorescent dyes with emission peaks matching the three channels of the detector, two for oxygen (R) and pH (G) and a third (B) as a reference.
Martinez et al. [39] also used the R/B ratio to quantify gaseous oxygen using an inkjet-printed RFID tag for monitoring.
XYZ Color Space
In 1931, the International Commission on Illumination (CIE) established the CIE XYZ or CIE 1931 color space, which is defined by two coordinates that define chromaticity, X and Z, and a third one, Y, that defines luminance, also known as tristimulus values. Hence, for a given value of luminance, Y, X and Z describe all the possible chromaticities of the space. XYZ space was designed to comprise all the colors that human visual system is able to see. In the field of colorimetry, it is usually used as an intermediate space to allow transformations between RGB and other color spaces.
The XYZ color space is mainly used in spectrophotometers and digital color analyzers that di-rectly provide the tristimulus values of the light transmitted or reflected by the analyzed samples. Although widely used in chemical analysis, it is not perceptually uniform, which makes it more difficult to compare two colors. There are several works in the literature that use this space as a starting point in analytical systems to obtain other color coordinates by applying linear transfor-mations. For example, Suzuki et al. [40] used this color space to analyze the results obtained by a colorimetric sensor for ions Li(I), NH4(I) and protein determination.
HSV Color Space
The HSV color space is a hue-oriented color space that completely describes a color by means of three different components: hue (H), saturation (S) and value (V). Hue is commonly defined as the dominant wavelength of the spectral radiance of a color. Saturation defines the purity of the color, and, finally, value, which is usually also referred to as brightness, represents the intensity of light present in the described color [41]. HSV values can be easily obtained from the RGB color space transforming this color space into a perceptually uniform space and thus classifying colors purely regarding their relation to how the human eyes perceives them.
This color space has been applied in the last decade in different studies of colorimetric chem-ical analysis. Just as with the CIE XYZ color space, the HSV is not uniform and it is not possible to establish differences between colors in order to compare them. However, the main feature and interest of this color space is the possibility of representing the hue in a single parameter, avoiding the use of redundant information when the color coordinates are used with bitonal or polytonal optical chemical sensors [42]. For users without experience, hue-based spaces provide ease of use against other color spaces. Furthermore, it has been proved that the hue component is more robust to light variations in the illumination, which could affect the measurements [43]. In this respect, Paciornik et al. [44] proposed a study of several color coordinates to model Hg(II) response using spot tests, showing that the hue coordinate has a better linear response to changes in concentration and a larger slope.
2.5 Image Acquisition, processing and analysis 15
CIELAB Color Space
Another commonly used colorspace is CIELAB, defined in 1942 by Richard S. Hunter. Unlike the RGB, CIELab color is designed to approximate human vision. It aspires to perceptual unifor-mity, and its L component closely matches human perception of lightness. Thus, it can be used to make accurate color balance corrections by modifying output curves in the a and b components, or to adjust the lightness contrast using the L component. In the CIELAB color space, the color is described by the coordinates L*, a* and b*. The L* coordinate represents the luminance, while the a* and b* coordinates represent the change of color from red to green and yellow to blue, respectively. By using this space, or a similar space called CIELUV, a uniform perception can be obtained, meaning that a minimum change in the chromaticity coordinates produces an equal change in the visual perception of the color, not like in the color spaces mentioned prior to this, which is extremely valuable since the chromaticity is an objective specification of the quality of a color regardless of its luminance. The main advantage of the uniformity of this space is the possibility of extracting differences between two colors using L*a*b* coordinates by applying the Euclidean distance in order to determine how different they are with respect to each other. Therefore, it is especially useful for differential measurements of colors. However, in order to obtain the L*a*b* coordinates from the RGB color space, an intermediate step using the XYZ space is necessary, making it harder to process this information which requires more consump-tion of resources, i.e. processing power, since it’s not as immediate as other spaces. In analytical chemistry, other color spaces have been used in combination with colorimetric analysis to provide information related to the analyte. As explained above, most of them are derived from the RGB or tristimulus color space (CIE XYZ), which are the most used spaces in image detectors and optical sensors.
In summary, the selection of the working color space in each case depends on multiple factors such as the instrument used, illumination or the color change developed by the optical device, which makes it necessary to study all of them to define which one best fits the model. In general, when the color change occurs in a single color shift (i.e. from clear to a determined final color), the values used are commonly RGB intensities, making it possible to apply histogram and difference map methods to analyze the images. However, if the change occurs between two different colors, as happens with bitonal optical chemical sensors (from red to yellow, purple to blue, etc.), it is common to use other color spaces such as HSV.
2.5
Image Acquisition, processing and analysis
To acquire the picture, several factors have to be taken into account since different approaches can be proposed to capture the image in optical sensor analysis, i.e. the disposition of the system, the light source, sensing element and image device, if the technique is based either on absorption, transmission or reflection. The disposition of the elements and the parameters of the imaging device used have to be considered during the acquisition procedure. Usually, in digital cameras or
smartphones with built-in cameras, a wide range of parameters can be set such as white balance, exposure time, aperture, ISO sensitivity, among others. To avoid using the devices’ automatic settings, it is necessary to establish the optimal working point of the parameters.
One essential part of a computer vision system is the illumination used during the acquisition procedure considering the color dependency on light. Most of the equations in the literature re-lated to color spaces are determined by the use of a specific illuminant as the light source for the color measurements. In some works, a specific illuminant that emits a determined wavelength is required to excite the sensing membrane luminescence or to study the behavior of the samples in controlled light conditions to simplify the equipment processing. Most of the systems developed for colorimetric determination usually reproduce an environment with controlled illumination con-ditions to carry out the acquisition of the measurements to obtain the color information and relate it to the analyte, avoiding ambient light interference. For instance, if commercial digital cameras or phone cameras are used, they are typically held in a fixed position with some types of clamps in an environment of controlled lighting.
2.6
Digital Image Processing
The processing and analysis of the color characteristics enclosed in digital images make it possible to obtain its analytical parameters.
Image processing involves a series of operations to enhance and extract valuable information from the acquired image. When colorimetric analysis is combined with image detectors and in-cluded as part of systems for chemical analysis, it is necessary to process the color components in an external computer, either with public domain image processing programs such as ImageJ, com-mercial graphics editors such as Adobe Photoshop, dedicated software, or customized processing programs (using technical computing platforms such as Matlab, Java, or LabVIEW, for example). Among the different image processing techniques used in computer vision, the most common in CVAC procedures is image segmentation, which aims to extract the ROI containing the an-alytical information from the background. There are different segmentation techniques, such as pixel-based, edge-based and region-based segmentation, the most common is pixel-based segmen-tation and among these the thresholding technique which retains pixels from a certain part of the image with gray-scale level or color intensity, typically in separate and normalized RGB channels, higher than a certain value defined by a threshold fraction. One of the methods used for thresh-olding is Otsu’s method, which assumes that the image contains two classes of pixels following a bi-modal histogram: ROI and background pixels. Usually edge-based segmentation techniques rely on the use of masks, which make it possible to search for sudden changes in a certain image parameter, i.e., a border or edge, through the definition of gradients over this parameter. Thus, different masks, combined with the mathematical operations associated with the mask applica-tion, define the different types of edges to be found. Different border detection methods have been
2.6 Digital Image Processing 17
used in CVAC such as differential detection, Prewitt operators, and Sobel operators. Typically, edge detection is carried out over a grayscale image, by transformation from RGB to gray-scale, although Garcia et al. [45] used the V coordinate of the HSV space, which corresponds to image brightness, in order to reduce the computational needs.
The most common segmentation technique in CVAC is manual selection of the ROI, which is generally circular or square, in such a way that the edge of the area, where coffee-ring effects, reagent or product concentration, or leaching can occur, is not included. To this end, masks are used in the processing of the image. They are usually obtained from the subtraction of the back-ground of the sensor, sensor array or solution, that is, a negative or binary image of the sensor. The same mask can be used for all the images of the same series, thus saving processing time.
Image analysis uses digital data obtained from ROI to extract chemical information: qualitative and/or quantitative mono or multi-analyte information or classification as well as to highlight the chemical features of images. Once the ROI is obtained, the analysis of the color components of the ROI has to be processed. The processing consists of extracting colorimetric information to be related to the analyte. Several analytical colorimetric parameters can be used for this purpose in order to establish a relationship between the analyte and color. Multiple examples for each color space were mentioned according to the chromatic coordinates employed for the quantification of the color information.
One of the most important aspects when comparing the analytical information between sam-ples from the same series is to ensure that the lighting conditions stay constant, otherwise, for the same sample, two different values are obtained, since color is illuminant-dependent. This re-quirement is extremely difficult to satisfy, especially in a situation where we do not have control over it, i.e. natural lighting. The most common solution to this problem, is to implement color correction methods such as white-balance or individual color channel correction using a Macbeth Color Checker (see Figure2.6).
Figure 2.6: Macbeth Color Checker
Between these two methods the most successful is arguably, the individual color channel cor-rection. This method places a color checker in the same image as the analyte and uses the 24 color patches to correct the color channels, estimating the correction factor with a least-square regression algorithm using the obtained values and the known and expected values of the color
checker. Although not as effective as the previous method, white-balancing is still a relevant way to do color correction, since it requires much less processing power and is therefore much faster.
The captured RGB image can sometimes be processed by first converting the information to grayscale. As demonstrated by Murdock et al. [46] when using the same image for both analy-ses (RGB or grayscale), there is less sensitivity and resolution of the system with the latter. In some cases, in colorimetric analysis, there is no simple relationship between color and analytical information, as in the case of classification or identification using colorimetric arrays. In such a case, two main methods are used for the classification and the determination of analytes once the average of the colorimetric information for each spot or sensing element is obtained: prin-cipal component analysis (PCA, converting a set of related data into a set of linear uncorrelated variables) and hierarchical cluster analysis (HCA, finding a hierarchy between different clusters obtained from the data) [47].
An artificial neural network [48] and expert system [49] can also be used to establish a rela-tionship between the sensing array and the analyte. Sometimes such a complex analysis of the information is not necessary and a relation between the used color component and the concentra-tion of the analyte is directly settled. Normally, the average value for each color channel is used as the representative value of the specific channel. However, if any heterogeneity exists in the surface to process, the mean value can be altered by unwanted regions of the picture where the chemical membrane is not homogeneous. For this reason, some works have included the statistical mode as analytical parameter [50].
2.7
Summary
The increasing number of consumer electronic devices available on the market has lead to faster development of analytical methods based on imaging devices. The first applications to do chemical analysis appeared in the early 21st century and started with the use of scanners and, to a lesser extent, the use of CCD cameras and webcams. However, from the scanned image it is necessary to obtain color information from ROI and perform calculations to extract the analytical data. Hence, the emergence of cell phones and, later, smartphones and their processing capability, along with their ubiquity and affordable price due to mass production, has enabled an exponential development of CVAC procedures.
Chapter 3
Digital Image Colorimetry for SA
Determination
In this chapter, the materials, methods and procedures used to create a digital image colorime-try system for determining the SA concentration in a given sample are presented. It starts by describing the chemical reaction used to create the colored product that the system is going to analyze. The sample extraction procedure and the image database acquisition protocol are also explained here. Following that, the algorithms used to process the images and the metrics used to evaluate them are described in detail. Finally, this chapter ends with a brief summary.
3.1
Chemical Reaction
The chemical reaction between sulfonamides and p-DMACA in a micellar medium is an im-portant, if not the most important step of all those about to be described in this chapter, since it is the starting point for the work presented in this thesis. DMACA, an aromatic aldehyde, has been applied as a reagent for spectrophotometric determination of primary aromatic amines, including SAs [51–54]. This reaction is based on the condensation of DMACA and SAs resulting on the formation of a colored product, which is a Schiff base, in acidic medium (see Figure 3.1). The intensity of this colorimetric reaction is proportional to the SAs concentration.
Using colorimetric analysis, this colored product can be analyzed and a relationship between the intensity of the reaction and the intensity of the color can be established and studied.
Figure 3.1: Schematic of colorimetric reaction between p-dimethylaminocinnamaldehyde (DMACA) and sulfonamides (SAs).
3.2
Materials and Methods
Analytical grade sulfamethoxazole (SMZ) was purchased from Sigma Aldrich (St Louis, MO, USA). Methanol, chloroform and water from arium water purification systems (resistivity > 18 M cm, Sartorius, Goettingen, Germany) was used for the preparation of solutions. Stock solution of SMZ 250 mg L-1 was prepared by dissolution of accurately weighed mass in methanol. Inter-mediate solution of SMZ 1.00 mg L-1was prepared by dilution of stock solution in sulfuric acid 0.005 M. Stock solution of p-dimethylaminocinnamaldehyde (DMACA) 0.44 g L-1was prepared by dissolving 11 mg in 3.5 mL of 0.6 M HCl solution and by completing the volume up to 25 mL with methanol. DMACA working solution (0.22 g L-1) was prepared by dilution of DMACA stock solution in chloroform (1:1, v/v). SMZ working solutions in the concentration range of 5-150 µg L-1were prepared in quadruplicate by dilution of appropriate volumes of intermediate solution of SMZ 1 mg L-1sulfuric acid 0.005 M.
3.3
Extraction Procedure
For the extraction procedure of SMZ, the mixed-mode ion exchange polystyrene divinylben-zene sulfonated (SDB-RPS) disk from EmporeTM (Bellefonte, PA, USA) was cut (13 mm diam-eter) and placed inside a polypropylene disk holder, (Swinnex filter holder, SX0001300, EMDR
Millipore Corporation, Billerica, MA). Four units were attached in parallel to propulsion tubes (Tygon , 1.02 mm i.d.) fitted in a peristaltic pump (Gilson Minipuls 2, Villiers-le-Bel, France).R
Standards and samples (10 mL) were loaded at 0.8 mL min-1. Then, disks were dried by pro-pelling air through them at 2.0 mL min-1during 6 min. After each set of four parallel extractions,
3.4 Database Acquisition Protocol 21
the pump tubes were washed with c.a. 5 mL of ultrapure water. Please see Figure 3.2 for a schematic representation of extraction and color evaluation procedure.
Figure 3.2: Schematic view of extraction procedure and colorimetric analysis of sulfamethoxazole.
3.4
Database Acquisition Protocol
For the acquisition of the image database, three different smartphones were used: Huawei P9 Lite, Vodafone Smart Ultra 6 and Vodafone Smart Mini (Figure3.3). The specifications for each of these smartphones are described in Table3.1.
(a) Huawei P9 Lite [55] (b) Vodafone Smart Ultra 6 [56] (c) Vodafone Smart Mini [57]
Table 3.1: Smartphone specifications. Characteristic Huawei P9 Lite
(Camera 1) Vodafone Smart Mini (Camera 2) Vodafone Smart Ultra 6 (Camera 3)
Operative System Android OS, v6.0 (Marshmallow) Android OS, v4.1 (Jelly Bean) Android OS, v5.1.1 (Lollipop) CPU Octa-core (4x2.0 GHz Cortex-A53 + 4x1.7 GHz Cortex-A53) 1.0 GHz Cortex-A9 Octa-core (4x1.5 GHz Cortex-A53 + 4x1.0 GHz Cortex-A53) GPU Mali-T830MP2 PowerVR SGX531 Adreno 405 Primary Camera (back) 13 megapixels, f/2.0, autofocus, LED flash 2 megapixels, NO flash 13 megapixels, aut-ofocus, LED flash Secondary Camera
(front)
8 megapixels, f/2.0 None 5 megapixels, NO flash
As seen in Table3.1, the camera resolution is not the same for all the tested smartphones. This was done on purpose, because using three different image resolutions in the database acquisition process could help in the creation a more robust image processing algorithm.
The smartphones were placed on top of a homemade support (Figure3.4) that guaranteed that the images were captured from a constant distance (21 cm) from the working bench. For this step, the acquisitions were performed under common uncontrolled artificial lighting. This was decided, because the proposed final product is an Android application capable of fast in-situ analysis where the scene illumination cannot always be controlled.
Figure 3.4: Support used for the databse acquisition
In order to eliminate illumination-based variance in the acquisitions, an unofficial high quality print of the 24-patch color rendition chart (x-Rite color rendition Chart ) was used (FigureR 3.5).
This color rendition chart is the industry standard for color correction in digital images and camera sensor calibration.
3.4 Database Acquisition Protocol 23
Figure 3.5: X-Rite color rendition Chart R
Each of the color patches in this color rendition chart has a unique color value. By using optimization algorithms and ground truth values for each color patch, it is possible to normalize the acquisition images in order to obtain color constancy throughout. This color rendition chart was placed in the working bench next to extracted disks over a white A4 sheet of paper.
The image acquisition was initiated 90s after the addition of a 10 µL of DMACA 0.22g L-1 solution to the disk surface. The waiting time will be later validated by a color stability test. The sequence of the image acquisition was kept constant: camera 1 (Huawei P9 Lite), camera 2 (Vodafone Smart Mini) and camera 3 (Vodafone Smart Ultra 6). For each of these cameras the images were acquired in duplicates. An example of an image from the database is shown in Figure 3.6.
Figure 3.6: Example of an image from the acquisitions database
In this work, two different image databases were acquired. The first set of images was acquired in December 6, 2016 and was intended to be used in the development of the image processing algorithms and to establish a relation between color and concentration of SMZ. The second set of images was acquired in February 21, 2017, and was intended to validate the previous results.
The correspondence between each individual image in the database and the SA concentrations was made through the use of timestamps.
The SMZ concentration values used for both of these databases acquisitions are shown in Table 3.2.
Table 3.2: SMZ concentrations used in the database acquisition SMZ Standard Concentration [µgL-1] SMZ standard volume [mL] SMZ concentra-tion [µgL-1] Sample volume [mL] Blank 0 0.0 10 1000 0.025 2.5 10 1000 0.050 5.0 10 1000 0.075 7.5 10 1000 0.100 10.0 10 1000 0.125 12.5 10 1000 0.150 15.0 10 1000 0.175 17.5 10 1000 0.200 20.0 10 1000 0.225 22.5 10 1000 0.250 25.0 10 1000 0.300 30.0 10 1000 0.400 40.0 10 1000 0.500 50.0 10 1000 0.800 80.0 10 1000 1.000 100.0 10 1000 1.500 150.0 10
3.5
Image Processing and Analysis
Image processing consists in the processing of images using mathematical operations by using any form of signal processing for which the input is an image, a series of images, or a video, such as a photograph or video frame and the output of these operations may be either an image or a set of characteristics or parameters related to the image [58]. In this work, this framework is divided into two big sections: image segmentation and color correction. In computer vision, image segmentation is the process of partitioning a digital image into multiple segments with the goal of simplifying and/or changing the representation of an image into something more mean-ingful and easier to analyze [59,60]. This is accomplished by assigning a label to every pixel in an image so that pixels with the same label share certain characteristics. For the colorimetric de-termination proposed, there are 2 key objects that should be isolated from the original image: the colored product of the chemical reaction in the polypropylene disk and the color rendition chart, including each of its 24 color patches. Segmenting the colored product in the disk will facilitate the extraction of the colorimetric data that will later be analyzed. Isolating the color patches in the color rendition chart is crucial since this will make it possible to extract the information needed to
3.5 Image Processing and Analysis 25
color correct the images and guarantee color constancy throughout them. All the work pertaining to image processing was done on the MATLAB R2017a software.
3.5.1 Sample Segmentation
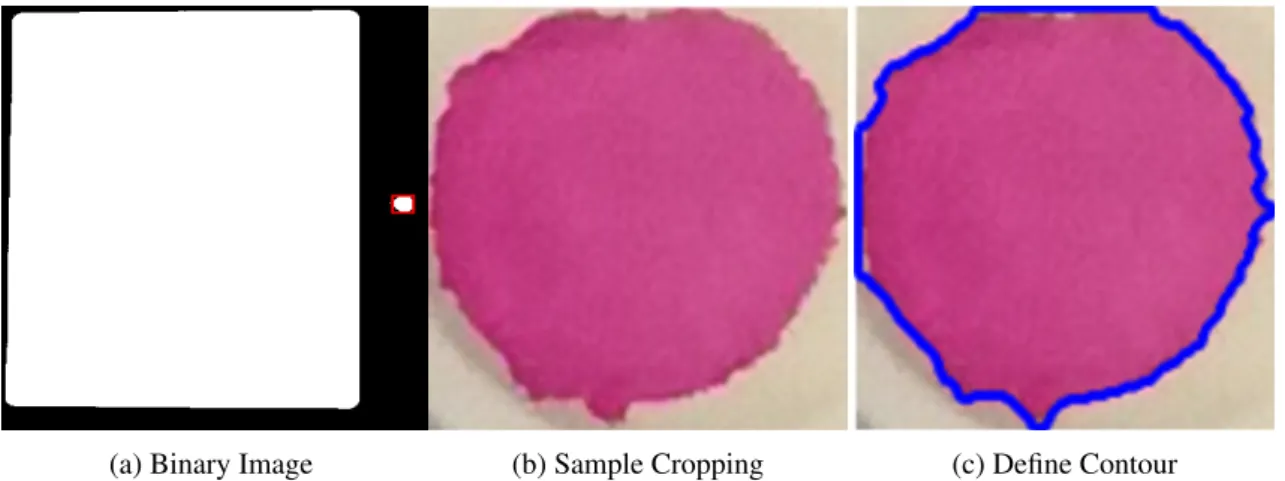
After carefully analyzing the images from the database, a simple method for the segmentation of the sample was developed. As shown in the example-image (Figure3.6) the part of the image we want to isolate is a circular spot, that is darker than its surrounding pixels. With that being said, an image processing technique known as image thresholding was used. Image thresholding is one of the simplest method used in image segmentation. It converts a grayscale image into a binary image. This is accomplished by replacing each pixel in an image with a white pixel if the image intensity is greater than a fixed constant, known as the threshold, or a black pixel is the intensity is lower [59]. There are a variety of methods that can be used to define the value of this threshold. Among them, the most commonly used one is the Otsu’s Method, named after Nobuyuki Otsu. This algorithm assumes that an image contains two classes of pixels (foreground and background pixels), it then calculates the optimum threshold separating the two classes [61].
Going back to Figure3.6, it can be safely assumed that these two classes are easily identifiable and therefore easy to separate. It was established that the white sheet of paper is the background, while all the remaining objects in the image make up the foreground. For this reason, the Otsu’s Method was the approach chosen to calculate the threshold value. After converting the original image into a grayscale image, this newly calculated threshold can be used to convert the image into a binary image (black and white). From here we need to apply some image processing mor-phological operations such as image opening and closing, image dilation and erosion in order to remove some leftover undesirable objects. The last step in this segmentation algorithm is correctly identifying the foreground objects. If everything goes according to plan there should only be two foreground objects: the color rendition chart and the sample. Since the color chart is a large rect-angular object and the sample is smaller and circular, labelling these objects should be easy. Once the desired target has been found, a mask is created to crop out our region-of-interest (ROI) from the original RGB image and extract its color information. The pipeline for this algorithm is shown in Figure3.7.
Figure 3.7: Sample segmentation algorithm pipeline
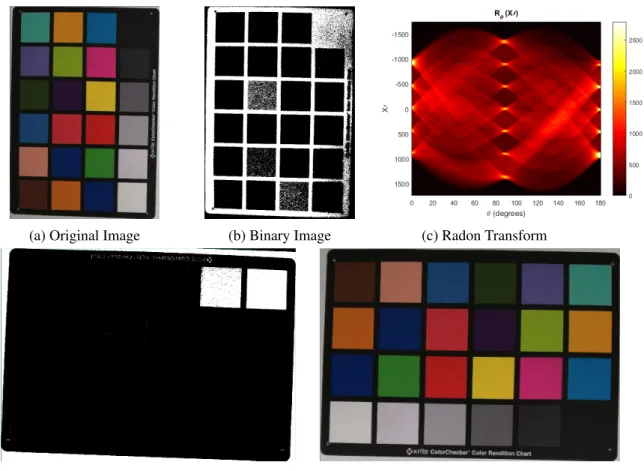
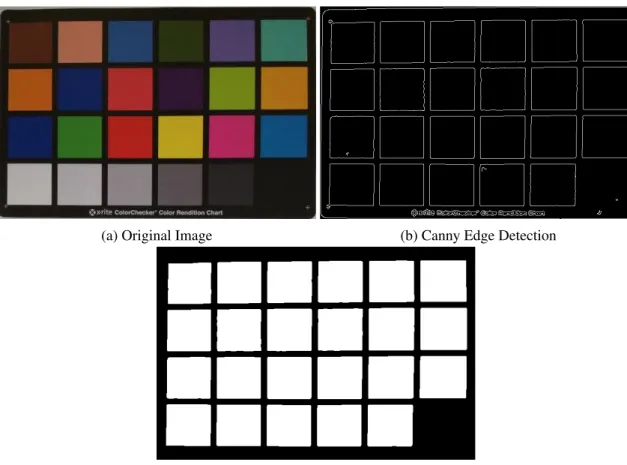
3.5.2 Color Checker Segmentation
This algorithm is very similar to the one described above in section 3.5.1, with the only dif-ference appearing in the final step. Instead of creating a mask from the small circular object, the
![Figure 2.1: Analytical methods that have usually been applied to the detection of sulfonamides over the past years [1].](https://thumb-eu.123doks.com/thumbv2/123dok_br/15761721.1074894/25.892.217.722.654.1072/figure-analytical-methods-usually-applied-detection-sulfonamides-years.webp)
![Figure 2.3: Schematic representation of DMACA and SAs reaction in acidic medium [3].](https://thumb-eu.123doks.com/thumbv2/123dok_br/15761721.1074894/27.892.173.758.581.840/figure-schematic-representation-dmaca-sas-reaction-acidic-medium.webp)
![Figure 2.5: Number of CVAC paper published between 1960 and 2015 [5]](https://thumb-eu.123doks.com/thumbv2/123dok_br/15761721.1074894/29.892.170.832.502.931/figure-number-cvac-paper-published.webp)


![Table 3.2: SMZ concentrations used in the database acquisition SMZ Standard Concentration [µ gL -1 ] SMZ standardvolume [mL] SMZ concentra-tion [µgL-1] Sample volume[mL] Blank 0 0.0 10 1000 0.025 2.5 10 1000 0.050 5.0 10 1000 0.075 7.5 10 1000 0.100 10.0 1](https://thumb-eu.123doks.com/thumbv2/123dok_br/15761721.1074894/42.892.133.718.284.698/concentrations-database-acquisition-standard-concentration-standardvolume-concentra-sample.webp)
![Table 3.3: SMZ concentrations used in color stability test SMZ Standard Concentration [µ g L -1 ] SMZ standardvolume [mL] SMZ concentra-tion [µg L-1] Sample volume[mL] 1000 0.050 5.0 10 1000 0.100 10.0 10 1000 0.250 25.0 10 1000 0.500 50.0 10 3.8 Evaluatio](https://thumb-eu.123doks.com/thumbv2/123dok_br/15761721.1074894/49.892.171.762.179.328/concentrations-stability-standard-concentration-standardvolume-concentra-sample-evaluatio.webp)