9 9 9 9 9 Mem Inst Oswaldo Cruz, Rio de Janeiro, Vol. 101(Suppl. II): 9-13, 2006
Challenges of phylogenetic analyses of aDNA sequences
Katharina Dittmar/
+, Sheila Mendonça de Souza*, Adauto Araújo*
Department of Integrative Biology, Brigham Young University, Provo, Utah, US *Departamento de Endemias Samuel Pessoa, Escola Nacional de Saúde Publica Sergio Arouca-Fiocruz, Rio de Janeiro, RJ, Brasil
One of the crucial steps of authentication of aDNA sequences is phylogenetic consistency. Amplified sequences should fit into the phylogenetic framework of their supposed origin. An inherent property of aDNA sequences however, is their short sequence length. Additionally, genes for aDNA studies are often chosen by their preservation potential rather than by phylogenetically informative content. This poses potential challenges regarding their analyses, and might result in an inaccurate reflection of the supposed phylogenetic history of the sequence or organism under study. In this paper some fundamental problems of phylogenetic analysis and interpretation of aDNA datasets are discussed. Suggestions for character sampling and treatment of missing data are made. The publication is the result of a talk from the 1st PAMINSA Meeting in Rio de Janeiro, July 2005.
Key words: phylogenetics - methods - informative characters - missing data - aDNA
Phylogenies are central to addressing interesting evo-lutionary questions in aDNA research (Austin et al. 1997a,b , Hofreiter et al. 2001). Just as in a regular analysis with extant data however, conclusions depend on the han-dling and analysis of the data. Therefore, an increased effort should be spent on conducting thorough analyses. While numerous protocols regarding stringent aDNA labo-ratory techniques, such as extraction, amplification and sequencing exist (Handt et al. 1994, Austin et al. 1997b, Cooper & Poinar 2000, Hofreiter et al. 2001) limited atten-tion has been paid to the analytical challenges arising from an aDNA dataset.
Ancient DNA is in general physically and chemically damaged (Handt et al. 1996, Poinar et al. 1996, Poinar & Stankiewicz 1999), which results in the fragmented nature of its sequences. Typically, no large sequences can be obtained, and many characters cannot be sampled. Addi-tionally, only multicopy genes tend to survive in ancient material (Hofreiter et al. 2001). Out of this knowledge, the majority of aDNA sequences have been retrieved from the mitochondrial genome, or from other multicopy genes such as nuclear ribosomal genes (Greenwood et al. 1999, Cooper et al. 2001, Dittmar et al. 2003). Therefore, preser-vation issues severely limit the available phylogenetically informative character space of aDNA.
Because there is little recourse to avoid incomplete taxa in aDNA research, a higher emphasis should be placed on the initial character sampling. This should be guided by a priori knowledge obtained from a thorough analysis of extant taxa. In the following text we will introduce some ideas how to use extant sequences in aDNA sequence
+Corresponding author and present address: University of
Wyo-ming, College of Agriculture, Department of Molecular Biol-ogy, 1000 University Ave., Laramie, Wyoming, 82071, US. E-mail: [email protected]
Received 20 July 2006 Accepted 16 October 2006
sampling. We also briefly test and discuss recent devel-opments in missing data research.
Choosing the right genes/gene region
The essential problem for the aDNA researcher is that the potential character sampling space is limited from the beginning. DNA damage starts to occur immediately af-ter cell death, and is only to increase in the course of time. In the majority of all cases no DNA is preserved, and only under special circumstances (e.g. permafrost), detectable amounts of DNA, albeit highly fragmented, survive. Very often, this DNA is from multicopy ribosomal and mito-chondrial genes, which supposedly have a higher chance of survival because of their larger number of copies per cell. Due to the workings of hydrolytic and oxidative dam-age, the expected sequence length for aDNA does cer-tainly not exceed 500 bps, and most sequences rather range between 150 to 300 bps (Hofreiter et al. 2001). From these multiple, randomly broken pieces only a minuscule amount is sampled. The generation of larger contiguous DNA se-quences has been successfully attempted, but samples came from subfossil material [1000-1500 years old] (Coo-per et al. 2001). Usually, aDNA researchers are satisfied with the completion of one single short sequence, which is then used in a phylogenetic analysis to confirm “phy-logenetic consistency” (Austin et al. 1997b) and to infer phylogenetic history. Chances are, however, that the se-quenced piece contains only a limited number of phylo-genetically informative characters, if any at all. It is well known that certain genes, depending on their level of se-quence divergence, may reflect relationships on different ordinal levels. However, each gene may also contain re-gions of rapid or unconstrained evolution, leading to satu-ration, and consequently to what phylogeneticists refer to as random signal or “noise”. If the sequenced aDNA pieces were to be composed entirely of random signal, an inaccurate or conflicting (relative to other datasets) re-flection of the “true” phylogenetic history of that se-quence will result.
1 0 1 0 1 0 1 0
1 0 Phylogenetic analysis of aDNA • Katharina Dittmar et al.
the outset of their analyses. Rather than randomly se-quencing pieces of aDNA, and “hoping for the best”, researchers can actually make use of extant data to ex-plore character congruence or informational content.
In order to reconstruct the phylogenetic history of an organism on a molecular level, multiple sources of charac-ter information are available in the form of different genes. Today it is widely accepted that phylogenies should be reconstructed with all available information in a combined analysis, because it provides the greatest possible ex-planatory power (Nixon & Carpenter 1996, Wiens 1998, Pickett et al. 2005). Additionally, combined datasets have been shown to reveal hidden support even for relation-ships in conflict among analyses of individual markers (Gatesy et al. 1999). Therefore, in an aDNA study, the sampling of different genes (e.g. mitochondrial and nuclear) should at least be attempted. For instance, chances are, that if mitochondrial cytB sequences can be obtained, then fragments of all other mitochondrial genes also survived.
Phylogenetically informative characters are distributed throughout the entire gene sequence. This distribution is not random, since functional and structural constraints on different parts of the gene selectively govern the evo-lution of different regions within a gene. Thus, this mechanism also accounts for the fact that most genes contain both more conservative and more variable regions, which might either be informative on different ordinal lev-els, or not informative at all. Therefore, an exploration of extant homologous sequences could identify potentially problematic regions, which then could be excluded a priori
from the aDNA study. Or, in other words, potentially formative regions could be identified, and selectively in-cluded into the analysis. Several methods to analyze the quality of a dataset concerning information content or character incongruence have been proposed in the past.
One approach was introduced by Lyons-Weiler et al. (1996) in form of the program RASA (relative apparent Syna-pomorphy analysis). This method tests (under the assumption of an hierarchical structured dataset) if the proportion between potential synapomorphies and po-tential informative similarity for any two taxa increases above the expected by chance alone. While this method has been used by several researchers, Simmons et al. (2002) tested a number of hypothetical and empirical datasets with strong phylogenetic signal under these cri-teria, and reported a failure to detect phylogenetic sig-nal for both matrices. Another approach is a compari-son of the homogeneity of signal in different genes through a series of partition homogeneity tests (PHT) (Farris et al. 1994, Swof-ford 2002). The PHT, also known as incongruence length difference test (ILD, Farris et al. 1994) examines the relationship between incon-gruence and phylogenetic accuracy. This test distin-guished between cases in which combining the data gen-erally improved phylogenetic accuracy (P > 0.01) and cases in which accuracy of the combined data suffered relative to the individual partitions (P < 0.001). Applied to an extant gene, divided into defined sub-regions, po-tentially incongruent and congruent sub-regions could be defined a priori, and aDNA sequencing could be ad-justed accordingly. As a caveat however, it has been shown, that noise itself can generate highly significant results in the ILD test (Dolphin et al. 2000). Addition-ally, Dowton and Austin (2002) showed that the ILD test is unlikely to be an effective measure of congruence when two datasets differ markedly in size.
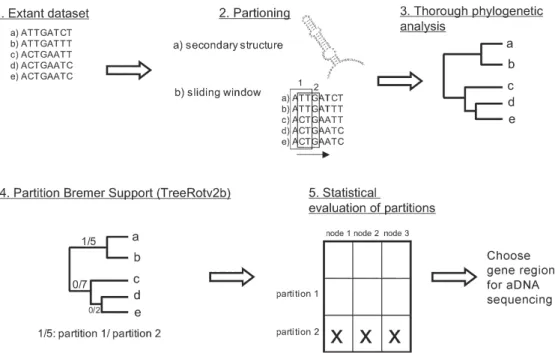
In order to test the phylogenetic utility of potentially available aDNA characters, we propose an approach that uses extant sequences, and is rooted in the comparison of partitioned Bremer support (PBS) values (Bremer 1995, Lambkin et al. 2002). Usually, PBS has been used to
1 1 1 11 1 1 1 1 1 Mem Inst Oswaldo Cruz, Rio de Janeiro, Vol. 101(Suppl. II), 2006
pare the phylogenetic utility of different genes in a com-bined analysis, and to assess localized character incon-gruence (DeSalle & Brower 1997, Gatesy et al. 1999). We however want to extend the application of PBS to an
a priori assessment tool, identifying particular regions of good character support within a gene. In a similar way, PBS has been applied to mitochondrial genome data (Cameron et al. 2004). The idea is to calculate PBS values for particular predefined regions within a gene, based on an alignment of extant sequences (Fig. 1). The most obvi-ous ways to partition single genes in a replicable manner is by codon positions, and secondary or domain struc-ture. Since we aim to choose topologically sequential characters for sequencing (one cannot sequence every second nucleotide for 150 consecutive base pairs) only the latter two options apply to aDNA. Another way of replicable partitioning is to apply a sliding window (Fig. 1), thus portioning the data into n subsets of a particular length (e.g. 150 bps), which then could be subjected to a PBS analysis (TreeRot v2b, Sorenson 1999). One of the criticisms of PBS is that values are not comparable across analyses, because they are dependent on the specific dataset they were computed for. For instance a Bremer Support value of 5 might be high for a particular dataset, but low for another. However, since we use it as a com-parative metric within a dataset, PBS is perfectly suitable for the selection of approximate gene regions that con-tribute more support than others.
The problem with missing data
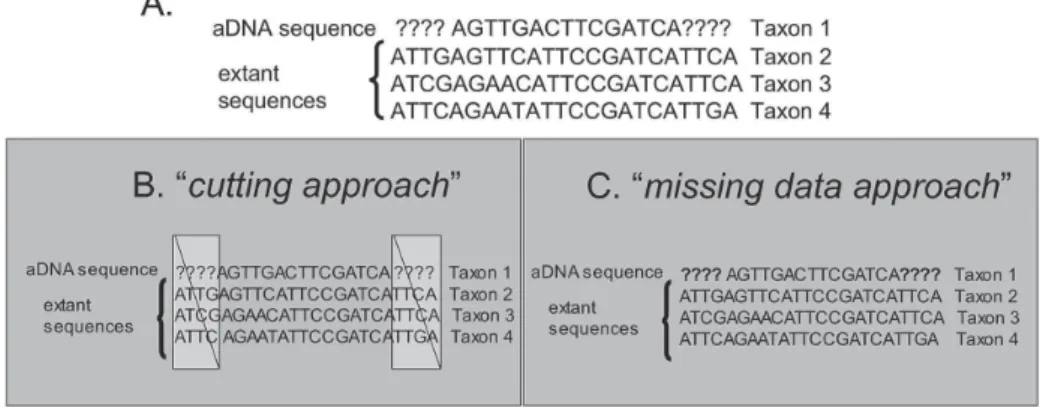
In order to place aDNA sequences in a phylogenetic context, an alignment with extant sequences is necessary. By their very nature, extant sequences tend to be much larger in size. In a sequence alignment the unsampled aDNA characters would be coded as missing, and the sequence would be incomplete (Fig. 2A). Numerous em-pirical and theoretical studies have shown that the inclu-sion of highly incomplete taxa (> 50% missing data) makes it difficult to place these on the overall topology (Huelsenbeck 1991, Nixon and Wheeler 1992, Anderson 2001). As a result, tree topologies or parts of the tree will most likely be unresolved. Potentially, highly incomplete taxa (e.g. aDNA) also influence phylogenetic inferences on the more complete taxa (e.g. extant taxa).
Fig. 2: example depicting missing data in aDNA analysis. Missing characters are coded in form of a questionmark.
The most common way to deal with a majority of missing data values for one taxon would be its elimina-tion from the analysis. This is of course not feasible in this particular case, because it would defy the very pur-pose of aDNA work. Another option would be the se-lective inclusion of alignment sections with complete data across all taxa (Fig. 2B, cutting approach). This however, would lead to extremely short alignments, since the regular aDNA sequence amounts to roughly 150 to 500 bp length. In the past decade however, several re-searchers challenged the common notion of inherent difficulty of incomplete taxa, and suggested that there is not necessarily a direct relationship between the degree of incompleteness and the resulting phylogenetic place-ment of a taxon (Wiens 2003, 2005, Philippe et al. 2004). In fact, recent computer simulations clearly showed that an accurate placement of highly incomplete taxa is pos-sible provided a sufficient number of overall characters are present (Wiens 2003, 2005). This would result in the complete inclusion of the highly incomplete taxa (Fig. 2C, missing data approach).
We used a sample dataset of complete 18S rDNA (1866 bp) to test the two approaches under a simple ab-solute congruence scenario. Five ingroup (Hy-menoptera) and two outgroup taxa (Ephemeroptera) were included in the analysis. First, the complete dataset was analyzed under exhaustive searches under both maximum parsimony and maximum likelihood (PAUP*, Swofford 2002). Nonparametric bootstrap values (1000/100 boot-strap replicates, 100/10 heuristic random addition rep-licates, heuristic search) were calculated using PAUP* 4.0b10 (Swofford 2002). Both analyses converged on the same topologies (Fig. 3).
com-1 2 1 2 1 2 1 2
1 2 Phylogenetic analysis of aDNA • Katharina Dittmar et al.
ducted with the maximum number of extant characters possible, and the trimming of the dataset to exclude miss-ing characters should be avoided.
Conclusions
Before setting out to obtain aDNA sequences that are to be used to answer specific questions related to the phylogenetic history of that particular taxon, research-ers should keep the following in mind: (1) inherently, aDNA sequences will always contain high amounts of missing data; (2) combined analyses of different genes have been shown to provide greater explanatory power. Therefore, multiple genes should be targeted for an aDNA analysis; (3) exploratory analysis of available ex-tant taxa can provide a priori clues as to which gene regions to sequence; (4) generally, alignments contain-ing aDNA sequences should not be cut as to avoid miss-ing data, but should be included into a substantial dataset of extant sequences with un-obtainable characters coded as missing.
REFERENCES
Anderson JS 2001. The phylogenetic trunk: maximal includion of taxa with missing data in an analysis of the Lepospondyli (Vetrebrata, Tetrapoda). Syst Biol 50: 170-193.
Austin JJ, Ross AJ, Smith AB, Fortey RA, Thomas RH 1997b. Problems of reproducibility - Does geologically ancient DNA survive in amber-preserved insects? Proc Roy Soc Lond (B Biol Sci) 264: 467-474.
Austin JJ, Smith AB, Thomas RH 1997a. Palaeontology in a molecular world: the search for authentic ancient DNA. TREE 12: 303-306.
Bremer K 1995. Branch support and tree stability. Cladistics 10: 295-304.
Cameron S, Miller K, D’Haese C, Whiting MF, Barker S 2004. Mitochondrial genome data alone are not enough to unam-biguously resolve the relationships of Enthognatha, In-secta and Crustacea sensu lato (Arthropoda). Cladistics 20: 534-557.
TABLE
Results of the comparison of the topologies of 150 bp pieces (highly incomplete taxa) of 18S rDNA under different alignment approaches to the complete 18S rDNA topology. Grey shaded areas denote times the exact same topology as with the complete
dataset was recovered. Cells marked with “x” show times the P value was significant in the Shimodaira Hasegawa test
Maximum parsimony Maximum likelihood
Taxa 150 bp cuts cutting approach missing data approach cutting approach missing data approach
Taxon 1 cut1 x x
cut2 x
Taxon 2 cut1 x x x
cut2 x x
Taxon 3 cut1 x x
cut2 x
Taxon 4 cut1 x x
cut2 x x x
Taxon 5 cut1 x
cut2 x x x
Fig. 3: maximum parsimony topology (single tree, treelength: 424, CI: 0.89, RI: 0.74) obtained from the complete 18SrDNA dataset under exhaustive searches. Numbers above the branches corre-spond to non parametric bootstrap values.
plete dataset. The SH test was performed with 10,000 replicates, resampling the partial likelihoods for each site (RELL model) using PAUP*.
con-1 3 1 31 3 1 3 1 3 Mem Inst Oswaldo Cruz, Rio de Janeiro, Vol. 101(Suppl. II), 2006
Cooper A, Poinar H 2000. Do it right or not at all. Science 289: 530-531.
Cooper A, Lalueza-Fox C, Anderson S, Rambaut A, Austin J, Ward R 2001. Complete mitochondrial genome sequences of two extinct moas clarify ratite evolution. Nature 409: 704-707.
DeSalle R, Brower AWZ 1997. Process partitions, congruence and the independence of characters: inferring relationships among closely related hawaiian Drosophila from multiple gene regions. Syst Biol 46: 751-764.
Dittmar K, Mamat U, Whiting M, Goldmann T, Reinhard K, Guillen S 2003. Techniques of aDNA studies on prehispanic ectoparasites (Pulex sp., Pulicidae, Siphonaptera) from ani-mal mummies of the Chiribaya Culture, Southern Peru. Mem Inst Oswaldo Cruz 98 (Suppl. I): 53-58.
Dolphin K, Belshaw R, Orme CDL, Quicke DLJ 2000. Noise and incongruence: interpreting results of the incongruence length difference test. Mol Phylogenet Evol 17: 401-406.
Dowton M, Austin AD 2002. Increased congruence does not necessarily indicate increased phylogenetic accuracy – The behavior of the incongruence length difference test in mixed-model analyses. Syst Biol 51: 19-31.
Farris JS, Kallersjo M, Kluge AM, Bult C 1994. Testing signifi-cance of incongruence. Cladistics 10: 3 15-319.
Gatesy J, O’Grady P, Baker RH 1999. Corroboration among data sets in simultaneous analysis: hidden support for phy-logenetic relationships among higher level artiodactyl taxa. Cladistics 15: 271-314.
Greenwood A, Capelli C, Possnert G, Pääbo S 1999. Nuclear aDNA sequences from late pleistocene megafauna. Mol Biol Evol 16: 1466-1473.
Handt O, Hoss M, Krings M, Pääbo S 1994. Ancient DNA: methodological challenges. Experientia 50: 524-529.
Handt O, Krings M, Ward RH, Pääbo S 1996. The retrieval of ancient human DNA sequences. Am J Hum Genet 59: 368-376.
Hofreiter M, Serre D, Poinar H, Kuch M, Pääbo S 2001. An-cient DNA. Nat Rev Genet2: 353-359.
Huelsenbeck JP 1991. When are fossils better than extant taxa in Phylogenetic analysis? Syst Zool 40: 458-469.
Lambkin CL, Lee MSY, Winterton SL, Yeates DK 2002. Parti-tioned Bremer support and multiple trees. Cladistics 18: 436-444.
Lyons-Weiler J, Hoelzer GA, Tausch RJ 1996. Relative apparent synapomorphy analysis (RASA). I: The statistical measure-ment of phylogenetic signal. Mol Biol Evol 13: 749-757.
Nixon K, Carpenter JM 1996. On simultaneous analysis. Cla-distics 12: 221.
Nixon K, Wheeler QD 1992. Extinction and the origin of spe-cies. In MJ Nowaczek, QD Wheeler (eds), Extinction and Phylogeny, Columbia University Press, New York, p. 119-143.
Pickett KM, Tolman GL, Wheeler WC, Wenzel JC 2005. Parsi-mony overcomes statistical inconsistency with the addi-tion of more data from the same gene. Cladistics 21: 438-445.
Poinar HN, Stankiewicz BA 1999. Protein preservation and DNA retrieval from ancient tissues. Proc Nat Acad Sci USA 96: 8426-8431.
Poinar HN, Hoss M, Bada JL, Pääbo S 1996. Amino acid race-mization and the preservation of ancient DNA. Science 272: 864-866.
Philippe H, Snell EA, Bapteste E, Lopez P, Holland PWH, Casane D 2004. Phylogenomics of eukaryotes: impact of missing data on large alignments. Mol Biol Evol 21:1740-1752.
Shimodaira H, Hashegawa M 1999. Multiple comparisons of log-likelihoods with applications to phylogenetic inference. Mol Biol Evol 16: 1114-1116.
Simmons MP, Randle CP, Freudenstein JV, Wenzel JW 2002. Limitations of relative apparent synapomorphy analysis (RASA) for measuring phylogenetic signal. Mol Biol Evol 19: 14-23.
Sorenson MD 1999. TreeRot, version 2, Boston University, Boston.
Swofford DL 2002. PAUP*: Phylogenetic Analysis Using Par-simony (* and other methods), version 4.0b8. Sinauer As-sociates, Sunderland, Massachussetts.
Wiens JJ 1998. Combining datasets with different phyloge-netic histories. Syst Biol 47: 568-581.
Wiens JJ 2003. Missing data, incomplete taxa, and phyloge-netic accuracy. Syst Biol 52: 528-538.