Universidade Federal de Minas Gerais
Instituto de Ciˆ
encias Biol´
ogicas
Programa Interunidades de P´
os-Graduac
¸˜
ao em
Bioinform´
atica
Doctoral Thesis
Network-based Methods for Analyzing
the Genetics of Human Complex
Diseases
Gilderlanio Santana de Ara´
ujo
Supervisor: Eduardo Martin Tarazona Santos
Co-supervisor: Ma´ıra Ribeiro Rodrigues
Belo Horizonte - MG
Network-based Methods for Analyzing the
Genetics of Human Complex Diseases
Tese apresentada ao Programa Interunidades de P´os-Gradua¸c˜ao em Bioinform´atica do Instituto de Ciˆencias Biol´ogicas da Universidade Federal de Minas Gerais como requisito para a obten¸c˜ao do t´ıtulo de Doutor em Bioinform´atica.
Orientador: Eduardo Martin Tarazona Santos Co-orientadora: Ma´ıra Ribeiro Rodrigues
043
Araujo, Gilderlanio Santana de.
Network-based methods for analyzing the genetics of human complex diseases [manuscrito] / Gilderlanio Santana de Araujo. – 2017.
71 f. : il. ; 29,5 cm.
Orientador: Eduardo Martin Tarazona Santos. Co-orientadora: Maíra Ribeiro Rodrigues.
Tese (doutorado) – Universidade Federal de Minas Gerais, Instituto de Ciências Biológicas.
1. Variação Genética. 2. Genética populacional. 3. Genética humana - Doenças. 4. Ferramentas - Computação - Teses. 5. Bioinformática - Teses. I. Santos, Eduardo Martin Tarazona. II. Rodrigues, Maíra Ribeiro. III.
Universidade Federal de Minas Gerais. Instituto de Ciências Biológicas. IV. Título.
Abstract
Interpreting the high volume of genomic data is a challenge for epidemiologists, an-thropologists and geneticists that aim to understand the genetic basis of populations and phenotype variations (diseases/traits). In this respect, several computational meth-ods and tools have been developed to extract knowledge and data patterns from public ’omic’ data for a diverse set of populations in genetic studies, and also to deal with transparency and reproducibility that has been two subjects of high importance in sci-ence. The genetic architecture of parental populations, such as African, European and Asian, has been subject of studies to understand the process of population structure and the origins of genetic diseases. It is well known that allele frequency and allele dif-ferentiation based on genotype data reveal hallmarks of differential demographic history in worldwide populations, and some alleles are risk variants that confer disease risk and their frequency may lead to varying susceptibility to complex diseases. In this context, this thesis has two main contributions, one is a network-based approach to integrate and visualize data from NGHRI/EBI GWAS Catalog and 1000 Genomes Project, and the second is scientific workflow approach to disclose scientific knowledge. First, we present DANCE (Disease-Ancestry Network), a new web tool to improve the understanding of the genetic architecture of diseases in a cross-ethnic view. DANCE is a tool to inte-grate, summarize and visualize molecular profiles of genetic disease associations in a network-based approach. It was implemented as a web-based tool to explore genetic associations and risk allele differentiation across global populations to support a broad set of genetic population analyses, such as GWAS replication and admixture mapping. Our networks are bipartite, where nodes are either phenotypes (diseases/traits) or SNPs and diseases are connected to SNPs if there is a known association in current GWAS studies. In a graphical projection, the population variability of risk-alleles frequencies is represented as a color gradient based on the pairwiseFST values of different populations,
ii
Acknowledgements
First and foremost, I thank my supervisor Prof. Eduardo Martin Tarazona Santos for
accepting me at Human Genetic Diversity Lab (LDGH). I would like to acknowledge Prof. Ma´ıra Ribeiro Rodrigues that was a great co-supervisor, for her availability and
great constructive ideas, for her vision and scientific knowledge of a great researcher. I thank all the members and friends of LDGH. At Computer Science Departament, I thank the collaboration of Prof. Pedro Olmo Vaz de Melo, Prof Ana Paula Couto
Silva, Prof. Raquel Minardi for their contributions and knowledge in computer science, which were crucial for the development of this study. Also, I thank the undergraduate
students Lucas Henrique and Paula Veriatto for their technical support. I would show my gratitude to my family and all friends during my time in Belo Horizonte, for every
minute I spent in their company, that were needed to grow personally and professionally. I would like to thank all the people who contributed to the whole work described in this thesis. All people mentioned here were co-authors of my study in some way. Finally, I
Abstract i
Contents ii
List of Figures iv
List of Tables vii
Abbreviations viii
1 Introduction 1
1.1 Biological background . . . 1
1.2 Networks in biology: a brief review . . . 2
1.3 Motivation and objectives . . . 5
1.4 Contributions . . . 6
1.5 Thesis organization . . . 8
2 Disease-Ancestry Networks 9 2.1 Introduction . . . 9
2.2 Data . . . 11
2.3 Modeling networks . . . 15
2.3.1 SNP-Disease Network . . . 15
2.3.2 Disease-Disease Network . . . 16
2.4 Web tool . . . 17
2.5 Global and local network topology properties of SDN . . . 20
2.5.1 Global Topology Properties . . . 22
2.5.2 Local Topology Properties . . . 23
2.6 Global and local network topology properties of DDN. . . 29
2.6.1 Assortativity of degree and medical class of phenotypes . . . 34
2.7 Study Cases . . . 35
2.7.1 Exploring the genetic architecture of obesity . . . 35
2.7.2 Exploring the genetic architecture of Alzheimer’s disease . . . 37
2.7.3 Genetic Overlap Analysis of Neuropsiquiatric traits . . . 38
2.7.4 DANCE as learning objects . . . 40
2.7.4.1 Applications in classroom . . . 40
3 Towards Transparent and Reproducible Population Genetic Analysis 45 3.1 Introduction . . . 45
Contents iii
3.2 EPIGEN-Brazil’s Scientific Workflow . . . 47
3.2.1 Flowcharts . . . 51
3.2.2 Masterscripts . . . 51
3.2.3 Documents . . . 52
3.2.4 Other Resources . . . 52
3.3 Continental and Local Ancestry Analysis: Case Report . . . 53
3.3.1 Data . . . 53
3.3.2 Data integration . . . 54
3.3.3 European, African and Native American Tri-hybrid Ancestry . . . 54
3.3.4 European, African and Native American Local Chromosome An-cestry . . . 55
4 Overall Discussions 59 4.1 Disease-Ancestry Networks . . . 59
4.2 The EPIGEN-Brazil Scientific Workflow . . . 61
4.3 Limitations . . . 61
4.4 Future works . . . 62
A Entity Relationship Model of DANCE’s Database 65
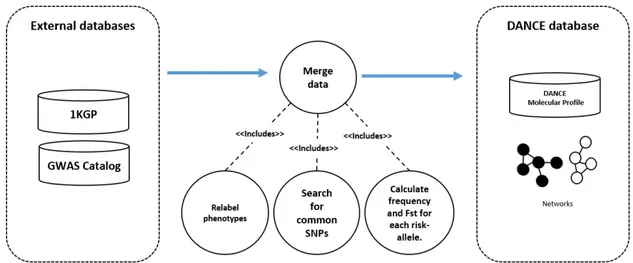
2.1 Bipartite network of GWAS studies (grey and yellow nodes) and conti-nental populations (red nodes). The yellow nodes represents the studies that have tested or replicated the association in a different population. . . 10 2.2 Process of merging 1KGP and GWAS Catalog data to construct DANCE
molecular profiles and networks. . . 12 2.3 Distributions of DANCE data. . . 14 2.4 (a) The SDN is a bipartite graph where phenotypes and SNPs is connected
if there is a GWAS hit. In (b) the SDN is a bipartite multi-graph, where SNPs are connected by linkage disequilibrium edges in specific popula-tions. For example, the second model presents edges between two SNPs correlated in three populations A (black edge), B (red edge) and C (blue edge). . . 15 2.5 Network projection. (A) In the bipartite SNP-Disease Network the
red-scale nodes are SNPs and blue nodes are phenotypes. (B) In the Disease-Disease Network all nodes are phenotypes and edges link two phenotypes. Each edge is formed by a projection process (I), which consists of link-ing two phenotypes if both are associated with a shared risk allele. (C) The annotated Disease-Disease Network is a result of a node annotation process (II), where we assigned to each phenotype node a medical class attribute (color) from the Medical Subject Headings and the Genetic As-sociation Database. . . 17 2.6 Network view page of DANCE. This figure illustrate the SDN for skin
pigmentation and three others phenotypes that shares risk-alleles with it. In the Data Filters Panel we choose the SNP-Disease Network, after we choose to query the risk-allele frequency in Africans, ranging from 0 to 1. For this query the effect size ranges from 0 to 30. We choose to view the LD in Africans. At last, set the phenotype parameter as skin pigmentation and the neighborhood as 1. . . 18 2.7 Layout fit execution time in relation to the number of nodes. . . 21 2.8 Disease Network for SNP hubs. Filters used: Network =
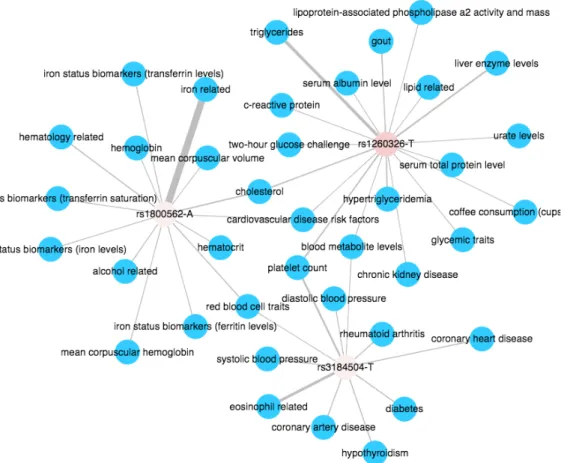
SNP-Disease Network, Ancestry = allele Frequency - African, SNP - Risk-allele = rs1260326-T, rs1800562-A, rs3184504-T . . . 25 2.9 (A) Degree distribution of risk-alleles. (B) Degree distribution of
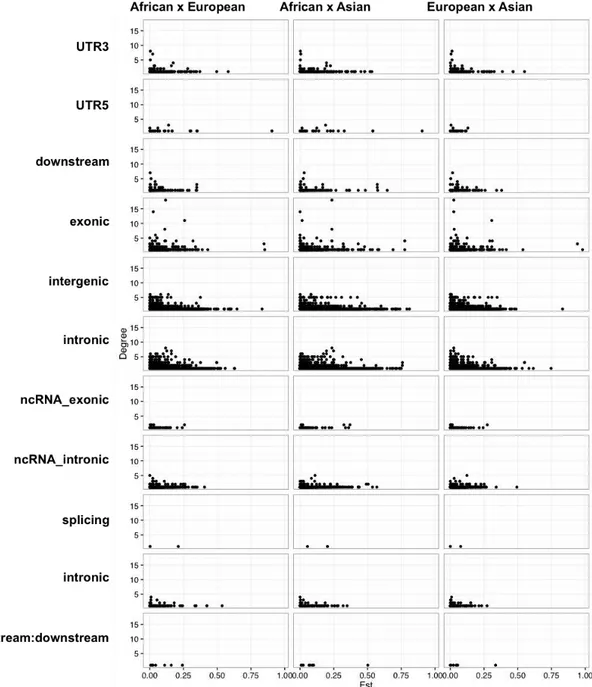
pheno-types. (C) Bipartite clustering of risk-alleles in function of degree. (D) Closeness of risk-alleles in function of degree. E (E) Bipartite clustering in function of closeness for risk-alleles. . . 26 2.10 Distribution of Fst in function of SNP degree stratified by functional class
of SNPs. . . 27
List of Figures v
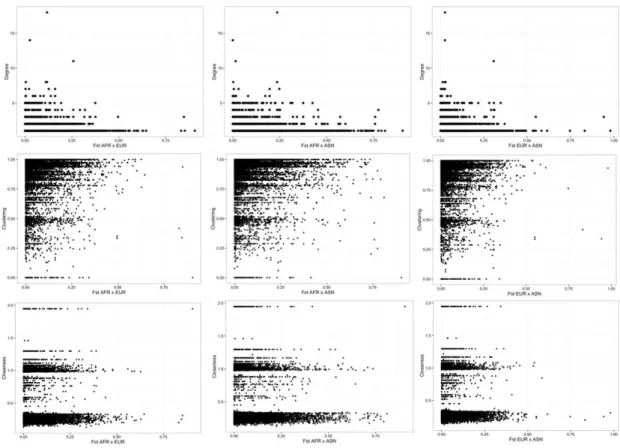
2.11 (A) Degree distribution of risk-alleles in function of Fst. (B) Clustering distribution of risk-alleles in function of Fst. (C) Closeness of risk-alleles in function of degree. . . 29 2.12 In (A) the Jaccard Coeffient is directly computed considering the directed
associations with phenotypes (A and B in black nodes) and variants (V in white nodes). In (B) the JC is computed considering the LD edges (in red), thus, variants V1 and V2 are indirectly associated with phenotypes B and A, respectively. . . 30 2.13 Venn Diagram of the proportion of exclusively nodes in distinct and pairs
of networks. . . 31 2.14 SNP-Disease Network for obesity considering African and Asian
ances-tries. Filters used: Network = SNP-Disease Network, Ancestry = FST
-African x Asian, Phenotype = obesity. . . 36 2.15 SNP-Disease Network for the FTO gene considering African and Asian
ancestries. Filters used: Network = SNP-Disease Network, Ancestry = FST - African x Asian, Gene = FTO. . . 36
2.16 SNP-Disease Network for Alzheimer’s disease. Filters used: Network = SNP-Disease Network, Ancestry =FST - African x European, Phenotype
= Alzheimer’s disease. . . 37 2.17 SNP-Disease Network for TOMM40. Filters used: Network =
SNP-Disease Network, Ancestry = FST - African x Asian, Gene = TOMM40.
. . . 38 2.18 Disease-Disease Networks considering the Jaccard Coefficient with and
without linkage disequilibrium edges. . . 39 2.19 Query for exploring genetic variants associated with skin pigmentation.
The user can explore, identify and visualize the set of SNPs associated with a particular phenotype or gene from the filters implemented in Panel 1 and display in Panel 2. For each SNP the frequency of the risk allele can be consulted and the value of the genetic differentiation index between the pairs of African, European and Asian populations and. All genetic annotations for the SNPs can be viewed in tabular form, as demonstrated in Panel 3. This figure corresponds to the first version of DANCE. . . 42 2.20 Frequency of genetic variations associated skin pigmentation. . . 42
3.1 Outline of the analyses that compose a population genetics and genetic epidemiology project. Data Heterogeneity is represented by different ge-ometric forms labeling distinct private or public data sources. Data Inte-gration is the first process to be handled, followed by Quality Control and Data Cleaning. After that, a working dataset is available and a variety of follow-up analyses can be performed. . . 48 3.2 The EPIGEN-Brazil Scientific Workflow components: Flowcharts,
Mas-terscripts, Documents and Scientific Publications. All components are connected during the scientific process. . . 49 3.3 The EPIGEN-Brazil Scientific Workflow: Home(A), Flowcharts (B) and
Masterscripts (C) . . . 50 3.4 General flowchart describing data, process and documents formats
3.5 Continental admixture of the EPIGEN-Brazil populations. Brazilian re-gions (NE: Northeast, SE: Southeast, S: South), the studied populations, and their continental individual ancestry barplots. N represents the num-bers of EPIGEN individuals in the Working Dataset. . . 57 3.6 The distribution of lengths of chromosomal segments of continuous
spe-cific ancestry (CSSA) across the genome calculated for Salvador, Bambu´ı and Pelotas. CSSA lengths are organized in 50 equally spaced bins per population. We represented different sets of chromosomes with similar length. Green: Native American, Blue: African, Red: European ancestries. 58
List of Tables
2.1 1000 Genomes populations and sub-populations. . . 13
2.2 SNP-Disease Networks properties in different perspectives. . . 22
2.3 SNPs with the three highest node degree - hubs. . . 24
2.4 Topology properties of Disease-Disease Networks. . . 31
2.5 Exclusively phenotypes for each Disease-Disease Network considering the JC’. . . 32
2.6 Exclusively phenotypes for each pair of populations Disease-Disease Net-works considering the JC’. . . 33
2.7 Assortativity coefficients for Disease-Disease Networks. . . 34
2.8 SNPs associated to obesity and related traits with high genetic diff eren-tiation between African and Asians. . . 35
AFR African
ASN Asian
DANCE Disease-Ancestry Network
DDN Disease-Disease Network
EUR European
GWAS Genome-Wide Association Studies
JC Jaccard’s Coefficient
LD Linkage Disequilibrium
SDN SNP-Disease Network
SNP Single Nucleotide Polymorphism
SW Scientific Workflow
Chapter 1
Introduction
1.1
Biological background
The most common genetic variation in the human genome is the Single Nucleotide Polymorphism (SNP), which is a nucleotide change in the genome sequence. SNPs affect our visible phenotypes such as our height, weight, hair color and skin pigmentation, as well as influence our susceptibility to many diseases and may affect our responses to treatments. For the moment, SNPs are the main genetic factor that contributes to human genetic variability and are important fine-scale units for mapping complex genetic traits [1].
In estimates, SNPs are found in the genome with a frequency of 1/1000 per base pairs and are more frequently situated in non-coding regions than in coding regions [2]. For SNPs located in coding regions, we can evidence synonyms and non-synonyms effects. A synonym effect does not alter the protein structure, maintaining the physic-chemical properties of the amino acids due to the similarity of the codons in the translation process, but can affect the regulation of transcription factors. A non-synonym effect, on the other hand, may bring structural and functional variations to the protein, and it is related to cellular disorders like oncogenesis, Alzheimer’s disease, and type 2 diabetes [3, 4]. SNPs in non-coding regions, such as in splicing sites, may generate insertion, deletion or modification of exon size, destabilizing the mRNA and, consequently, the synthesized protein. When SNPs are in termination codons, the process of translation of sequences of RNA can generate proteins of different sizes.
In this context, the areas of human genetics and genetic epidemiology are interested in quantifying and qualifying the variations in different locations of DNA sequences, and the interaction between them and the environment. Based on that, studies in these areas try to figure out the impact of genetic variations in an individual’s susceptibility to diseases. Genome-Wide Association Study (GWAS) is a popular approach for inves-tigating association of genetic variants to phenotype variation. Today, due to a number
of advances in biotechnology and costs reduction of genotyping techniques using SNP arrays, around five million SNPs can be explored in a single GWAS [5, 6]. As a result of GWAS, many genetic variants have been significantly associated with complex traits, specially in genetic homogeneous populations. However, the number of reported vari-ants in each study is still insufficient to explain most disease development and to predict clinical outcomes.
GWAS data sets are highly dimensional, with millions of SNPs genotyped over thousands of individuals. The traditional analysis approach is to evaluate each SNP separately with statistical methods that compare their genotypes in cases and controls, in order to find risk-alleles associated to a particular disease or trait (phenotypes). Such univariate sta-tistical association tests can not, however, detect SNP interactions and only highlights the main genetic effects [7, 8]. In addition, applying univariate methods in admixed pop-ulations have significant complications, in face of the genetic heterogeneity of individuals. If not well design, a GWAS in an admixed population may report spurious associations between genetic variants and complex traits. Generally, to reduce false-negative results GWAS in mixed populations adjusts association tests by using socioeconomic covariates and inferred individual ancestry values.
A common follow up step in GWAS is to find SNPs correlated to statistically significant associations to identify additional causal variants. One way of achieving that is by using a property of SNPs denoted as linkage disequilibrium (LD), which is the non-random association between two or more SNPs [9]. This association forms haplotype blocks, that is, a set of SNP in LD. The physical link between the loci tend to be inherited together, however the process of chromosomal crossing, in which there is exchange of genetic material between homologous chromosomes, reduces LD between the SNPs and the persistence of the association depends on the recombination in different regions of the genome.
SNPs are important genetic units for demographic, epidemiological and clinical stud-ies. The genome-wide genotyping of millions of SNPs reveals hallmarks of differential demographic history in worldwide populations [10, 11]. Also, since some of the alleles confer disease risk, the frequency of risk alleles may determine varying susceptibility to complex diseases and drug response over populations [12, 13]. Some complex phenotypes with genetics basis have different levels of prevalence in different populations, such as pigmentation-related traits (skin, eyes and hair) that are one of the most extreme cases of variation between global populations [14].
1.2
Networks in biology: a brief review
Introduction 3
nodesuandvare linked by an edge, then (u, v)✏E. According to the direction of edges, a graph can be directed or undirected. In an undirected graph, an edge connecting u tovalso connects v tou; otherwise, in a directed graph, this does not necessarily occur and the edges have only one direction. Directed graphs are appropriated for biological pathways and sequential interactions, where a process can occur in cascades. Also, if a graph has multiple distinct parallel edges connecting the same nodes, this graph is called multi-graph. If a graph comprises a disjunctive set of nodes, it is called a bipartite graph [15].
The most outstanding examples of networks in the biological field are proteprotein in-teraction networks (PPI), regulatory networks, and metabolic and biochemical networks [16]. For example, modeling PPI networks allows to analyze protein bonds and how they enable biological processes. Regulatory networks, although having many different units, can be used to analyze how the links between proteins and biomolecules originate gene expression in cells [17]. A metabolic and biochemical network represents thousands of chemical reactions that are catalyzed by enzymes [18].
Biological systems are complex and difficult to understand when initially analyzed as a whole. A more suitable approach is first to understand the role of each element in the system and then to observe their connections. Thus, when a biological system is modeled as a network, the characteristics of its elements and their links can be extracted by applying a plenty of statistical topology network properties. These properties, in turn, can be used to explain the origins and dynamics of biological processes in specific domains of study. The topology properties of nodes and edges, such as centrality and clustering metrics may help in understanding the network as a whole, and they have been used to identify the most influential elements within a graph.
In the scope of this thesis we modeled only undirected networks and, thus, we define graph topology properties and centrality measures are defined as following:
• Topology properties:
– Connected components. The simplest connected component of a network occurs when there are only two nodes connected by one edge, forming paths between the two nodes. A network is disconnected if there are more than one connected component. A low number of connected components indicates strong network connectivity. The component with the largest number of nodes and edges is commonly called the giant component.
– Diameter. The diameter is calculated based on the distribution of the short-est paths between each node pair. To determine the diameter, it is enough to find the maximum value of this distribution. If a network is disconnected, that is a network with more than one component, the diameter is calculated for each component and it is defined as the maximum value of all diameters.
– Average Number of Neighbors. This measure is the mean of the degree distribution for all nodes.
• The bipartite centrality metrics are defined as:
– Degree. The degree of a node is the number of edges incident to it. This is commonly used as a centrality metric to identify important nodes in networks. Nodes with high number of connections play an important role in the network. For example, if one central element is removed in a regulatory network it may damage a molecular processes. In bipartite graphs, the degree is calculated for each disjoint node set separately. Nodes with high degree centrality (or number of connections) are called hubs. These nodes are important elements of the network and have strong impact on the functionality of the network when removed. For purpose of further analysis in this study, the degree of a node is used as a measure of centrality and connectivity.
– Bipartite Clustering. Some elements of the network tend to cluster with others. It is possible to measure local density of connections by bipartite clustering as defined in [20]:
cu =
P
v∈N(N(u))cc(u,v)
N(N(u)) ,
whereN(N(u)) are the second order neighbors ofuin a graphG= (U, V, E) excluding u. The cuv is the pairwise clustering coefficient between nodes u
and v, defined as:
cuv = N(u)
∩N(v)
N(u)∪N(v)
.
The closeness of a node is the distance to all other nodes in the graph or in the case that the graph is not connected to all other nodes in the connected component containing that node.
– Closeness. The closeness of a node is a metric based on the distance to all other nodes in the graph. In case of disconnected graph, the closeness is computed considering the distance to all other nodes in the connected component, which contains that node.
cu =
m+ 2(n−1)
d ,foru∈U (1.1)
,
cv =
n+ 2(m−1)
Introduction 5
wherem is the number of nodes in U,n is the number of nodes in V, and d is the sum of the distances fromu orv to all other nodes. Higher centrality is reflect by high values of closeness.
1.3
Motivation and objectives
Although human phenotypes networks have been proposed elsewhere in the literature [21–23], they have a number of limitations in comparison to the present approach. Par-ticularly, the human phenotype network proposed by Goh et. al. [21] is biased, since genetic associations between genes and phenotypes were based on Mendel’s principles, focusing on monogenic disorders cataloged in OMIM [24]. The research team of Moore [23] published in 2013 an integrative approach to infer human phenotype networks based on genetic associations between SNPs and phenotypes for a set of approximately six thousands SNPs and limits the genetic data for the initial phase of the HapMap data [25], which presents few individuals for a diverse set of population genetic data.
An intrinsic feature to all the approaches above is that none considers the genetic vari-ability for a large set of populations. Accounting for genetic population data when designing human disease networks have received no attention. To the best of our knowl-edge, there is currently no computational approach and tool that accomplishes specific-population data such as risk-allele frequency differentiation between populations. With the publication of genetic data from Phase 3 of the 1000 Genomes project [11] it is possible to investigate, in a fine-scale view, the genetic variability of several populations considering around 2500 samples distributed geographically in the African, Asian and European continents. Also, we can take advantage of the public data from ˜2.000 genome-wide association studies, which reported approximately 12.000 risk-alleles associations with a broad set of complex traits in the NGHRI/EBI GWAS Catalog [8]. Although many variants have been discovered as main factors that contributes to the development of complex phenotypes, the whole intrinsic architecture of phenotypes is far from being established.
Considering the present limitations and availability of public genetic data, our general interest is to develop integrative computational approaches to explore biological mech-anisms related to risk-allele variants associated with complex human phenotypes and possible influences of genetic variability. To achieve our general goal we define specific aims as follows:
2. Curate genome-wide association data and population genetics data to define molec-ular profiles of risk-allele data, which includes allele frequencies, allele frequency differentiation, linkage disequilibrium and effect sizes, functional data and chro-mosome coordinates.
3. Infer human phenotype networks based on curated data of genome-wide association studies and genetic variability between populations.
4. Investigate risk-allele frequency differentiation between populations and their func-tional impact and relation with complex phenotypes.
5. Develop tools to improve the reproducibility and transparency in population ge-netics and epidemiological analyses.
1.4
Contributions
The contributions of this study are summarized as follows:
1. Proposal of a network-based approach to integrate and analyze genome-wide as-sociation data and genetic variability between African, European and Asian pop-ulations.
2. An interactive web tool to investigate and visualize genetic variants of risk, their allele differentiation between populations, and also their effects size over human complex phenotypes.
3. A curated dataset of genetic associations between phenotypes and alleles, risk-allele frequency for different populations and risk-allele frequency differentiation between pairs of population.
4. Inferences of non biased population-based human phenotype networks based on risk-allele associations for different populations, in contrast to the networks of Goh [21].
5. Analysis of network topology properties of risk-alleles and genetic variability be-tween pairs of populations.
6. Curated molecular profiles for risk-alleles including functional annotation data and genetic variability data, complex phenotypes, their number of associations, their number shared variants and genetic overlap indexes with other phenotypes.
Introduction 7
In order to explore risk-alleles associated with diseases and possible influences of ancestry-specific allele frequencies in phenotype susceptibility, we present an integrative network approach named as Disease-ANCEstry Network (DANCE) (more detailed in the Chap-ter 2). DANCE integrates data of genetic variant phenotypes associations with datasets from distinct population. The results are presented through a graph web-based ap-plication that allows visualization of relations between the risk-alleles and phenotypes together with population information. Specifically, when building DANCE, we took into account GWAS results, risk-allele frequencies, and risk-allele differentiation between Eu-ropean, African and Asian populations. Also we include linkage disequilibrium for these populations. The network is assembled such that phenotypes and SNPs are represented as nodes. A phenotype and a SNP node are connected if there is a known GWAS association. Each SNP node is annotated with risk-allele frequency and risk-allele dif-ferentiation. The curated data of DANCE provides insights into the genetic architecture of phenotypes for population genetic studies. DANCE addresses a current limitation in biological and phenotype networks that is the account for information on biogeographic allele variation. In Chapter 2 we outline some use directions with experiments using DANCE data and it is available in http://ldgh.com.br/dance/ to support genetic pop-ulation studies. The first version of DANCE were published in Ara´ujo, et. al, 2015 [26] and updates of data and upgrades on the data filters and data visualization have been implemented periodically. In summary DANCE can be used: a) to explore risk allele frequency and allele differentiation between populations and linkage disequilibrium; b) to assist variant prioritization analysis, c) to assist genetic overlap analysis, and d) as a educational tool.
Integrative computational approaches has been a fundamental to identify genetic overlap and correlations between phenotypes. To achieve this goal we present inferences of hu-man phenotype networks considering the genetic architecture of phenotypes for different populations. The results provide an analysis of three population-phenotype networks with similar topology structure, but they present distinct pairs of connected phenotypes. We integrate these networks in DANCE and it is available for interactive querying in DANCE (http://ldgh.com.br/dance/). Inferring human phenotype networks by aggre-gating linkage disequilibrium is a new perspective for DANCE. This networks provides pairs of phenotypes, which share risk allele variants. Currently genetic overlap analysis has been subject of some studies, but limited to one of few pairs of phenotypes, such as schizophrenia and bipolar disorder, BMI and cognitive phenotypes. In a network perspective DANCE provides distinct Human Phenotype Networks for each population according to its linkage disequilibrium pattern considering the whole network relations available in the GWAS Catalog.
of South Americans, which are underrepresented in population genetic studies. Sev-eral analyses have been performed in the context of EPIGEN, which manipulate high dimensional data, such a population-based genome-wide analysis of 6,487 Brazilian in-dividuals of three cohorts (from Bambu´ı-MG, Salvador-BA and Pelotas-RS) to estimate ancestry patterns, based on 2 millions of SNPs. The results are described in Chapter 3 and they were published in (Kehdy et al., 2015) [10]. These analyses are prone to errors and demand much computational programming and execution efforts. Thus, we developed a web system and repository, called EPIGEN Scientific Workflow (SW), to improve transparency and reproducible of population genetics analysis. The SW is a computational effort for organizing the bioinformatics resources for population genetics and genetic epidemiology studies in the EPIGEN-Brazil context. The SW tool allows to share flowcharts, masterscripts technical documents and scientific publications within our group and with the scientific community as a whole. The SW is implemented as a web system and is available at http://www.ldgh.com.br/scientificworkflow/.
1.5
Thesis organization
This thesis is structured in four chapters and its remained content is organized as follows:
• Chapter 2 - Disease-Ancestry Networks. This chapter presents details about
the conception of DANCE such as: data integration, network modeling, web inter-face with data filters and visualization, and software architecture. Also, we present a description of the SNP-Disease Network and Disease-Disease Network, and their global and local network topology properties. Some study cases, which explores DANCE networks are presented too.
• Chapter 3 - The EPIGEN-Brazil Scientific Workflow. This chapter presents
an approach to improve transparency and reproducibility of analysis in the con-text of EPIGEN-Brazil project. A real and detailed case of continental and local ancestry inferences is presented using genome-wide data of South Americans.
• Chapter 4 - Conclusions. This chapter presents sections of discussions and
Chapter 2
Disease-Ancestry Networks
2.1
Introduction
Genetic mapping aims to investigate causative genes underlying phenotypes by corre-lating with DNA variation. Genome-Wide Association Studies (GWAS) [6] have been the preferred approach of genetic studies and an important approach to associate novel genes with development and progress of human complex phenotypes and response to treatments. GWAS have identified candidate disease genes that contribute to the de-velopment of complex diseases, such as Alzheimer’s disease [27], obesity [28], infectious diseases, as well as traits such as skin pigmentation, eye and hair color [14].
A challenge for modern genetics is identifying functional variants underlying molecular processes that confer risk to complex diseases, and developing pharmaceutical therapies for clinical treatments. Although having successful results, the GWAS approach has several limitations. For case-control data, GWAS require genetic homogeneous samples for statistical testing, because several evolution processes acting on the population may produce bias and false positive results. Specially GWAS in mixed populations, such as Brazilian population, that are derived from Native Americans, Africans and Europeans [10]. Usually, covariates such as socioeconomics and ancestry inferences are used for controlling false positive results.
Cross-ethnic GWAS have identified causative genes associated with complex phenotypes such as diabetes and obesity, considering the genetic data of several populations. How-ever, European population is over-represented in Genome-Wide Association Studies. Actually, only 20% of participants in GWAS are Asians and Africans descents [29]. It is possible to visualize this fact in the bipartite network presented in Figure 2.1, which represents a view of the distribution of GWAS studies and continental populations. An-other worrying fact is the few studies that replicate or test associations of genetic variant to phenotype in different populations. Yellow nodes in Figure 2.1 show a landscape of the number of studies that investigated the association in other populations.
Figure 2.1: Bipartite network of GWAS studies (grey and yellow nodes) and con-tinental populations (red nodes). The yellow nodes represents the studies that have
tested or replicated the association in a different population.
Introduction 11
Catalog [8]. To take advantages of the stored data in these data, some network-based approaches provides a global view of genes and complex phenotypes interrelations as opposed to traditional single-gene single-disorder approaches [22, 23]. They consist of linking two phenotypes if both have a known association to the same gene. Such human disease networks represent a homogeneous view of genes and disease. However, it is known that genetic variability found in different populations account for a portion of the variation in disease susceptibility [30, 31].
Indeed, the allele frequency spectrum for genotype data reveals hallmarks of diff eren-tial demographic history in worldwide populations. The susceptibility to complex traits can be explained by some of these alleles, which confer risk and increase the prevalence in distinct populations. However, current implementations of the human disease net-work disregard this variability and represent a single view of genetic associations with phenotypes [21, 23].
Little attention is given to account for population information when designing human disease networks. To address this issue, here we present DANCE, a Disease-ANCEstry network approach to organize information on human diseases and genetic variants, in particular Single Nucleotide Polymorphisms (SNP), and its frequencies among popula-tions. It is implemented as an interactive graph-based web tool. More specifically, the tool allows the visualization of joint information of human phenotypes and their associ-ated SNPs based on GWAS hits and the distribution of risk allele frequencies of these SNPs in different continental populations (African, European, and Asian).
DANCE comprises two components: 1) a web tool for visualizing and summarizing pop-ulation genetic data, and 2) a relational database of GWAS annotations, that includes the relationships between risk-allele and phenotypes. Technical and conceptual details about the conception of both are detailed in the next sections.
2.2
Data
DANCE’s1 dataset combines information from two existing databases: (i) risk-alleles associated with complex phenotypes, reported in the NHGRI GWAS Catalog [8] and (ii) for genetic population data, DANCE calculates risk-allele frequencies in Europeans, Africans and Asians from the 1000 Genomes Project Phase 3 (1KGP) [11]. Currently, the GWAS Catalog contains 2088 studies with PubMed numbers and it is mapped to Genome Assembly GRCh38.p5 and dbSNP Build 146. The Table 2.1 lists the sub-populations of 1KGP that we merged to compose each of the three populations in DANCE. A summary of data merging is presented in Figure 2.2.
The process of data merging follows two main steps: a) first, the GWAS Catalog was manually curated to remove semantic redundancies on phenotype labels. As result, we
produced a map of label changes as an input to a function for relabeling the original phenotypes aiming to standardize data; b) and second, we merged the .ped and .map files of African, European and Asian populations to find the variant overlap between them. In this step, we included only biallelic SNPs that presented the same two nucleotide bases as alleles in all populations to avoid inconsistencies due to flip strand. This filter has resulted in around 77 million SNPs with overlap in the three populations. These are called 1KGP SNPs hereafter. At last, we performed a second merge to find the overlap between the GWAS Catalog SNPs and the 1KGP SNPs. We included only the SNPs for which the GWAS risk-allele was the same of reference or alternative allele in the 1KGP SNPs. The results of relabeling phenotypes labels and the merge with 1KGP results in 1521 studies reporting 12.380 risk-alleles associated to 721 phenotypes.
Figure 2.2: Process of merging 1KGP and GWAS Catalog data to construct DANCE molecular profiles and networks.
After merging data, we quantified the allele frequency based on genotypes for African, European and Asians. For measuring risk-allele frequency differentiation between popu-lations (African-Asian, African-European and European-Asian), we calculated the FST
[32] for each risk-allele and each population pair, as follows:
FST = σ
2
p(p−1),
where 2 is the variance of risk allele frequencies in the total population and p is the average frequency of this allele in the total population.
Introduction 13
disequilibrium (LD) between pairs of SNPs reported as risk-alleles. Thus, to include LD in DANCE database we used the r2 index[34]. The r2 is a metric commonly used in genetic studies for mapping and identifying causal variants. It is a measure of LD between alleles. It ranges from 0 to 1, indicating the degree of correlation. Ifr2 is equal to 0 indicates no dependence between the alleles, otherwise if r2 value is 1 indicates alleles highly dependent and one allele can be predicted by another. r2 is defined as:
r2 = D
2
PA1∗PA2∗PB1∗PB2
, (2.1)
,
wherePAi, for i∈(1,2) is the allele frequency and D is the major linkage disequilibrium
metric defined by Lewontin and Kojima [35] as the difference between the observed frequency of two-locus haplotypes (PAB) and the expected frequency (PAPB), as follows:
D=PAB−PAPB. (2.2)
Table 2.1: 1000 Genomes populations and sub-populations.
EUR - European
CEU Utah Residents (CEPH) with Northern and Western European ancestry
TSI Toscani in Italia
FIN Finnish in Finland
GBR British in England and Scotland
AFR - African
IBS Iberian population in Spain
YRI Yoruba in Ibadan, Nigera
LWK Luhya in Webuye, Kenya
GWD Gambian in Western Divisions in The Gambia
MSL Mende in Sierra Leone
ESN Esan in Nigera
ASW Americans of African Ancestry in SW USA
ACB African Caribbean in Barbados
ASN - Asian
CHB Han Chinese in Bejing, China
JPT Japanese in Tokyo, Japan
CHS Southern Han Chinese
KHV Kinh in Ho Chi Minh City, Vietnam
CDX Chinese Dai in Xishuangbanna, China
(a) Risk-allele frequency distribution. (b)Fst distribution
(c)Linkage disequilibrium distribution (d)ODDS Ratio distribution
Figure 2.3: Distributions of DANCE data.
present risk-allele frequencies for three populations, population pairwise FST, the
re-ported chromosome, gene and region in which the SNP is located, and its associated phenotypes. In the same way, DANCE database allows to query the corresponding GWAS studies with PubMed numbers, the effect sizes (odds ratio or beta) for each as-sociation of risk-alleles with phenotypes, and its respective p-value. The SNP molecular profiles and GWAS study data were stored in a relational database, with basis in a entity relationship model reported in Apendix A.
Introduction 15
2.3
Modeling networks
The curated relations between risk-alleles and phenotypes were used to create two net-work models: the SNP-Disease Netnet-work and (SDN) the Disease-Disease Netnet-work (DDN). The SDN allow us to explore the influences of risk-alleles variants and their genetic pop-ulation landscape associated with phenotypes, while the DDN is a projection of the SDN. The DDN were projected to explore the relations between phenotypes that shares risk-alleles with other phenotypes. The SDN model is represented in Figure 2.4 and the process of constructiong of the DDN is detailed in Figure 2.5.
Figure 2.4: (a) The SDN is a bipartite graph where phenotypes and SNPs is connected if there is a GWAS hit. In (b) the SDN is a bipartite multi-graph, where SNPs are connected by linkage disequilibrium edges in specific populations. For example, the second model presents edges between two SNPs correlated in three populations A (black
edge), B (red edge) and C (blue edge).
2.3.1 SNP-Disease Network
We proposed a SNP-Disease network implemented as a bipartite network G = (V, E) where the node set V can be partitioned into two sets: (A) phenotypes and (B) risk-alleles. Phenotypes are connected to SNP risk-alleles if there is a known association (that is, a GWAS hit), composing the edge set E. As such, different phenotypes in-terconnect through shared risk-alleles. The ancestry information is represented in a basic level as a property of the SNP risk-allele node and comprises its frequency in a determined population, as given by the SNP’s molecular profile. Also, the measures of genetic variability were computed by FST between pairs of populations are represented
as properties of risk-allele nodes.
distribution we removed five percent of data, which includes outliers values. Modeling the effects size of risk-alleles in the network still is a challenging for our future works, due to statistical differences for analyzing quantitative and binary phenotypes and there is no classifications which kind of effect size value the GWAS Catalog is reporting for each association. Additionally the beta values express different variable units for the same phenotype, such as meter, centimeter, or kilogram and gram.
The SDN network were remodeled to accommodate correlations measured by the r2 between SNPs for each target population of this study. Thus, including LD edges, the SDN becomes a multi-graph bipartite network G = (V, E), represented in the Figure 2.4b where the relations between phenotypes and risk-alleles alleles remains, that is each phenotype is connected to a risk-alleles if there is a GWAS-hit. Additionally, SNPs are linked by multi-edges considering pairwise linkage disequilibrium index (r2) calculated for each population (African, European and Asian). Thus, different phenotypes inter-connect through shared SNPs or are indirectly inter-connected by SNPs that are linked by linkage disequilibrium.
In order to add LD edges in the SDN we calculate the pairwise linkage disequilibrium based on the r2 equation implemented in Plink v1.9 [36]. The linkage disequilibrium is a property of SNPs that represents a non-random association of alleles at different loci. This property has been exploited to understand evolutionary process, allele diff erentia-tion between populaerentia-tions, and mainly to map genes with complex diseases by genome wide association studies [9].
2.3.2 Disease-Disease Network
The Disease-Disease Network (DDN) is an inference of a phenotype network projected from the bipartite SNP-Disease Network, where two diseases are linked if they share risk-alleles. The modeling process of the DDN is illustrated in Figure 2.5. The network comprises 437 phenotypes as nodes and 1974 edges, that links a phenotype to pheno-types. Each phenotype node has a medical class attribute classified based on the Medical Subject Headings (MeSH) [37] and labels from The Genetic Association Database [38], and also the number of risk-alleles associated by GWAS. To each pair of phenotypes in the DDN projection was assigned a weight for each edge, which is the Jaccard’s Co-efficient, indicating an overlap index for each pair of phenotypes. Thus, for each pair of phenotypes connected by at least one SNP in the SDN we compute the Jaccard’s Coefficient, defined as:
J c(A, B) = A∩B
A∪B,
Introduction 17
variants is the set of genetic variants that are associated to A and B. In the graphical projection the Jaccard’s Coefficient reflects the width of edges between phenotypes, and the node size of each phenotype is based on the number of associated risk-alleles to it.
Figure 2.5: Network projection. (A) In the bipartite SNP-Disease Network the red-scale nodes are SNPs and blue nodes are phenotypes. (B) In the Disease-Disease Net-work all nodes are phenotypes and edges link two phenotypes. Each edge is formed by a projection process (I), which consists of linking two phenotypes if both are associated with a shared risk allele. (C) The annotated Disease-Disease Network is a result of a node annotation process (II), where we assigned to each phenotype node a medical class attribute (color) from the Medical Subject Headings and the Genetic Association
Database.
2.4
Web tool
We implemented a network visualization component and data filters as a web tool to query association data and population genetic data. All the data were represented in networks structures, and also the data to construct were available in the form of tables. The web interface of DANCE is distributed in four web pages: a) Home; b) Networks; c) Documents and Tutorial and d) Data. To illustrate the use of web interface we present on the Figure 2.6 one query for risk-alleles of skin pigmentation.
DANCE web architecture is composed of a Query controller module, which provides the communication between the web interface and the server datasets, and a Profile manager module, which updates the server datasets with annotations and profiles from the GWAS Catalog, 1000 Genomes, and third-party datasets. The web interface was implemented with HTML52, with support of JQuery3scripts and extensions Cytoscape.js4. The query controller and the profile manager were implemented in Python 2.75 and NetworkX package6. DANCE provides links to download data for each query and .png images of
the resulting networks.
With DANCE web tool, users can perform six different tasks:
2http://www.w3schools.com/html/html5 intro.asp 3https://jquery.com/
1. identify and interactively visualize the set of risk-alleles associated with a list of phenotypes, including their risk-allele frequencies in a specific population or their pairwise population differentiation (measured byFST),
2. identify and interactively visualize SNPs from a list of genes and the associations with phenotypes, including their risk allele frequencies in a specific population or their pairwise population differentiation,
3. identify and interactively visualize the effect size of associations between risk-alleles and phenotypes,
4. identify and interactively visualize linkage disequilibrium data between risk-alleles in three populations; and
5. identify and interactively visualize shared associations between two or more phe-notypes by neighborhood visualization,
6. identify and interactively identify phenotypes genetic overlap based on a Jaccard’s Coefficient for similarity (overlap index).
To perform these tasks, we implemented a combination of filters: Network, Population Index (Allele Frequency or Fst), Population Index Range, Effect size range, Populations (For LD), Gene, SNP, Phenotype, and Neighborhood. Network is the broader filter, which includes the options SNP-Disease Network (to perform tasks 1 to 5) and Disease-Disease Network (task 6). The definition of these filters are describe as follows:
Figure 2.6: Network view page of DANCE. This figure illustrate the SDN for skin pigmentation and three others phenotypes that shares risk-alleles with it. In the Data Filters Panel we choose the SNP-Disease Network, after we choose to query the risk-allele frequency in Africans, ranging from 0 to 1. For this query the effect size ranges from 0 to 30. We choose to view the LD in Africans. At last, set the phenotype
Introduction 19
• By Network: SNP-Disease Network, Disease-Disease Network.
1. SNP-Disease Network – The user can explore links between SNPs and dis-eases, choosing the disease/trait, a single SNP or a gene.
2. Disease-Disease Network - We measure an index of SNP overlap between two diseases and project a disease network based on SNP-Disease Network. A pair of diseases is linked if the overlap index is greater than 0.
• By Population Index.
1. By global population – This filter allows to explore the spectrum of risk-allele frequencies for SNPs or traits in a single population.
2. By pair of global populations - For risk allele frequency differentiation, the user is able to explore the spectrum of bothFST values for SNPs and diseases.
• By Population Index Range. Risk-allele frequency andFST range from 0 to 1.
• By Effect Size Range. This ranges from 0 to 30 and are used to filter restrict
risk-alleles.
• By Population for LD. LD edges can be queried for African, European amd Asian.
• By list of SNPs.
• By gene. This filter allows to investigate the set of SNPs in phenotype genes.
• By phenotype. This filter allows to investigate the genetic association spectrum
of a target trait.
• Neighborhood order.
To perform tasks 1 to 5 users should set the Network filter to SNP-Disease Network option. From that, searches can be refined by choosing an Index filter: Risk allele frequencies in Africans, Asians or Europeans; pairwise FST between African-European,
African-Asian, and European-Asian. Finally, Gene, SNP-Risk Allele or Phenotype filters can be applied to narrow the resulting network view to the topics of interest.
For the Phenotype filter, the Neighborhood filter can be set to 0 (to visualize only the network of the phenotype selected) or to 1 (to visualize shared SNP-risk allele associa-tions between the phenotype selected and other phenotypes).
indicating higher allele frequencies or highly differentiated SNPs between two popula-tions, respectively. All information used to construct the different DANCE networks is also available as tables that can be searched and ordered according to any of its vari-ables. Thus, users can further explore DANCE dataset, for example, by ordering a table according to the most differentiated or rare SNPs. Networks and tables can be easily exported in different formats. Export network and data options includes:
1. Availability of a table with the SNP profile for each query using the SNP-disease network.
2. Availability of a table with the number shared SNPs and the Jaccard’s Coefficiente for the Disease-Disease Network.
3. Availability of a table with linkage disequilibrium data between SNPs by querying SNP-Disease Network.
4. Availability of a table with the complete SNP molecular profile.
5. All networks can be export as .png format.
For better visualizing the networks, DANCE implements the Compound Spring Embed-der layout, which uses a physics simulation to arrange non-compound graphs with tree structure. The physical simulations include variants such as gravity and node repulsion to lay out the graph [39]. When a user queries DANCE’s web interface, two processes are triggered: the user request and the layout fit. The first process takes only a couple of seconds to execute. The layout fit process has a client-side execution time that increases with the number of SNPs and has an exponential growth for queries with more than 100 nodes (see Figure 2.7). The Neighborhood parameter increases the layout fit time since it enlarges the number of phenotypes and SNPs in the neighborhood. In most cases, a user request takes 1 second to 1.5 minutes to execute. For example, a request of 500 nodes spends around 1 minute, and it increases to 1.5 minutes if the user changes the neighborhood parameter to 1. These performance tests were performed using the Firebug7 in Mozilla Firefox8.
2.5
Global and local network topology properties of SDN
SNP-Disease Networks were inferred by merging the curated associations between SNP and phenotypes, and in addition we inferred population-specific SDN based in linkage disequilibrium data in DANCE database. For the purposes of further network analy-sis and description of their topology structure, we refer to proposed SDN networks as:
7http://getfirebug.com/
Introduction 21
Figure 2.7: Layout fit execution time in relation to the number of nodes.
a) SDN, which is the original network presented in DANCE, b) SDN-African, which contains SNP nodes represented by ”rs” id and edges labeled with LD from African populations. b) SDN-European, which contains edges labeled with LD from European populations and SDN-Asian, which includes LD edges from Asian populations. For all these networks we discuss the biological implications of variants based on their topolog-ical disposition in the SDN network.
Differences between the SND network and the population-specific networks includes relabel of the nodes that are risk-alleles by keeping only the rs identification as the node label, as well as adding edges relating to the linkage disequilibrium values, that are distinct for each population. To investigate the effects of LD in the networks, the original network was restructured by removing the nucleotide (A, C, G and T) from node labels of the risk-alleles. This procedure removes the redundancy in labels, once the same SNP can be relate to more than one nucleotide. One effect of removing the nucleotide of risk-alleles is the decrease in the number of nodes and edges in the network. As result, the network with SNPs and phenotypes has 12.619 nodes, which 11898 are SNPs and 721 phenotypes.
2.5.1 Global Topology Properties
In order to investigate global relations between SNPs and complex phenotype we com-puted some properties of network connectivity. Essentially, the connectivity of a network can be explored by calculating the number of connected components. Computing the number of connected components help us to verify if each human phenotype presents a tendency to have a distinct genetic architecture. Also, high numbers of connected com-ponents suggests lower connectivity. Likewise, low connectivity is represented by the low average number of neighbors, high values of the characteristic path length between the nodes, and the high diameter number of the network.
We summarized the SDN topological properties in the Table 2.2. Our findings indicate that:
1. The SDN presents the most disconnected network with 391 connected components. This number of components reflects that some phenotypes have their particular and unique genetic architecture, that is specific phenotypes do not share associated risk-alleles with others phenotypes.
2. The largest connected component of the network, denoted as the giant component of comprises 9842 nodes and 10829 edges, which 305 are phenotypes that shares at least one risk-allele out of the 9537 risk-alleles.
Table 2.2: SNP-Disease Networks properties in different perspectives.
Network Properties SNP-Disease Networks
Risk-Alleles AFR EUR ASN Multi-graph Number of Nodes (SNPs) 12380 12619 12619 12619 12619
Number of Nodes (Phenotypes) 721 721 721 721 721
Number of Edges 13731 15360 17982 17779 24093
Connected components 391 296 261 250 231
Diameter 22 19 19 25 19
Caracteristic Path lenght 7.6 6.7 6.5 6.6 6.6
Avg. Number of Neighbors 2.0 2.4 2.8 2.8 3.0
Partners of multi-edges - - - - 3600
For subsequent analysis, we integrate the LD data between SNPs (rs ids) by considering a high LD (r2 >0.7) from Africa, European and Asian populations. Now, SNPs connect to other SNPs by integrating LD data. The addition of LD edges implicates in changes in topology structure of the networks, and it is viable to quantify these changes and impact on the the connectivity of nodes. By observing the network properties results in Table 2.2 we make some considerations, as follows:
Introduction 23
the networks were aggregated to the giant network component, thus reducing the number of components.
2. Comparing the SDN with population-specific networks, we noted that including LD edges also decreases the diameter number of DDN-African and DDN-European. In opposite, the SDN-Asian network shows a singular increase in the diameter. To explain this increase, we found that a smaller component were aggregated to the giant component by LD edges, so the longest shortest path increases in length.
3. Another consequence of including LD edges is the increase in the number of SNP node neighbors (degree of a node). The average number of neighbors for the SDN whole network is equals to 2, which indicates low connectivity in the network. Adding LD edges the number of neighbors subtly increases for the population-specific networks.
4. The characteristic path length of the SDN network (around 7.6) also indicates tight relationships between risk-alleles and phenotypes and even do not decreases considerably adding LD edges.
5. After the integration of the SND-African, SDN-European and SDN-Asian networks in one bipartite multi-graph, with all LD edges, we observe that 3600 SNPs are partners of multi-edges. SNPs which are partners of multi-edges means that they are linked by linkage disequilibrium in at least two populations. This is an impor-tant consideration for functional variant analysis that aims to identify additional causal SNPs.
2.5.2 Local Topology Properties
Understanding the network topology properties of the SDN gives a global view of the interconnections between the network elements (phenotypes, risk-alleles and their con-nections). Still, exploring network topology properties of risk-alleles is essentially to extract knowledge from a local view of the networks. In this way, for functional pur-poses we focus on analyzing the SDN with risk-alleles, which is annotated with allele frequency andFST. We investigated three main network properties for risk-alleles:
The degree distribution for risk-alleles indicates that few risk-alleles relate to more than two phenotypes (see Figure 2.9a). In absolute numbers, 11543 (93%) risk-alleles relate to only one phenotype. The risk-alleles with highest degree (hubs in the network), that is, the variants with high numbers of associations are: rs1260326-T (GCKR - Glucok-inase Regulator), rs1800562-A (HFE - Hereditary Hemochromatosis), and rs3184504-T (SH2B3 - SH2B Adaptor Protein 3). The three risk-alleles are associated with 18, 14, 11 phenotypes respectively as shown in the Figure 2.8 and are in exonic regions as indi-cated by the represented distribution in Figure 2.10. These phenotypes are classified in metabolic, hematological and cardiovascular medical classes. Considering the risk-allele frequency all three SNPs presents low frequency in Africans. The rs1260326-T presents moderated frequency (fASN = 0.57) in and Europeans, and the rs3184504-T are more
frequent in Europeans (see Table 2.3) than in Africans and Asians.
The most associated risk-allele rs1260326-T maps to the gene GCKR located in the chromosome 2 at 2p23.3 region. The rs1260326-T has node degree equal to 18 and is differentiated (0.11) in African and European populations. It is associated with blood metabolite levels, C-reactive protein, cardiovascular disease risk factors, choles-terol, chronic kidney disease, coffee consumption (cups per day), glycemic traits, gout, hypertriglyceridemia, lipid related, lipoprotein-associated phospholipase a2 activity and mass, liver enzyme levels, platelet count, serum, albumin level, serum total protein level, triglycerides, two-hour glucose challenge, and urate levels.
The distribution of all SNPs in splicing regions revels only two GWAS hits, which both are associated with only one phenotype, as indicated by the degree. The rs2071426 SNP is in the splicing region of gene CYP2C8 and is associated with blood metabolite levels. It has high frequency in Asian populations (fAF R = 0.76, fEU R = 0.72, fASN = 0.93),
but presents low allele frequency differentiation (0.002, 0.05, 0.07) between African and European, African and Asian, and European and Asian pairs of populations. Consulting DANCE, we found that this SNP is in linkage disequilibrium (r2= 0.97) with rs1934955, located in the intergenic region of CYP2C9 and CYP2C8. Second, rs13394619 is a SNP that maps to GREB1 gene, previously associated with obesity and endometriosis. In terms of allele frequency, this SNP is less frequent in African populations and it has moderate allele frequency in European and Asian populations (fEU R = 0.48, fASN =
0.47).
Variant Risk-allele Frequency Fst
Chr Region Gene SNP Risk allele AFR EUR ASN AFRxEUR AFRxASN EURxASN
2 2p23.3 GCKR rs1260326 T 0.11 0.41 0.57 0.117 0.236 0.025 6 6p22.2 HFE rs1800562 A 0 0.05 0 0.025 0 0.025 12 12q24.12 SH2B3 rs3184504 T 0.03 0.47 0 0.258 0.0152 0.307
Table 2.3: SNPs with the three highest node degree - hubs.
Introduction 25
Figure 2.8: Disease Network for SNP hubs. Filters used: Network = SNP-Disease Network, Ancestry = Risk-allele Frequency - African, SNP - Risk-allele =
rs1260326-T, rs1800562-A, rs3184504-T
connectivity in the network, in concordance with the large diameter (around 20) and the large characteristic path length of the network (around 7). This number indicates tight relationships between risk-alleles and phenotypes in the network and low genetic overlap between phenotypes. The genetic overlap will be more discussed in the next sections. For instance, considering phenotypes with most genetic associations as hubs in the network, the top list of hubs includes: height (d = 652), obesity (d = 547), body mass index (d = 419), IgG related (d = 388), cholesterol (d = 293), schizophrenia (d = 232), blood metabolite levels (d = 214), type 2 diabetes (d = 191), metabolite levels (d = 190), and menarche (d = 178).
Figure 2.9: (A) Degree distribution of risk-alleles. (B) Degree distribution of pheno-types. (C) Bipartite clustering of risk-alleles in function of degree. (D) Closeness of risk-alleles in function of degree. E (E) Bipartite clustering in function of closeness for
risk-alleles.
with low closeness are linked to more than one disease (see Figure 2.9d). In this case SNPs with high degree and low closeness are embedded in the center of giant component of the network and are key nodes that may interact with other SNP nodes to regulate the genetic mechanisms of many diseases. The clustering coefficient distribution is not correlated with the closeness distribution. Low and high values of clustering coefficient are related to low values of closeness (see Figure 2.9e).
To discuss the role of risk-alleles in the network we focused on SNPs with highest degree in function of the node cut by FST between African and European populations. The
FST for the pairs African-European, African-Asian and European-Asian were draw in
the Figure 2.11.
With the previous considerations, most SNPs are related toFST values less or equal to
Introduction 27
Figure 2.10: Distribution of Fst in function of SNP degree stratified by functional class of SNPs.
European populations presents four risk-alleles with FST greater than 0.75, which are:
rs2814778-C located at UTR5 region of ACKR1/DARC gene, two exonic risk-alleles rs1426654-A (SLC24A5) and rs16891982-C (SLC45A2), and the risk-allele rs1834640-G in a intergenic region of genes LINC01491 and SLC24A5. Also these three last risk alleles are differentiated in European and Asian populations.
and the and the rs11649653-G is located at intergenic region of genes CTF1 and FBXL19-AS1. The rs11649653-G may be an important genetic factor that impacts the prevalence of the metabolic syndrome in white people. It is well known by cross-sectional studies that low prevalence of higher triglyceride, and low HDL levels in blacks than whites for children and adults, moreover blacks tend to develop obesity, hypertension, and diabetes [41].
The highest degree is associated with the risk-allele rs3184504-T. It is linked to 11 pheno-types ( -2 microglubulin plasma levels, blood metabolite levels, coronary artery disease, diabetes, diastolic blood pressure, eosinophil relates, hypothyroidism, platelet count, red blood cell traits, rheumatoid arthritis, systolic blood pressure). These phenotypes are classified in the following medical classes: cardiovascular, metabolic, hematological and immune. The risk-allele rs3184504-T maps the gene SH2B3 (SH2B Adaptor Protein 3), located on chromosome 12 and region 12q24.12, and it has low frequency in Africans, moderate frequency in Europeans and no frequency in Asians. Fst between Africans and Europeans is equal to 0.258, between Africans and Asians 0.015 and between Europeans and Asians is greater 0.307.
In this network, the risk-allele rs1260326-T maps to the gene GCKR located in the chro-mosome 2 at 2p23.3 region. The rs1260326-T presents the highest node degree, which is equal to 18, and it is differentiated (FST =0.11) in African and European populations. It
is associated with blood metabolite levels, C-reactive protein, cardiovascular disease risk factors, cholesterol, chronic kidney disease, coffee consumption (cups per day), glycemic traits, gout, hypertriglyceridemia, lipid related, lipoprotein-associated phospholipase a2 activity and mass, liver enzyme levels, platelet count, serum, albumin level, serum total protein level, triglycerides, two-hour glucose challenge, and urate levels.
To investigate and identify the role of SNPs with highFST in the SDN network, we cut
risk-alleles nodes considering the FST greater or equal to 0.12. This value represents
the average FST between African and European populations and were considered as
threshold for cutting nodes. Concerning the node cut by FST attribute, it results in
changes on the topology of the SDN network. These changes were describe as follows:
1. The node cut byFST between African and Europeans results in a SDN sub-network
with 2155 risk-alleles and 499 traits (in total 2604 nodes). The number of nodes in the large component represents 45% (1192 nodes and 1272 edges) of the whole network with 2604 nodes and 2376 edges between risk-alleles and phenotypes. Risk-alleles in overlap, that is, risk-alleles linked to more than one phenotype are in total 143, and represents 6% of the risk-alleles with average FST greater than
0.12 for African and Europeans. Around 76% of risk-alleles in overlap are in the largest component of the network.
2. The node cut by FST between African and Asians resulted in the largest network
Introduction 29
Figure 2.11: (A) Degree distribution of risk-alleles in function of Fst. (B) Clustering distribution of risk-alleles in function of Fst. (C) Closeness of risk-alleles in function of
degree.
component comprises 1367 risk-alleles, 120 traits and 1602 edges. This network shows 196 risk-alleles in overlap and 137 are located in the largest component. Considering the whole network and the largest component, the network of risk-allele differentiation between Africans and Asians stands out with the highest number of differentiated SNPs.
3. The node cut by FST between Asian and European presents a small network
with 1608 risk-alleles linked to 400 phenotypes, indicating more similarity between Europeans and Asians. Comparing to the node cut between African-European and African-Asian, after the cut network presents less SNPs with FST ≤ 0.12.
The set of SNPs in overlap (d≥ 2) comprises 117 SNPs out of 1608 in high allele differentiation.
2.6
Global and local network topology properties of DDN.
based on the pattern of LD. From this consideration we investigate how the pattern of LD can change the network structure of the DDN and more important investigate their differences in connections between complex phenotypes.
Previously, the DDN (see Section 2.3.2) were inferred based on the SDN (described in Section 2.3.1) and the overlap were computed based on the standard JC. For each population-specific SDN we projected the African, European and the DDN-Asian. We extend the standard JC to take into account SNPs in high linkage disequi-librium (r2 > 0.7), which we call JC’. Thus, we include SNPs that may regulate the progression of complex phenotypes by indirect mapping based on linkage disequilibrium for each population. For example, the JC computed in the network 2.12a is equal to 1. A variantV is associated to phenotypesAandB. The intersection is equal to 1, and the union of the variants is 1 as well. Figure 2.12b shows two phenotypesAandB, whereA is associated with variantsV1 andV3 while phenotypeB is associated withV2 andV3. Considering the standard JC, the intersection is equal to 1 and the union is equal to 3, so the standard JC is equal to 0.33. By including SNPs in high linkage disequilibrium, the JC of phenotypes A and B is now 1, since the intersection between A and B is now equal to 3 (with V1 indirectly associated with B and V2 indirectly associated with A) and the union is equals to 3. At last, we maintain the phenotype nodes that shares at least one SNP with other phenotype node, that is when the JC or the JC’ is greater than 0.
(a)Jaccard Coefficient. (b) Jaccard Coefficient
consid-ering LD edges.
Figure 2.12: In (A) the Jaccard Coeffient is directly computed considering the di-rected associations with phenotypes (AandB in black nodes) and variants (V in white nodes). In (B) the JC is computed considering the LD edges (in red), thus, variants
V1 and V2 are indirectly associated with phenotypes B and A, respectively.
We computed topology properties for each DDN, after computing the JC and the JC’, which includes linkage disequilibrium. The number of connected components, clustering coefficient, diameter, characteristic path length and the average number of neighbors were computed for each DDN and summarized in the Table 2.4.