Low frequency geomagnetic ®eld ¯uctuations at low latitude
during the passage of a higher pressure solar wind region
U. Villante, P. Francia
Dipartimento di Fisica, Universita' dell'Aquila, L'Aquila, Italy
Received: 7 June 1996 / Revised: 6 January 1997 / Accepted: 20 January 1997
Abstract. The passage of a higher pressure solar wind region at the Earth's orbit marked the onset of low latitude L1
:6 ¯uctuations in the frequency range
(0.8±5.5 mHz) for both the horizontal geomagnetic ®eld components. Spectral peaks mostly occur at the same frequencies as the spectral enhancements which ap-peared in the long term analysis of experimental measurements from the same station and were tenta-tively interpreted in terms of ground signatures of global magnetospheric modes. A comparison with simulta-neous observations discussed by previous investigations allows us to conclude that the same set of frequencies is enhanced in a wide portion of the Earth's magneto-sphere.
Introduction
In a recent analysis of the power spectra of the geomagnetic ®eld components at L'Aquila (Italy,
L1
:6, Francia and Villante, 1997) we found statistical
evidence for daytime power enhancements at discrete frequencies of the order of 1.3, 1.9, 2.5, 3.6 and 4.2 mHz. These frequencies approximately correspond to those ones of events observed at auroral latitudes both in theFregion drift velocities (Ruohoniemi et al., 1991; Samsonet al., 1992a, b; Walkeret al., 1992) and in the ground geomagnetic ®eld ¯uctuations (Samsonet al., 1992b; Bouletet al., 1992; Ziesolleck and Mc Diarmid, 1994) and interpreted in terms of AlfveÂn resonances on dipole-like ®eld lines with periods matching the eigen-periods of the driving compressional magnetospheric modes. According to models proposed by several authors (Walker et al., 1992; Samson et al., 1992a; Wright, 1994), in response to some external driving mechanism, the Earth's magnetosphere would act as a
resonant cavity or, more likely, as a wave guide along which waves, re¯ected by a turning point in the inner magnetosphere and by an outer boundary (such as the magnetopause), propagate antisunward. The driven ®eld line resonances were found to be stable in frequency, within a 5±10% margin over time intervals ranging between few hours (Walker et al., 1992) and several months (Samson et al., 1991); on the other hand, in a recent statistical survey of the occurrence of auroral latitude ®eld line resonances, Ziesolleck and McDiarmid (1995) suggested that the apparently stable cavity/wave guide mode frequencies do not necessarily represent a unique set.
In the previous work (Francia and Villante, 1997) we found that the observed ground ¯uctuations might be considered permanent, solar cycle independent features which can be detected approximately at constant frequencies also at low latitudes on both the horizontal components. At low latitude similar low frequency signals have been also examined by Lilley and Bennet (1973), Ziesolleck and Chamalaun (1993) and Bloom and Singer (1995). In particular Ziesolleck and Chama-laun (1993) suggested that these waves might be inter-preted in terms of global compressional modes or large-scale cavity resonances trapped in the magnetosphere.
The occurrence of global magnetospheric modes can be related to several phenomena such as Kelvin-Helm-holtz instability, transient dayside reconnection as well as step variations of the solar wind dynamic pressure. In this sense it is interesting to remark that the low-latitude spectral enhancements were highly ampli®ed during intervals characterized by high solar wind velocities (Francia and Villante, 1997). On the other hand, impulsive geomagnetic disturbances such as SI and
SSCare known to be followed by long period pulsations (5±15 min) at discrete frequencies (Nishida, 1978; Sam-son, 1991). Saito and Matsushita (1967) found that the frequency of the pulsations decreases with the increasing latitude; Fukunishi (1979) proposed that, between
L3
:2 and L4:4 and in the frequency range
3±100 mHz, damped oscillations excited by SSC and
SI contain many spectral peaks and each of them appears to have a dierent location in latitude. Nopper
et al. (1982), moreover, found that a solar wind dynamic pressure step variation triggered a worldwide impulsive disturbance that was accompanied, at L5 ground
stations, by ®eld oscillations consistent with a local resonance. Similarly, Farrugia et al. (1989) found that sudden changes of the solar wind dynamic pressure were accompanied on the ground by disturbances of the geomagnetic ®eld which were more clearly seen at auroral than at higher latitude stations; as authors remarked, higher latitude stations should be located at the feet of ®eld lines which stretch into the polar cap and do not form a resonant cavity.
Interesting experimental results have been more recently obtained by Korotova and Sibeck (1994; K&S hereafter) who analysed simultaneous solar wind, mag-netospheric and ground observations at high, auroral and mid-latitudes observatories to investigate the mag-netospheric response to a series of sharp variations of the solar wind dynamic pressure which occurred in a 3 h interval on November, 24, 1986. They found that the pressure variations excited coherent long period pulsa-tions which were observed over a 30°±50° longitudinal range. As matter of fact, the dominant period of the observed ¯uctuations was found to depend on the observation site, although some common periods were
observed in a wide range of latitudes and longitudes. As the authors remarked, none of the common periods strictly correspond to those identi®ed by previous investigations as resonant oscillations: on the other hand, the observations were made under unusual conditions, namely with a solar wind pressure twice as great as on average conditions.
In the present note we found it interesting to analyse the geomagnetic ®eld observations performed at L'Aquila for the same time interval as investigated by K&S. The results of our analysis show that some peculiar signatures of the active magnetosphere ob-served at high, auroral and middle latitudes are still well detected at L1
:6. We analysed the horizontal
com-ponents (H and D) and found several aspects of the observations which allow interesting comparisons with the results of previous investigations.
Experimental results
As in the previous study (Francia and Villante, 1997), we adopted as original data for the present investigation the 1 min measurements (with a resolution of 1 nT) of the horizontal component H and of the declination D
(expressed in nT) obtained at the L'Aquila Geomagnetic Observatory L1
:6; LTUT1 run by the
tuto Nazionale di Geo®sica. As described by Meloni
et al. (1984), the instrument basically consists of a proton precession magnetometer equipped with two Helmoltz coils.
As discussed by K&S, in the period of interest (November, 24, 1986, 0900±1200 UT, Fig. 2 in their paper) the solar wind speed measured at the IMP 8 position upstream of the dawn bow shock varied approximately between 450 and 500 km/s. Prior to 0925 UT and after 1105 UT, the solar wind density was low (5±10 cm)3) and the IMF strength was high (16±20 nT). In the intervening interval, IMP 8 was imbedded in a solar wind region with higher densities (20±30 cm)3) and lower ®eld strengths (8±12 nT). Step function increases of the solar wind dynamic pressure were detected approximately at 0925±0927, 0934±0937, 1005±1008, 1025±1030 UT, while a sharp pressure decrease was detected at 1101±1103 UT. The interplan-etary magnetic ®eld was generally northward except during the interval 1010±1100 UT. In the post-midnight magnetosphere a series of magnetic ®eld compressions were detected by GOES 5 and GOES 6; the times of the magnetospheric ®eld increases and decreases approxi-mately correspond to those of the solar wind pressure variations. According to K&S, mid and high-latitude Northern Hemisphere ground observations indicated at 0925 UT anSIoccurrence which marked the onset of a disturbed period at all stations; as the authors remarked,
the amplitude of the dayside ground signatures decayed rapidly with decreasing latitude.
Figure 1a shows the behaviour of the geomagnetic ®eld components at L'Aquila in the period of interest. For a better comparison with observations performed at other stations, we also show in Fig. 1b the experimental data as they appear after ®ltering in the same band (0.83±5.56 mHz) proposed by K&S. Figure 1a shows that the whole passage of the higher pressure solar wind corresponds to a sharp variation of equal duration of the low-latitude geomagnetic ®eld elements close to the subsolar point. Dotted lines in Fig. 1a (0925±1103 UT) show that the whole ground perturbation is somewhat delayed with respect to solar wind compression region detected at the IMP 8 position. In particular both components show a prominent variation of the order of 15 nT between 0930±0934 UT, a feature which can be considered consistent with gross estimates of the prop-agation time (6±7 min) between IMP 8 position and ground (Farrugia et al., 1989). It is also interesting to remark that, when compared with observations per-formed at other stations (Fig. 6 in K&S), our low-latitude prenoon observations show a strong similarity with those obtained at higher latitude near or just before local noon (for example at Abisko, Murmansk or Sodankyla).
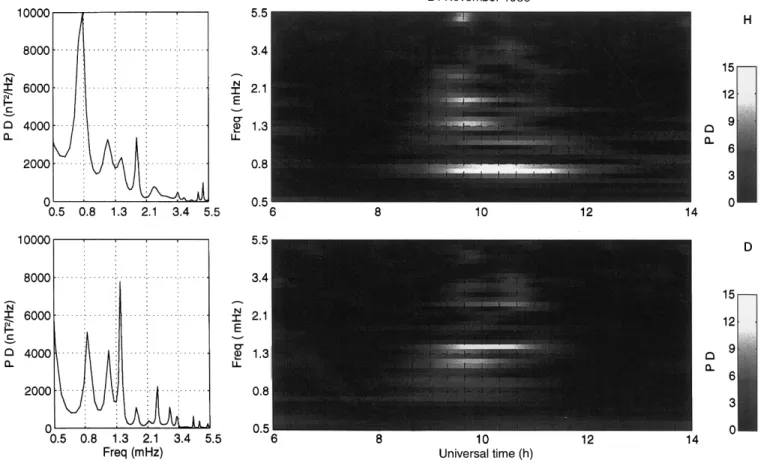
The power spectra evaluated for the same time interval (0900±1200 UT) investigated by K&S are shown Fig. 2. The average power spectra computed by means of the maximum entropy method in the time interval 0900±1200 UT are plotted on theleft
in Fig. 2 (left side) up to frequencies of 5.5 mHz. As in the previous study (Francia and Villante, 1997), the power spectra have been computed by means of the maximum entropy method at order m30 of error prediction ®lter (Vellante and Villante, 1984). The global spectra in Fig. 2 clearly show the appearance of com-mon peaks in theHandDcomponents at 0.8±0.9 mHz (20.8±18.5 min), 1.2 mHz (13.9 min), 1.4 mHz (11.9 min), 1.8 mHz (9.2 min), 2.4 mHz (6.9 min); some evidence for further common spectral enhancements is detected at 3.3±3.4 mHz (5.1±4.9 min) and between 4.3 and 5 mHz (3.8 and 3.3 min). A comparison with the observations performed by K&S provides interesting results in that they found main spectral peaks at 1.2, 1.4 and 1.8 mHz in a wide range of latitudes and longitudes, while peaks at approximately 2.2, 2.5, 3.2, 4.5 and 4.9 mHz were also observed. We actually found major spectral peaks at the lowest frequencies (0.8±0.9 mHz): in this sense it is very interesting to note that, despite ®ltering procedure, K&S (Fig. 8) also reported evidence for signi®cant power enhancements approximately at 0.9 mHz at several high, auroral and midlatitude stations.
The dynamic power spectra shown in the right side of Fig. 2 (as computed following the frequency-time anal-ysis method suggested by Dziewonski et al., 1969, with
N 40 ®lters centred on logarithmically equispaced
frequencies and the parameter a200 characterizing
the bandwidth of each ®lter) provide a rough indication of the time sequence of dierent spectral peaks and suggest the appearance of dierent spectral enhance-ments occurring in response to dierent solar wind pressure variations. For example, two dierent signal intensi®cations, mostly in the D component, at the
frequencies 2.4 and 3.3 mHz are detected approximately between 0930 and 0950 UT and between 1025 and 1050 UT. In addition, within the limits of the present analysis, the results obtained for theHcomponent may allow an interesting comparison with the conclusions drawn by K&S. They found, indeed, evidence for regular 8±10 min period oscillations soon after the SI both at auroral (0925±1020 UT) and at high (0925±1000 UT) latitudes while lower frequency modes (13±15 min) were later detected at some high-latitude stations approxi-mately after 1000 UT. Consistently, the results of Fig. 2 (right side) show that at low latitude the highest values of the spectral peaks appear soon after the SI at 1.4 mHz (12 min) and 1.8 mHz (9 min), while the peak at 1.2 mHz (14 min) emerges more clearly at a later stage.
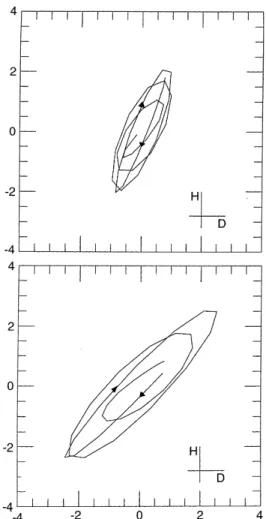
We found also interesting to analyse in more detail the 1.4 and 1.8 mHz ¯uctuations over the time interval 0925±1000 UT in which they emerge more clearly. In particular we estimated the correlation coecient r
between the horizontal components (®ltered in the two bands 1.1±1.6 mHz and 1.6±2.0 mHz) and found that it attains maximum values (respectively r0
:98 and r0
:97, which correspond to a con®dence interval
greater than 99.9%) for a 1 min time lag which can be considered indicative for an elliptical polarisation of the two modes. The polarisation patterns for the same time
interval (Fig. 3) show a clockwise rotation, as seen downward in the direction of the ambient magnetic ®eld, which is the same as found by K&S at high latitudes in the midnight and morning sectors. Nevertheless, in the further time interval (1005±1050 UT) the polarisation pattern becomes less clear and shows evidence for a counterclockwise rotation which is also consistent with the K&S observations at high-latitude morning side stations (Mould Bay and Baker Lake).
Summary and discussion
We examined the low latitude geomagnetic ®eld obser-vations during an active 3 h interval associated with the passage of a higher pressure solar wind region at the Earth's position. When compared with suggestions of previous investigations and simultaneous higher latitude observations, the results of the present analysis allow us to draw some interesting conclusions.
®eld components and a comparison among dierent stations shows a strong similarity with observations obtained at dierent latitudes near or just before local noon. In particular, the SI occurrence marked the onset of a disturbed period also at low latitudes with a considerable quantity of energy of geomagnetic ®eld ¯uctuations at discrete frequencies. We found some evidence for the appearance of dierent spectral peaks at dierent times in the period of interest, suggesting that dierent geomagnetic ®eld ¯uctua-tions are generated by dierent solar wind pressure variations.
b. When compared with higher latitude observations, the power spectra show the appearance of common peaks at several frequencies, suggesting that the coherent ¯uctuations observed by K&S extend to a wide sector of the dayside magnetosphere. In partic-ular, the peaks occurring at 1.2±1.4 and 1.8 mHz, which were considered by K&S main spectral features of a wide range of latitudes and longitudes, ®nd clear correspondence in the present low-latitude observa-tions. In addition, in agreement with K&S, who found the occurrence of dierent peaks between 2.2 and 5 mHz over the whole range of latitudes, power enhancements are also detected at low latitude between 2.4 and 5 mHz. Moreover the 1.4 and 1.8 ¯uctuations which initiated in the time interval soon after theSIevent are elliptically polarized and show a clockwise rotation. The observed features seem to follow the same pattern as observed by K&S at high-latitude stations located in the midnight and morning side sectors while, as K&S remarked, at auroral latitudes in the morning sector the same wave train rather shows an opposite polarization.
c. A comparison with the statistical results proposed by Francia and Villante (1997) also provides interesting conclusions. Indeed, all the observed peaks appear approximately at the same frequencies (within 5%± 10%) as the spectral enhancements identi®ed in their long-term analysis and tentatively interpreted in terms of low-latitude signatures of global magneto-spheric modes. Francia and Villante (1997) also remarked that the spectral enhancements much more clearly emerge during a two month interval charac-terised by high solar wind velocities. Similarly, we ®nd that in this particular period associated with a higher dynamic pressure of the solar wind, all the spectral peaks exceed approximately by a factor of 10 the average values proposed by the statistical inv-estigation. In addition, as proposed by Francia and Villante (1997) for dayside observations, most of the power enhancements simultaneously appear (al-though with dierent energies) in theHandDpower spectra. Similar results were obtained by Nopperet al. (1982), Ziesolleck and Chaumalaun (1993) and Bloom and Singer (1995) who also found ¯uctuations on both the geomagnetic ®eld components. It is also interesting to observe that, as in the previous statis-tical analysis, we found evidence for a lowest frequency mode (0.8 mHz in the H spectra, 0.9 mHz in the D spectra, 0.7 mHz in Francia and
Villante, 1997) which in the period of interest (despite ®ltering procedure) is also detected by K&S in higher latitude measurements.
Acknowledgements. The authors are grateful to Dr. A. Meloni, (Istituto Nazionale di Geo®sica, Roma) who made available geomagnetic ®eld observations from L'Aquila Geomagnetic Ob-servatory. This research activity at L'Aquila is supported by MURST (40% and 60% contracts) and by GIFCO/CNR.
Topical Editor K.-H. Glaûmeier thanks C. W. S. Ziesolleck and J. VeroÈ for their help in evaluating this paper.
References
Bloom, R. M., and H. J. Singer, Diurnal trends in geomagnetic noise power in the Pc2 through Pc5 bands at low geomagnetic latitudes,J.Geophys.Res.,100,14943, 1995.
Boulet, D., M. Bradley, and T. J. Hughes,Survey of occurrences of ®eld line resonances with frequencies of 1.3, 1.9 and 2.6 mHz in one year of CANOPUS magnetometer observations (abstract),
EoS Trans.AGU, 73(14) Spring Meet.suppl.,251,1992. Dziewonski, A., S. Bloch, and M. Landisman,A technique for the
analysis of transient seismic signals,Bull.Seism.Soc.Am.,59, 427, 1969.
Farrugia, C. J., M. P. Freeman, S. W. H. Cowley, D. J. Southwood, M. Lockwood and A. Etemadi, Pressure driven magnetospheric motions and attendant response on the ground,Planet.Space Sci.,37,589, 1989.
Francia, P., and U. Villante, Some evidence of ground power enhancements at frequencies of global magnetospheric modes at low latitude,Ann.Geophysicae,15,17, 1997.
Fukunishi, H.,Latitude dependence of power spectra of magnetic pulsations near L4 excited by SSC's and SI's, J. Geophys. Res.,84,7191, 1979.
Korotova, G. I., and D. G. Sibeck, Generation of ULF magnetic pulsations in response to sudden variations in solar wind dynamic pressure,Solar Wind Source of Magnetospheric Ultra-Low-Frequency Waves, Geophysical Monograph81,AGU, 265, 1994.
Lilley, F. E. M., and D. J. Bennet,Micropulsations recorded by an array of magnetic variometers,J.Geophys.Res.,78,1603, 1973. Meloni, A., F. Molina, P. Palangio, Q. Taccetti, and A. De Santis, Automatic digital recording of geomagnetic elements by means of a proton precession magnetometer, Geophys. Surv.,6, 339, 1984.
Nishida, A., Geomagnetic diagnosis of the magnetosphere,Phys.
Chem.Space,9,96, 1978.
Nopper, R. W. Jr., W. J. Hughes, C. G. MacLennan, and R. L. McPherron,Impulse excited pulsations during the July 29, 1977 event,J.Geophys.Res.,87,5911, 1982.
Rouhoniemi, J. M., R. A. Greenwald, K. B. Baker, and J. C. Samson,HF radar observations of Pc5 ®eld line resonances in the midnight/early morning MLT sector, Geophys. Res. Lett., 96,15697, 1991.
Saito, T, and S. Matsushita, Geomagnetic pulsations associated with sudden commencements and sudden impulses, Planet.
Space Sci.,15,573, 1967.
Samson, J. C.,Geomagnetic pulsations and plasma waves in the Earth's magnetosphere, inGeomagnetism, Ed, J. A. Jacobs vol 4, 481, 1991.
Samson, J. C., R. A. Greenwald, J. M. Ruohoniemi, T. J. Hughes, and D. D. Wallis, Magnetometer and radar observations of magnetohydrodynamic cavity modes in the Earth's magneto-sphere,Can.J.Phys.,69,929, 1991.
Samson, J. C., D. D. Wallis, T. J. Hughes, F. Creutzberg, J. M. Ruohoniemi, and R. A. Greenwald, Substorm intensi®cations and ®eld line resonances in the nightside magnetosphere,
J.Geophys.Res.,97,8495, 1992b.
Vellante, M. and U. Villante,Maximum entropy spectral analysis of arti®cial sinusoidal signals,J.Geophys.Res.,89,351, 1984. Walker A. D. M., J. M. Ruohoniemi, K. B. Baker, R. A. Greenwald,
and J. C. Samson, Spatial and temporal behavior of ULF pulsations observed by the Goose Bay HF radar,J. Geophys.
Res.,97,12187, 1992.
Wright A. N., Dispersion and wave coupling in inhomogeneous MHD waveguides,J.Geophys.Res.,99,159, 1994.
Ziesolleck, C. W. S., and F. H. Chamalaun, A two-dimensional array study of low latitude Pc5 geomagnetic pulsations,
J.Geophys.Res.,98,13703, 1993.
Ziesolleck, C. W. S., and D. R. McDiarmid,Auroral latitude Pc5 ®eld line resonances: quantized frequencies, spatial character-istics, and diurnal variation,J.Geophys.Res.,99,5817, 1994. Ziesolleck, C. W. S., and D. R. McDiarmid, Statistical survey of
auroral latitude Pc5 spectral and polarisation characteristics,