Flux and Dose Rate Evaluation of Iter System Using MCNP5
Arione Ara´ujo, Claubia Pereira, Maria Auxiliadora Fortini Veloso, and Antonella Lombardi Costa Departamento de Engenharia Nuclear, Escola de Engenharia, Universidade Federal de Minas Gerais
Av. Antˆonio Carlos 6627 - Pr´edio do PCA - sala 2299 - Pampulha CEP 31270-010 Belo Horizonte - Minas Gerais - Brasil
Hugo Moura Dalle
Servic¸o de Engenharia de Reatores e Sistemas, Centro de Desenvolvimento da Tecnologia Nuclear - Comiss˜ao Nacional de Energia Nuclear Av. Antˆonio Carlos 6627 - Pampulha
CEP 31270-010 Belo Horizonte - Minas Gerais – Brasil (Received on 18 November, 2009)
The International Thermonuclear Experimental Reactor (ITER) will perform Deuterium-Tritium (DT) plasma experiments and the neutrons production rate at 14.1 MeV will achieve the level of 1013n
.cm−
2
.s−
1. In this
work, the neutron flux and the dose rate during ITER operation has been calculated using the one-dimensional model of the Monte Carlo code MCNP5 and the FENDL/MC-2.1 nuclear data library. The neutron flux and dose rate associated during normal ITER operation were determined along the radial machine direction. Calculations for two different types of concrete compositions were performed to investigate the impact of the bioshield filling materials on the dose rate estimation. The results show that the dose rate level near to the outer wall of the tokamak hall is close to the allowable limit dose. Taking into account the use of large boron concentration in the biological shield concrete (2.9% weight fraction), it was obtained a dose rate reduction by one order of magnitude. The dose rate is dominated by the secondary gamma ray. The magnitude of the dose rate on the outside hall of bioshield during normal ITER operation can not be considered low in accordance with the result found in the simulation performed in this work, i.e., 1µ Sv.h−
1.
Keywords: Flux; Dose; ITER; MCNP
1. INTRODUCTION
The ITER is a tokamak with elongated plasma and single null poloidal divertor. The nominal inductive operation pro-duces a DT fusion power of 500 MW for a burn length of 400 s, with a pulse repetition period of 1,800 s. The ITER will per-form experiments with DT plasma and the neutrons produc-tion rate at 14.1 MeV will achieve the level of 1013n.cm−
2
.s−
1
[1]. The high energy neutron flux generated in the plasma chamber will penetrate the machine. Therefore, for safe op-eration and facility conservation, it is very important to pre-dict the neutron flux and the dose rate distributions during the ITER operation. In this way, studies of dosimetry and radi-ation protection associated with fusion reactor operradi-ation are essential. Some of such investigations were performed for the tokamak HT-7U [2] and for the ITER [3].
The goal is to obtain knowledge about ITER and simulate it using MCNP5 (Monte Carlo N-particle) [4] and in the fu-ture, to study the insertion of a transmutation layer in the sys-tem and evaluated its depletion and burnup using MCNPX 2.6.0 (Monte Carlo All-Particle Transport Code System)[9] . Based on references [1, 2 and 3] this work simulates a sim-plified ITER system and analyses its neutron fluxes and dose rates. The present study evaluates the effectiveness of two different types of concrete shielding composition. Both con-crete compositions investigated have basically two important differences from the viewpoint of nuclear protection: the den-sity and boron concentration values. In the calculation, the neutron fluxes and their dose rates were determined for some energy groups, namely:
1. thermal neutrons (up to 1 eV),
2. epithermal neutrons (from 1 eV up to 100 keV), 3. high-energy neutrons (100 keV up to 2 MeV) and,
4. neutrons that lost energy after some interaction (above 2 MeV).
To achieve the goal, the mappings of neutron and photon fluxes were performed and their contributions to the dose rate along the radial direction were defined. Finally the total dose rate was also determined.
To achieve the desired results it was used the MCNP5 (Monte Carlo N-particle) code [4] and FENDL (Fusion Eval-uated Nuclear Data Library) data library [5]. For dose rate calculation only the transport of particles emitted by the plasma was considered. The delayed photons from activated materials and the tritium dispersed in the air were not consid-ered in the calculations for this work.
2. METHODOLOGY
ITER is a complex and large machine that uses several technologies of last generation and its project has high detail level. However, to the propositions of the present study, that is to obtain knowledge, it was adopted the one-dimensional modeling technique. However, to ensure the reliability of the particles transport it was necessary to specify accurately the composition and thickness of the materials along the radial way.
2.1. Geometric Model
or-der to represent the different layers of each component along the radial reactor direction.
FIG. 1: Radial one-dimensional model profile (scale out). The blank spaces are vacuum areas
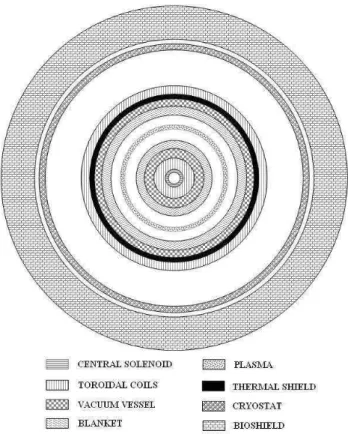
This simplified model disregards the detailing of more complex components, omits the vertical and horizontal slits between blanket modules and does not consider components that do not involve the whole machine. The top view of the geometry used in the modeling is shown in the Fig. 2.
FIG. 2: Top view of geometric model. (scale out). The blank spaces are vacuum areas
2.2. Materials
The MCNP code performs the transport of neutrons, pho-tons and electrons, or the combined transport of these parti-cles, where the random path of the particles is simulated on the basis of the stochastic laws with interaction probability inserted from libraries of nuclear cross section. The accuracy obtained with the MCNP simulation depends on several un-certainties involved in the data from nuclear cross sections and also the uncertainty of the statistical calculation. There-fore, the detailing of the material composition for each reactor component is highly relevant to obtain a reliable prediction to the individual history of each neutron in the simulation.
Table 1 presents the reactor systems used in this present study with the thickness and materials for each one of them: central solenoid (CS), blanket (BLK), vacuum vessel (VV), vacuum vessel thermal shield (VVTS), toroidal field coils (TFC), cryostat (CRY) and bioshield (BSD).
In agreement with ITER guidelines [1], 84% of steel and 16% of water were used in the filling composition of the blan-ket shield block. The vacuum vessel was filled with 60% of steel and 40% of water. Due to the CS composition complex-ity, this module was assumed to be composed by 27% Nb3Sn
+ 30% Incoloy 908 + 30% SS316 + 10% resins + 3% Al2O3.
The small details of the CS composition were not considered in the present model to simplify. The composition of the ma-terial filling the CS coils and TF coils was assumed to be 45% Nb3Sn + 50% Incoloy 908 + 5% Al2O3.
In order to evaluate the effectiveness of shield, the particles transport was conducted for two types of concrete composi-tion for the bioshield. The first concrete type has the typical composition of the Los Alamos concrete (as specified in the MCNP manual) with the following change: 0.07% of sili-cium has been replaced by boron. This composition was used by Junker and Weller, 1998 [6]. This first concrete type was called in our study by C-01. The second concrete composition named in our study by C-02 was studied by Khripunovl et al, 1997 [7] and it is considered an alternative to specific shield of fusion plant. The compositions of both types of concrete used in the bioshield are shown in the Table 2.
2.3. Source
Table 1. Material and thickness adopted for the simulated component models
COMPONENT THICKNESS (cm) MATERIAL
Insertion Module 80 a 90 27% Nb3Sn + 30% Incoloy 908 + 30%
SS316 + 10% resins +3% Al2O3
Superconductor and
insulator 90 a 180
45% Nb3Sn + 5% Al2O3 + 50% Incoloy
908 CS
Support 180 a 200 SS316L(N)IG
Wall Box 220 a 229.5 SS316L(N)IG
Superconductor and
insulator 229.5 a 310.5
45% Nb3Sn + 5% Al2O3+ 50% Incoloy
908 TFC
Wall Box 310.5 a 320 SS316L(N)IG
VVTS Wall 320.6 a 322.8 SS316L(N)IG
Wall 322.8 a 328.8 SS316L(N)IG
Filling 328.8 a 350.5 84% SS316L + 16% H2O VV
Wall 350.5 a 356.5 SS316L(N)IG
Shield Block 357 a 399 60% SS304B7 + 40% H2O
Waster Heat 399 a 401 Copper BLK
First Wall 401 a 402 Beryllium
Plasma Chamber 402 a 853 Vacuum
First Wall 853 a 854 Beryllium
Waster Heat 854 a 856 Copper BLK
Shield Block 856 a 898 60% SS304B7 + 40% H2O
Wall 898.5 a 904.5 SS316L(N)IG
Filling 904.5 a 967.5 84% SS316L + 16% H2O VV
Wall 967.5 a 973.5 SS316L(N)IG
VVTS Wall 973.5 a 975.5 SS316L(N)IG
Wall Box 976 a 985.5 SS316L(N)IG
Superconductor and
insulator 1085.5 a 1165.5
45% Nb3Sn + 5% Al2O3 + 50% Incoloy
908 TFC
Wall Box 1165.5 a 1176 SS316L(N)IG
CRY Wall 1400 a 1410 SS304L
BSD Wall 1455 a 1655 Concrete (2 type)
Table 2. Concrete compositions used
Elements C-01 Composition (ρ = 2.2505 g.cm-3)
C-02 Composition (ρ = 2.43 g.cm-3)
H 0.4532 0.96
B 0.07 2.90
O 51.2597 51
Na 1.1553 -
Mg 0.3866 0.42
Al 3.5548 0.79
Si 35.9664 15.2
K 1.4219 -
Ca 4.3546 22.5
Fe 1.3775 0.5
C - 5.31
S - 0.42
2.4. Other Adjusts and Output Solicitations
The neutron and photon fluxes along of each cylindrical surface in the radial direction were requested. For a better understanding of the neutrons behavior in the different reac-tor systems, it was also requested data about the neutron and photon fluxes for different energy ranges. To calculate the dose rate due neutron and photons, it was used the conversion factor published by the International Commission on Radio-logical Protection (ICRP-21). The transport mode was set to photons and neutrons. The transport of electrons has not been considered because it does not increase the processing time. To obtain the statistical accuracy recommended, i.e.,
devia-tions of less than 10%, it was necessary to monitor a large number of neutrons stories (approximately 106 primary neu-trons).
3. RESULTS AND ANALYSIS
3.1. Neutron Flux
The neutron flux was determined for different energy ranges in all cylindrical surfaces along the radial machine di-rection from the plasma chamber to the outer surface of the bioshield. The mapping of the neutrons flux was performed to both types of concrete compositions used in this study. The evolution of neutron flux along the surface of the C-01 and C-02 components were plotted as can been verified in the Fig-ures 3 and 4, respectively.
FIG. 3: Neutron flux along the radial way to concrete composition C-01
3.2. Dose Rate
The results achieved for the dose rates due to neutrons and photons are shown in the Figures 5 and 6 for the con-crete shield C-01 and C-02, respectively. Due to the high boron concentration presents in the concrete C-02 (2.9% ver-sus 0.07%), the dose rate due neutrons had a sharp reduction of approximately 3 magnitude orders in comparison with the concrete C-01. The highest density of the concrete C-02 (2.43g.cm−
3versus 2
.25g.cm−
3to the C-01) resulted in a
re-duction of about 1 magnitude order in a dose rate due to pho-tons in comparison with the concrete C-01.
The results for the total dose rate for shields with concrete C-01 and C-02 are compared in the Figure 7 and are in ac-cordance with the expected behavior. As can be verified, the curves evolutions are practically identical up to arrive in the biological shield inlet point (at∼1450 cm). From this point, the particles are transported inside the concrete and the differ-ences in the both compositions affect significantly the value of the dose rates. Clearly, the use of the concrete C-02 re-duces the total dose rate for about one magnitude order in comparison with the concrete C-01
FIG. 5: Neutrons and photons dose rate along the radial way to con-crete C-01
FIG. 6: Neutrons and photons dose rate along the radial way to con-crete C-02
FIG. 7: Total dose rate along the radial way to concrete C-01 and C-02
4. CONCLUSION
In the model used, the magnitude of the dose rate on the outside hall of bioshield during normal ITER operation can not be considered low in accordance with the result found in the simulation performed in this work, i.e., 1µSv.h−
1. It is
important to remember that the contributions due to the pres-ence of slits between blanket modules and also the various holes in the cryostat and bioshield were not considered in the calculation. Moreover, the contributions related to the tritium dispersed in the air and the activated materials were not con-sidered in this work. These simplifications certainly decrease a little the actual value that would be obtained if they were taken into account. It was determined that the dose rate in-herent during the ITER operation is dominated by the photons contribution.
system using MCNPX2.6.0, to analyze the depletion during an operation time.
ACKNOWLEDGMENTS
The authors are grateful to CNEN, CAPES, CNPq and FAPEMIG (Brazil) for the support.
[1] ITER Physics Basis Editor, el al,. “ITER Final Design Report”, Nuclear Fusion,Vol 39, (1999).
[2] Y. Chen, Y. Wu, Q. Huang, “Monte Carlo based operational and shutdown dose rate calculations of HT-7U tokamak”,Fusion En-gineering and Design,Vol 70, pp. 155–162 (2002).
[3] S. Sandri, and L. D. Pace, “Collective dose at ITER feat”,Fusion Engineering and Design,Vol. 63, pp.199-203 (2002).
[4] J. F. Briesmeister,MCNP - A General Monte Carlo N-Particle Transport Code, Version 5, Los Alamos National Laboratory, USA (2003).
[5] D. L. Aldama, A.Trkov,FENDL-2.1 Update of an evaluated nu-clear data library for fusion applications, Summary
documen-tation. (2004)
[6] J. Junker, A. Weller,Neutrons at W 7-X, Max-Planck Institut f¨ur Plasmaphysik, Germany (1998).
[7] V. Khripunovl, R. T. Santoro, H. Y. Khater, “Profit from Borat-ing Concrete in the ITER Biological Shield”,17th IEEE/NPSS Symposium. (1997).
[8] J. P. Freidberg,Plasma Physics and Fusion Energy, Cambridge University Press, UK. (2007).