BGD
11, 9035–9069, 2014Early season mesopelagic C remineralization and
transfer efficiency
S. H. M. Jacquet et al.
Title Page
Abstract Introduction
Conclusions References
Tables Figures
◭ ◮
◭ ◮
Back Close
Full Screen / Esc
Printer-friendly Version Interactive Discussion
Discussion
P
a
per
|
Discus
sion
P
a
per
|
Discussion
P
a
per
|
Discussion
P
a
per
|
Biogeosciences Discuss., 11, 9035–9069, 2014 www.biogeosciences-discuss.net/11/9035/2014/ doi:10.5194/bgd-11-9035-2014
© Author(s) 2014. CC Attribution 3.0 License.
This discussion paper is/has been under review for the journal Biogeosciences (BG). Please refer to the corresponding final paper in BG if available.
Early season mesopelagic carbon
remineralization and transfer e
ffi
ciency in
the naturally iron-fertilized Kerguelen area
S. H. M. Jacquet1,2, F. Dehairs3, A. J. Cavagna3, F. Planchon4, L. Monin5, L. André5, I. Closset6, and D. Cardinal6
1
Aix Marseille Université CNRS/INSU, IRD, Mediterranean Institute of Oceanography (MIO), UM110, 13288 Marseille, France
2
Université de Toulon, CNRS/INSU, IRD, Mediterranean Institute of Oceanography (MIO), UM110, 83957 La Garde, France
3
Vrije Universiteit Brussel, Analytical, Environmental & Geo-Chemistry and Earth System Sciences, Brussels, Belgium
4
Laboratoire des Sciences de l’Environnement Marin (LEMAR), Université de Brest, CNRS, IRD, UMR6539, IUEM; Technopôle Brest Iroise, Place Nicolas Copernic, 29280 Plouzané France
5
Royal Museum for Central Africa, Leuvensesteenweg 13, Tervuren, 3080, Belgium 6
BGD
11, 9035–9069, 2014Early season mesopelagic C remineralization and
transfer efficiency
S. H. M. Jacquet et al.
Title Page
Abstract Introduction
Conclusions References
Tables Figures
◭ ◮
◭ ◮
Back Close
Full Screen / Esc
Printer-friendly Version Interactive Discussion
Discussion
P
a
per
|
Discus
sion
P
a
per
|
Discussion
P
a
per
|
Discussion
P
a
per
|
Received: 6 May 2014 – Accepted: 12 May 2014 – Published: 16 June 2014
Correspondence to: S. H. M. Jacquet (stephanie.jacquet@mio.osupytheas.fr)
BGD
11, 9035–9069, 2014Early season mesopelagic C remineralization and
transfer efficiency
S. H. M. Jacquet et al.
Title Page
Abstract Introduction
Conclusions References
Tables Figures
◭ ◮
◭ ◮
Back Close
Full Screen / Esc
Printer-friendly Version Interactive Discussion
Discussion
P
a
per
|
Discus
sion
P
a
per
|
Discussion
P
a
per
|
Discussion
P
a
per
|
Abstract
We report on the zonal variability of mesopelagic particulate organic carbon) rem-ineralization and deep carbon transfer potential during the Kerguelen Ocean and Plateau compared Study 2 expedition (KEOPS 2; October–November 2011) in an area of the Polar Front supporting recurrent massive blooms from natural Fe fertilization. 5
Mesopelagic carbon remineralization was assessed using the excess, non-lithogenic
particulate barium (Baxs) inventories in mesopelagic waters and compared with
sur-face primary and export productions. Results for this early season study are compared with results obtained earlier (2005; KEOPS 1) for the same area during summer. For the Kerguelen plateau (A3 site) we observe a similar functioning of the mesopelagic 10
ecosystem during both seasons (spring and summer), with less that 30 % of carbon exported from the upper 150 m being remineralized in the mesopelagic column (150–
400 m). For deeper stations (>2000 m) located on the margin, inside a Polar Front
meander, as well as in the vicinity of the Polar Front, east of Kerguelen,
remineral-ization in the upper 400 m in general represents >30 % of carbon export, but when
15
considering the upper 800 m, in some cases, the entire flux of exported carbon is rem-ineralized. It appears that above the plateau (A3 site) mesopelagic remineralization is not a major barrier to the transfer of organic matter to the sea-floor (close to 500 m).
There the efficiency of carbon sequestration into the bottom waters (>400 m) reached
up to 87 % of the carbon exported from the upper 150 m. In contrast, at the deeper loca-20
tions mesopelagic remineralization clearly limits the sequestration of carbon to depths
>400 m. For sites at the margin of the plateau (station E-4W) and the Polar front
(sta-tion F-L), mesopelagic remineraliza(sta-tion even exceeds upper 150 m export, resulting in
a null sequestration efficiency to depths >800 m. In the Polar Front meander, where
successive stations form a time series, the capacity of the meander to transfer carbon 25
to depth>800 m is highly variable (0 to 73 %). The highest carbon transfer efficiencies
rem-BGD
11, 9035–9069, 2014Early season mesopelagic C remineralization and
transfer efficiency
S. H. M. Jacquet et al.
Title Page
Abstract Introduction
Conclusions References
Tables Figures
◭ ◮
◭ ◮
Back Close
Full Screen / Esc
Printer-friendly Version Interactive Discussion
Discussion
P
a
per
|
Discus
sion
P
a
per
|
Discussion
P
a
per
|
Discussion
P
a
per
|
ineralization, resulting again in a close to zero deep (>2000 m) carbon sequestration
efficiency there.
1 Introduction
While numerous artificial (Boyd et al., 2000, 2004; Gervais et al., 2002; Buesseler et al.,
2004, 2005; de Baar et al., 2005; Hoffmann et al., 2006) and natural (Blain et al., 2007;
5
Pollard et al., 2009; Zhou et al., 2010, 2013) iron-fertilization experiments in the South-ern Ocean demonstrated the role of iron in enhancing the phytoplankton biomass and production in high-nutrient low-chlorophyll (HNLC) regions, determining to what extent fertilization could modify the transfer of particulate organic carbon (POC) to the deep ocean is far from being comprehensively achieved (Morris and Charette, 2013). This 10
is partly due to the short term over which the observations were made, precluding ex-trapolation to longer time scales. Moreover, when assessing whether Fe-supply could induce vertical POC transfer, the magnitude of the export from surface is not the only important parameter to take into account. Indeed, POC fate in the mesopelagic zone (defined as 100–1000 m depth layer) is often largely overlooked although these depth 15
layers are responsible for the remineralization of most of the POC exported from the surface layer (Martin et al., 1987; Longhurst, 1995; Lampitt and Antia, 1997; François et al., 2002; Buesseler et al., 2007; Buesseler and Boyd, 2009). Only few studies con-sidered mesopelagic C remineralization rates (Buesseler et al., 2007b; Jacquet et al., 2008a, b, 2011a, b; Salter et al., 2007) to estimate the response of deep POC export to 20
fertilization. Assessing mesopelagic C remineralization is pivotal to evaluate reminer-alization length scale, the time scale of the C storage in the deep ocean, and thus to
quantify the ocean’s biological carbon pump and its efficiency in the global carbon (C)
cycle which bears large uncertainty and is currently under debate (e.g. from 5 Gt yr−1in
Henson et al. (2011) to 21 Gt C yr−1in Laws et al. (2000) and 13 Gt yr−1in IPPC WG1
25
BGD
11, 9035–9069, 2014Early season mesopelagic C remineralization and
transfer efficiency
S. H. M. Jacquet et al.
Title Page
Abstract Introduction
Conclusions References
Tables Figures
◭ ◮
◭ ◮
Back Close
Full Screen / Esc
Printer-friendly Version Interactive Discussion
Discussion
P
a
per
|
Discus
sion
P
a
per
|
Discussion
P
a
per
|
Discussion
P
a
per
|
The present work aims at understanding the impact of a natural iron-induced bloom on the mesopelagic POC remineralization and zonal variability in the Southern Ocean. Here, C remineralization was assessed from particulate biogenic Ba (hereafter called
excess-Ba or Baxs; mainly forms as barite BaSO4crystals) contents in the mesopelagic
water column. The link between barite and C remineralization resides in the fact 5
that this mineral precipitates inside oversaturated micro-environments (biogenic ag-gregates) during the process of prokaryotic degradation of sinking POC (Dehairs et al., 1980, 1992, 1997, 2008; Stroobants et al., 1991; Cardinal et al., 2001, 2005; Jacquet et al., 2007, 2008, 2011; Planchon et al., 2013). Once the aggregates have been rem-ineralized, barites are released and spread over the mesopelagic layer. Overall, earlier 10
works highlight the fact that suspended barite in mesopelagic waters builds up over the growing season and reflects integrated past remineralization activity. An algorithm
relat-ing mesopelagic Baxscontents to oxygen consumption (Shopova et al., 1995; Dehairs
et al., 1997) allowed remineralization of POC fluxes to be estimated for the mesopelagic
layer. Combined with surface C production and export estimates, mesopelagic Baxs
15
also informs on the efficiency of the system toward deep carbon transfer. From
ear-lier studies, the efficiency of C transfer through the mesopelagic layer was reported to
increase under artificially induced (EIFEX; Strass et al., 2005; Smetacek et al., 2012) and natural (KEOPS; Blain et al., 2007) Fe-replete conditions (Jacquet et al., 2008a, b; Savoye et al., 2008) compared to Fe-limited, non-bloom, HNLC reference stations in the 20
Southern Ocean. In contrast, C transfer efficiency through the mesopelagic layer was
reported smaller in natural Fe-replete locations during the SAZ-Sense cruise (Jacquet
et al., 2011a, b) offTasmania. Differences in plankton community structure and
com-position (diatoms vs. flagellates) were pointed at, as possible causes of such
discrep-ancies. Also, differences in integration time scales for the processes that control the
25
BGD
11, 9035–9069, 2014Early season mesopelagic C remineralization and
transfer efficiency
S. H. M. Jacquet et al.
Title Page
Abstract Introduction
Conclusions References
Tables Figures
◭ ◮
◭ ◮
Back Close
Full Screen / Esc
Printer-friendly Version Interactive Discussion
Discussion
P
a
per
|
Discus
sion
P
a
per
|
Discussion
P
a
per
|
Discussion
P
a
per
|
visited earlier in 2005 during summer (KEOPS 1; January–February, 2005). This
con-dition offers a unique opportunity to estimate the main carbon fluxes over most of the
growth season.
The specific objectives of the present work are to assess the zonal variability of mesopelagic C remineralization and deep C transfer potential in the naturally iron fertil-5
ized Polar Front (PF) area eastward of Kerguelen island, and to identify possible causes inducing this variability. The rationale guiding the sampling pattern at sea was therefore to (1) examine whether or not inter-sites changes in mesopelagic carbon remineraliza-tion due to unequal surface producremineraliza-tion is a proxy for long-term temporal evoluremineraliza-tion, induced by climate change (Ridgway and Dunn, 2007) and (2) compare mesopelagic 10
C remineralization estimates to particle and biological parameters as reported in other papers included in this issue (Cavagna et al., 2014; Dehairs et al., 2014; Jouandet et al., 2014; Laurenceau et al., 2014; Planchon et al., 2014; Trull et al., 2014; Vander-merve et al., 2014; Zhou et al., 2014).
2 Experiment and methods 15
2.1 Study area
The KEOPS 2 cruise (Kerguelen Ocean and Plateau compared Study; October– November 2011) was carried out in the Kerguelen Plateau area (Indian sector of the Southern Ocean) in Austral spring conditions. The northeastern part of the Plateau supports a recurrent massive bloom and the possible sources and mechanisms for fer-20
tilization were investigated during ANTARES 3 (1995; Blain et al., 2001) and the first KEOPS cruise, later referred to as KEOPS 1 (January–February 2005, late summer
conditions; Blain et al., 2007, 2008). During KEOPS 2 the evolution of Chladata based
on multi-satellite imagery of the study area revealed the evolution of different Chlarich
plumes (D’ovidio et al., 2014) (Fig. 1a; e.g. Chla map from 11 November 2011). The
25
dif-BGD
11, 9035–9069, 2014Early season mesopelagic C remineralization and
transfer efficiency
S. H. M. Jacquet et al.
Title Page
Abstract Introduction
Conclusions References
Tables Figures
◭ ◮
◭ ◮
Back Close
Full Screen / Esc
Printer-friendly Version Interactive Discussion
Discussion
P
a
per
|
Discus
sion
P
a
per
|
Discussion
P
a
per
|
Discussion
P
a
per
|
ferent at each station, implying different mesoscale mechanisms responsible of their
structure. Stations were sampled in distinct zones covering these different bloom
pat-terns (Fig. 1a) (corresponding stations are reported in Fig. 1.b): (a) on the shallow plateau (station A3; see 1 in Fig. 1a). Note that station A3 coincides with a site studied during the KEOPS 1 cruise, and that it was sampled twice over a 27 day period; (b) 5
in a meander formed by a quasi-permanent retroflection of the Polar Front (PF) and topographically-steered by the eastern escarpment (Gallieni Spur) of the Kerguelen Plateau (mainly stations E, sampled as a quasi-lagrangian temporal series) (see 2 in Fig. 1a); (c) along a North–South Transect (referred to as TNS stations; see 3, grey line in Fig. 1a) and a West–East Transect (referred to as TWE stations; see 4, grey line 10
in Fig. 1a), both crossing the PF; and (d) in the Polar Front Zone (PFZ) in the vicinity (east) of the PF (station F-L; see 5 in Fig. 1a). Furthermore we also sampled a refer-ence HNLC/non bloom/non Fe-fertilized station southwest of the Plateau (station R-2; see 6 in Fig. 1a). Station locations are given in Table 1.
Detailed descriptions of the complex physical structure of the area, circulation, water 15
masses and fronts are given in Park et al. (2014). Briefly, the main hydrodynamic
fea-tures observed during the cruise are the following (seeθ–S diagram, Fig. 2a): (1) North
of the PF, stations in the PFZ (TNS-1, TEW-8 and F-L) present Antarctic Surface
Wa-ters (AASW;θ≃4◦C and density<27);θ–S characteristics between 150 to 400 m at
station F-L (and to a lesser extent at station TNS-1) reveal the presence of interleaving 20
with waters from northern (subantarctic) origin, centered between the 27.2 and 27.5 density curves, where Antarctic Intermediate Waters (AAIW) are usually found. This contrasts with the situation at station TEW-8, where there is no evidence of interleav-ing; (2) stations south of the PF exhibit subsurface temperature minima characteristic of Winter Waters (WW); below the WW three water masses can be identified, namely: 25
the Upper (temperature maximum) and Lower (salinity maximum) Circumpolar Deep Water (UCDW and LCDW), and the Antarctic Bottom Water (AABW). Theses water
masses are present roughly in the following depth intervals: 700 m<UCDW<1500 m;
BGD
11, 9035–9069, 2014Early season mesopelagic C remineralization and
transfer efficiency
S. H. M. Jacquet et al.
Title Page
Abstract Introduction
Conclusions References
Tables Figures
◭ ◮
◭ ◮
Back Close
Full Screen / Esc
Printer-friendly Version Interactive Discussion
Discussion
P
a
per
|
Discus
sion
P
a
per
|
Discussion
P
a
per
|
Discussion
P
a
per
|
Based on the θ–S characteristics (Fig. 2a and b) and surface phytoplankton
biomasses we can schematically group the stations as follows. The R-2 HNLC ref-erence station (white dot in Fig. 1b) is characterized by a very low biomass (with low iron contents; Bowie et al., 2014). Stations TEW-3 and TNS-8 (black dots) are char-acterized by a low to moderate biomass and Fe contents. Stations A3 and E-4W (red 5
dots; south of the PF) as well as stations TNS-1, F-L and TEW-8 (blue dots; north of the PF) are characterized by high biomass and iron contents. Stations in the core of the PF meander (green dots; stations TNS-6, E-1, E-2, E-3, E-4E and E-5 considered as a temporal series) are characterized by moderate biomass and iron contents.
2.2 Sampling and analyses 10
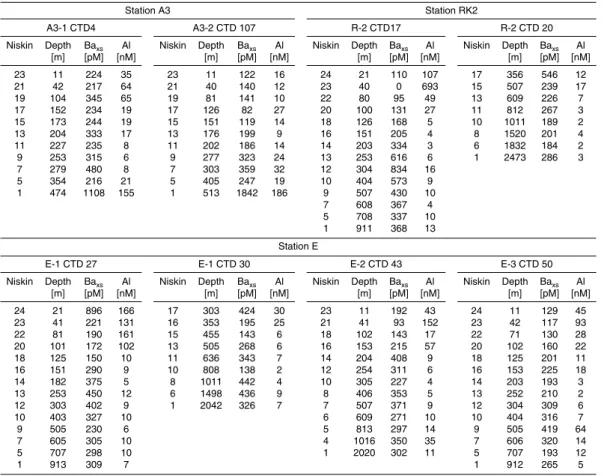
22 CTD casts (surface to 500–2000 m) were sampled for particulate barium (Table 1) using a CTD-rosette equipped with 22 10 L Niskin bottles. Deep particulate Ba profiles
(>1000 m) were not systematically obtained from the same CTD cast, but from
suc-cessive casts sampled closeby in time and space and having similarθ–S data profiles.
In the following, we use both the station and CTD numbers to refer to stations. 15
4 to 7 L of seawater were filtered onto 47 mm polycarbonate membranes (0.4 µm porosity) under slight overpressure supplied by filtered air (0.4 µm). The filters were
rinsed with Milli-Q grade water (<5 mL) to remove sea salt, dried (50◦C) and stored
in Petri dishes for later analysis. In the home-based laboratory we performed a total
digestion of samples using a tri-acid (0.5 mL HF/1.5 mL HCl/1 mL HNO3; all Suprapur
20
grade) mixture in closed telfon beakers overnight at 90◦C in a clean pressurized room.
After evaporation close to dryness samples were re-dissolved into around 13 mL of
HNO3 2 %. The solutions were analysed for Ba and other major and minor elements
by ICP-QMS (inductively coupled plasma-quadrupole mass spectrometry; X Series 2 ThermoFisher) equipped with a collision cell technology (CCT). Among all elements 25
BGD
11, 9035–9069, 2014Early season mesopelagic C remineralization and
transfer efficiency
S. H. M. Jacquet et al.
Title Page
Abstract Introduction
Conclusions References
Tables Figures
◭ ◮
◭ ◮
Back Close
Full Screen / Esc
Printer-friendly Version Interactive Discussion
Discussion
P
a
per
|
Discus
sion
P
a
per
|
Discussion
P
a
per
|
Discussion
P
a
per
|
called excess-Ba or Baxs) was calculated as the difference between total particulate Ba
and lithogenic Ba using Al as the lithogenic reference element (Dymond et al., 1992;
Taylor and McLennan, 1985). At most sites and depths the biogenic Baxs represented
>95 % of total particulate Ba. Lithogenic Ba reached up to 20 % of total particulate
Ba at some depths in the upper 80–100 m, mainly at station R-2 and stations north of 5
the Polar Front (i.e., TEW-8, F-L and TNS-1). The standard uncertainty (Ellison et al.,
2000) on Baxs data ranges between 5 and 5.5 %. Baxs and Al data are reported in
Table A1.
2.3 C remineralization
Particulate organic carbon remineralization in the mesopelagic layer (later referred to 10
as MR) was estimated using an algorithm relating mesopelagic Baxscontents and
oxy-gen consumption based on earlier observations in the Southern Ocean (Shopova et al., 1995; Dehairs et al., 1997, 2008). The detailed calculations are described in Jacquet et al. (2008a, 2011). Briefly, we use the following equations:
JO2=(Baxs−Baresidual)/17 450 (1)
15
Crespired=Z×JO2×RR (2)
whereJO2 is the O2consumption (µmol L
−1
d−1) andCrespiredis the Mineralization Rate
of organic carbon (in mmol C m−2d−1; MR); Baxs is the depth-weighted average Baxs
value (DWAv), i.e. the Baxsinventory divided by the depth layer consideredZ, Baresidual
20
is the residual Baxs signal (or Baxs background) at zero oxygen consumption and RR
is the Redfield C/O2molar ratio (127/175; Broecker et al., 1985).
DWAv Baxs values were calculated both for 150 to 400 m (Plateau and deep
sta-tions) and 150 to 800 m water column (deep stations only) (see details further below).
The residual Baxs is considered as “preformed” Baxs, left-over after partial dissolution
25
and sedimentation of Baxsproduced during a previous phytoplankton growth event. In
BGD
11, 9035–9069, 2014Early season mesopelagic C remineralization and
transfer efficiency
S. H. M. Jacquet et al.
Title Page
Abstract Introduction
Conclusions References
Tables Figures
◭ ◮
◭ ◮
Back Close
Full Screen / Esc
Printer-friendly Version Interactive Discussion
Discussion
P
a
per
|
Discus
sion
P
a
per
|
Discussion
P
a
per
|
Discussion
P
a
per
|
et al., 1999), this background Baxsvalue was considered to reach 180 pM (see Dehairs
et al., 1997; Jacquet et al., 2008a, 2011). Relative standard uncertainties (Ellison et al., 2000) on C remineralization ranged between 4 and 20 %.
3 Results
3.1 Particulate biogenic Baxsprofiles
5
We focus on the mesopelagic zone where most of the remineralization of exported POC takes place (Martin et al., 1987; Sarmiento et al., 1993; Buesseler et al., 2007).
Baxs profiles in the upper 800 m are reported in Fig. 3. Data for all Baxs profiles are
given in Table 1A.
The Baxs profile for station R-2 (CTD #17) displays a characteristic mesopelagic
10
Baxsmaximum reaching up to 834 pM at 304 m (Fig. 3a). Baxs profiles for stations A3
on the shallow plateau (A3-1 CTD #4 and A3-2 CTD #107; Fig. 3b) have lower Baxs
contents in the water column, with values ranging from about 80 to 350 pM. At this site,
Baxs values increase close to the seafloor for both repeats, reaching up to 1108 pM
(A3-1, 474 m) and 1842 pM (A3-2, 513 m). In contrast, station E-4W (located further 15
north along the margin in deeper waters, but with similarθ–S and Chlacharacteristics
as station A3) displays a large mesopelagic Baxs maximum reaching up to 627 pM at
252 m (Fig. 3c). Station TEW-3 (located on the Kerguelen plateau, in waters with similar
θ–S and Chla characteristics as station TNS-8) has a similar profile as observed at
station A3-2, except we do not observe increased Baxs contents in bottom water, as
20
is the case for plateau sites A3-1 and A3-2 sites (Fig. 3d). The other stations of the
study area (Fig. 3d–g) has a similar profile as observed at station E-4W, with Baxs
contents increasing below 150 m in the mesopelagic zone and profiles showing the
characteristic Baxsmaxima between 200 and 500 m. Note that for most of the stations,
Baxs concentrations in waters below the maximum do not systematically decrease to
25
BGD
11, 9035–9069, 2014Early season mesopelagic C remineralization and
transfer efficiency
S. H. M. Jacquet et al.
Title Page
Abstract Introduction
Conclusions References
Tables Figures
◭ ◮
◭ ◮
Back Close
Full Screen / Esc
Printer-friendly Version Interactive Discussion
Discussion
P
a
per
|
Discus
sion
P
a
per
|
Discussion
P
a
per
|
Discussion
P
a
per
|
significantly higher than residual Baxs are still observed below 1000 m (see Table 1A).
This is particularly salient at stations TNS-6, E-1, E-2 and F-L where Baxsvalues below
1000 m reach 410 pM at 1886 m (TNS-6) and 436 pM at 1498 m (E-1).
3.2 Depth-weighted average Baxs content of mesopelagic waters
From previous studies we know that Baxs in surface waters is distributed over different
5
mainly non-barite, biogenic phases (see Stroobants et al., 1991; Jacquet et al., 2007b; Cardinal et al., 2005). As such, they do not reflect POC remineralization processes,
in contrast to mesopelagic waters where Baxs is mainly composed of barite (Dehairs
et al., 1980) formed during prokaryotic degradation of sinking POC (see above). In
gen-eral we observed that Baxs concentrations increase below 150 m (i.e., they increase
10
above the background level set at 180 pM). Since the bases of the mixed layer and the euphotic zone, are both shallower than 150 m, the 150 m depth is taken here as the upper boundary of the mesopelagic domain. The depth-weighted average (DWAV)
Baxscontents, calculated for the 150–400 m and 150–800 m depth intervals, are given
in Table 1. For profiles on the plateau (500 m water column) bottom waters with evi-15
dence of sediment resuspension were not taken into account when calculating DWAv
Baxs values (≥400 m). Particle size spectra indicate that sediment resuspension
oc-curred especially at stations A3 and TEW-3 (Jouandet et al., 2014; Lasbleiz et al., 2014; Vandermerve et al., 2014; Zhou et al., 2014). Thus, at site A3 (Fig. 3b) DWAV
Baxsis calculated for the layer between 150 and 354 m for A3-1 (CTD #4) and between
20
150 and 405 m for A3-2 (CTD#107). For station TEW-3 (CTD #38) DWAV Baxs was
calculated for the water layer between 150 and 400 m (Fig. 3d). For the deep sites, we considered both, the 150–400 m and the 150–800 m depth intervals, when calculating
the DWAV Baxscontents.
DWAV Baxs values range from 199 to 572 pM (Table 1) and fit within the range
25
reported for Polar Front areas during previous studies (Cardinal et al., 2001, 2005; Jacquet et al., 2005, 2008a, b, 2011; Planchon et al., 2013). Station R-2 shows the
BGD
11, 9035–9069, 2014Early season mesopelagic C remineralization and
transfer efficiency
S. H. M. Jacquet et al.
Title Page
Abstract Introduction
Conclusions References
Tables Figures
◭ ◮
◭ ◮
Back Close
Full Screen / Esc
Printer-friendly Version Interactive Discussion
Discussion
P
a
per
|
Discus
sion
P
a
per
|
Discussion
P
a
per
|
Discussion
P
a
per
|
visits (27 day interval) at site A3 yielded relatively low DWAV Baxs values of 267 and
316 pM, and a quite similar value was observed for shallow station TEW-3 (324 pM), located further north on the plateau. The time series stations in the Polar Front
mean-der had DWAV Baxs contents ranging from 258 to 427 pM (150–400 m), so reaching
values exceeding those on the plateau. For the time series stations, values decreased 5
between day 0 (TNS-6) and 12 (E-3), and then increased again at days 22 (E-4E) and 27 (E-5). Stations E-4W and TNS-8 close to the Kerguelen margin, at the edge the
high biomass plume (Fig. 1) had the highest DWAV Baxs values, not considering the
R-2 reference station (468 and 473 pM, respectively; 150–400 m). The Polar Front F-L site, although located underneath the eastern part of the high biomass had a smaller 10
DWAV Baxs value of 345 pM (150–400 m) and the closeby station TEW-8 even had the
lowest DWAV Baxsvalue of the study area (199 pM; 150–400 m).
Depth weighted average Baxs values were translated into carbon remineralization
rates using Eqs. (1) and (2) given above. These rates ranged from 2 to 91 mg C m−2d−1
(Table 1). 15
4 Discussion
An important question relates to the fate of the exported POC: how much of this POC is respired in the mesopelagic waters and how much escapes remineralization and is exported to deeper layers where longer term sequestration is likely (see e.g. Schneider et al., 2008). To address these questions, we define two ratios: (1) the mesopelagic C 20
remineralization efficiency (r ratio in Table 2) which is the ratio of mesopelagic C
rem-ineralization (MR, based on the DWAV Baxsconcentrations) over C export (EP) from the
150 m horizon (based on234Th, see Planchon et al., 2014), and (2) the C sequestration
(or transfer) efficiency at 400 and 800 m (i.e., T400, T800 in Table 2) which is the
frac-tion of C export (EP) at 150 m passing through the 400 m (T400) or the 800 m (T800) 25
horizons (e.g., T400=EP400/EP150=1−(MR/EP150), with MR/EP150=r ratio;
BGD
11, 9035–9069, 2014Early season mesopelagic C remineralization and
transfer efficiency
S. H. M. Jacquet et al.
Title Page
Abstract Introduction
Conclusions References
Tables Figures
◭ ◮
◭ ◮
Back Close
Full Screen / Esc
Printer-friendly Version Interactive Discussion
Discussion
P
a
per
|
Discus
sion
P
a
per
|
Discussion
P
a
per
|
Discussion
P
a
per
|
(2009). Indeed, the latter authors state that a conventional curve-fitting of particle flux data (i.e., power law or exponential) skews our interpretation of the mesopelagic pro-cesses and they recommended the use of combined metrics to capture and compare
differences in flux attenuation. In the following, we compare MR fluxes for the different
KEOPS 2 areas (Reference site; Plateau sites; Polar Front and Polar Front Meander) 5
and discuss remineralization and sequestration efficiencies for those sites for which
primary production (PP) and/or EP data (Table 2) are available. PP data were inte-grated over the euphotic layer (i.e., till the 1 % PAR level; Cavagna et al., 2014), while EP fluxes are discussed by Planchon et al. (this issue). In order to compare EP with
MR (r ratio and transfer efficiency), we considered EP fluxes from 150 m.
10
4.1 Reference station R-2
Because the low productivity, low export reference station R-2 had the highest DWAV
Baxs content, it yields the highest MR flux of the whole study area (91 mg C m
−2
d−1;
150–800 m; Table 2). PP and EP fluxes at R-2 are both extremely low (132 and
10 mg C m−2d−1, respectively) and since MR exceeds EP, this results in T400 and T800
15
values>100 % (Table 2). We note that the sinking flux collected using gel traps was
relatively small too (Trull et al., 2014), and that the collected particles mainly consisted of phytodetrital aggregates that held heavily silicified diatoms (Laurenceau et al., 2014).
Also, suspended particles in the depth range with the Baxsmaximum were marked by
two size fractions disappearing below 500 m depth (i.e., 3–8 µm and 12–80 µm frac-20
tions; Zhou et al., 2014). It is likely that we observe a remineralization activity that was fuelled by an important past winter production and export event. Moreover, we do note that surface waters at R-2 experienced already some significant nitrate consumption as
compared to subsurface Winter Waters (Tmin waters). Indeed, surface waters had 17 %
less nitrate than Winter Water (25.7 µM at 5 m vs. 30 µM at 250 m) and the isotopic 25
enrichment of this surface nitrate confirmed an imprint of uptake (see Dehairs et al.,
2014). This would indicate that the mesopelagic Baxs content at R-2 does indeed
BGD
11, 9035–9069, 2014Early season mesopelagic C remineralization and
transfer efficiency
S. H. M. Jacquet et al.
Title Page
Abstract Introduction
Conclusions References
Tables Figures
◭ ◮
◭ ◮
Back Close
Full Screen / Esc
Printer-friendly Version Interactive Discussion
Discussion
P
a
per
|
Discus
sion
P
a
per
|
Discussion
P
a
per
|
Discussion
P
a
per
|
(unpublished results) observed the presence of significant numbers of barite
micro-crystals in mesopelagic waters at the KERFIX time series station (50◦40′S, 68◦25′E)
located east of R-2 during late winter (November 1993). Results would thus suggest the occurrence in this area of recurrent winter production and important remineralization events.
5
4.2 Station A3 on the plateau
The MR fluxes on the plateau vary little between the two visits 27 days apart (Table 1) and as discused below are moreover similar to KEOPS 1 summer values (see Jacquet et al., 2008a), when the same A3 site was sampled 3 times over a 19 day period. For
comparison purposes, we recalculated the DWAV Baxsand MR values of KEOPS 1 by
10
considering upper and lower mesopelagic layer boundaries of 150 and 400 m rather
than 125 and 450 m, as in Jacquet et al. (2008a). Also, in the latter study the high Baxs
contents observed near the seafloor were not excluded from the calculations, while
they are here. These increased benthic boundary layer Baxs contents (observed also
during KEOPS 2) are due to sediment resuspension which extended up to 70 m above 15
the seafloor during KEOPS 1 (Blain et al., 2008; Venchiarutti et al., 2008; Armand et al.,
2008). Because of these slightly different depth intervals over which Baxsvalues were
integrated, the KEOPS 1 values discussed here will be slightly different from those
reported in Jacquet et al. (2008a). PP and EP data from KEOPS 1 are detailed in Lefèvre et al. (2008) and Mosseri et al. (2008), and Savoye et al. (2008), respectively. 20
While MR fluxes at A3 ranged from 11 to 14 mg C m−2d−1 (with a standard
uncer-tainly around 5 %) during KEOPS 2 (spring) they were slightly larger during KEOPS 1
(summer; 17 to 23 mg C m−2d−1). We observe large differences in mesopelagic POC
remineralization efficiency between both seasons (r ratio, blue values in Fig. 4,
Ta-ble 2). During KEOPS 1r ratios remained low, ranging from 7 to 9 % of EP at A3, while
25
during KEOPS 2r ratios decreased from 29 % (A3-1; first visit) to 13 %, 27 days later
(A3-2; second visit). This variation inr ratio is mostly due to an increase of EP (from
BGD
11, 9035–9069, 2014Early season mesopelagic C remineralization and
transfer efficiency
S. H. M. Jacquet et al.
Title Page
Abstract Introduction
Conclusions References
Tables Figures
◭ ◮
◭ ◮
Back Close
Full Screen / Esc
Printer-friendly Version Interactive Discussion
Discussion
P
a
per
|
Discus
sion
P
a
per
|
Discussion
P
a
per
|
Discussion
P
a
per
|
this early stage of the season (spring), PP at A3-2 already reaches 2172 mg C m−2d−1,
EP remains relatively low (85 mg C m−2d−1). Here EP accounts for only about 4 % of
PP (see green data points in Fig. 4), suggesting that phytoplankton biomass was accu-mulating in the surface waters without significant export yet. In contrast, during KEOPS
1 (summer), EP fluxes reached 250 mgC m−2d−1at 125 m (14–31 % of PP) while PP
5
ranged from 865 to 1872 mg C m−2d−1, reflecting enhanced export to the bottom (Blain
et al., 2007; Jacquet et al., 2008a; Savoye et al., 2008).
In Fig. 5a we plot for both KEOPS cruises the ratio of EP over PP vs. the fraction of EP exported deeper than 400 m (i.e. T400; defined above). Note that for station
A3-1 (KEOPS 2), there are no PP data. The A3 site shows increasing EP/PP ratios
10
from spring (KEOPS 2) to late summer (KEOPS 1), and so do the T400 values (A3-1:
70 %; A3-2: 87 %; KEOPS 1 A3 site: 92±1 %). Station E-4W located in waters with
similarθ–S and Chl acharacteristics as the A3 plateau site has PP and EP fluxes of
the same order of magnitude (Table 2). However, MR values (36 mg C m−2d−1; 150–
400 m) are larger at E-4W, resulting in a lower T400 value of around 33 %, compared 15
to 87 % for A3-2 (Fig. 5a). When integrating down to 800 m, T800 at E-4W reaches
141 % (i.e., no export of POC beyond 800 m; note that>100 % values, i.e., MR>EP,
were set to zero in Fig. 5a). Station F-L (in the vicinity of the PF; 74.7◦E) appears to
function in a similar way as observed for E-4W (71.4◦E). PP at station F-L is relatively
high (3380 mg C m−2d−1), while EP is quite low (43 mg C m−2d−1), reflecting the fact
20
that the biomass was not yet exported from the surface waters. Since MR fluxes are
slightly lower (21 mg C m−2d−1; 150-400 m) at F-L than at E-4W, resulting T400 values
are higher (52 %) there. Note that the particle flux at F-L was mainly composed of fecal pellet material while at A3 phytodetrital aggregates were dominant (Laurenceau et al., 2014).
25
BGD
11, 9035–9069, 2014Early season mesopelagic C remineralization and
transfer efficiency
S. H. M. Jacquet et al.
Title Page
Abstract Introduction
Conclusions References
Tables Figures
◭ ◮
◭ ◮
Back Close
Full Screen / Esc
Printer-friendly Version Interactive Discussion
Discussion
P
a
per
|
Discus
sion
P
a
per
|
Discussion
P
a
per
|
Discussion
P
a
per
|
efficiency of C sequestration beyond 800 m; (2) both seasons (KEOPS 1 and KEOPS
2) show a similar functioning of the mesopelagic ecosystem at A3. The rather low and perduring MR fluxes under high production and variable export regimes indicate that here mesopelagic remineralization is not a major resistance to organic matter transfer to the sea-floor at A3. On average (considering both seasons but excluding A3-1) the 5
C sequestration efficiency into the deep (>400 m) reached 91±3 % at A3.
4.3 Stations in the meander
Here we will discuss temporal changes for the stations TNS-6, E-1, E-2, E-3, E-4E and E-5, located in the Polar front Meander, and which constitute a time series over the one month duration of this study. Note that no PP or EP data exist for TNS-6. From Table 2 10
it appears that the near doubling of the PP between E-1 and E-5 is not paralleled by an increase of EP and MR, except for the 30 % EP increase from E-1 to E-3. In fact overall EP shows a decreasing trend with time, while MR (150–400 m) stays rather constant, except for the decrease between E-1 and E-3 (Table 2). As reported above
such a mismatch may result from differences in time scales characterizing the different
15
processes that are compared. The more likely explanation, however, is that in this early stage of the growth season, phytoplankton biomass is accumulating in the surface layer and export is lagging behind.
The ratio of EP over PP vs. T400 and T800 reveals a large variability in sequestration
efficiency inside the meander (Fig. 5b). PP and EP fluxes increase by about 30 % from
20
E-1 to E-3, but a concomitant decrease of mesopelagic MR yields to an enhanced
transfer efficiency, from 74 to 92 %, through the 400 m boundary and from 52 to 73 %
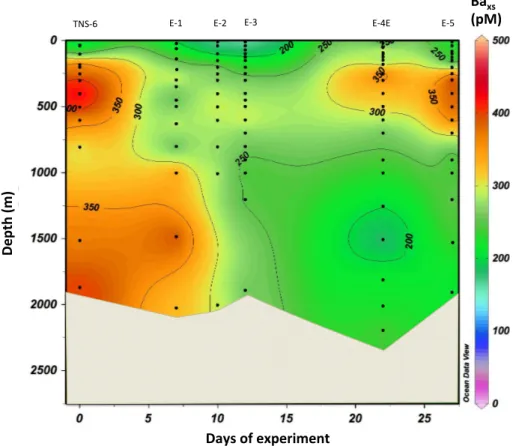
through the 800 m boundary. This suggests that significant remineralization should also
occur at greater depth (even at depths>1000 m) as reflected also by the presence of
Baxs maxima below 1000 m (see Table 1A). This becomes particularly salient when
25
plotting Baxs contents vs. depths over the 27 day observation period (Fig. 5b). The
high deep water Baxs values in Fig. 5b are not taken into account when integrating
BGD
11, 9035–9069, 2014Early season mesopelagic C remineralization and
transfer efficiency
S. H. M. Jacquet et al.
Title Page
Abstract Introduction
Conclusions References
Tables Figures
◭ ◮
◭ ◮
Back Close
Full Screen / Esc
Printer-friendly Version Interactive Discussion
Discussion
P
a
per
|
Discus
sion
P
a
per
|
Discussion
P
a
per
|
Discussion
P
a
per
|
that the seafloor in the meander area is at about 2000 m depth, it seems unlikely that
these high Baxscontents at depths>1000 m are due to sediment resuspension. Also,
particle spectra for these sites do not reveal any bottom resuspension (Jouandet et al., 2014; Lasbleiz et al., 2014; Vandermerve et al., 2014; Zhou et al., 2014). Therefore,
the high deep (>1000 m) Baxs contents at TNS-6 and E-1 likely reflect the fact that
5
here significant remineralization of POC material did occur in the bathypelagic domain and even down to the sea-floor. Note that suspended particles in the depth range
containing the deep Baxs maxima were dominated by the <2 µm size fraction (Zhou
et al., 2014). When integrating the Baxscontents from 150 m till the sea-floor at stations
TNS-6 and E-1, MR fluxes increase to 156 and 184 mg C m−2d−1, respectively. Such
10
C fluxes are similar to the EP values (maximum value of 130 mg C m−2d−1at E-3) and
suggest that exported POC is entirely remineralized in the water column leaving no C for sequestration into the sediments.
Overall, the temporal pattern of mesopelagic remineralization described above re-flects two successive events of particle transfer: a first transfer from a past bloom (oc-15
curred before visiting TNS-6 and perduring at E-1) and a second transfer from E-4E to E-5. The first transfer is evident by the downward (up to the bottom) propagation of the
mesopelagic Baxs maximum signal, which mostly weakens at E-2 (Fig. 5b). The
sec-ond event is reflected by the occurrence again of important mesopelagic Baxsbuild-up
at E-4E and E-5. Note that the particle flux composition in the meander shows a shift 20
from a domination of fecal pellet to phytodetrital material from E-1 to E-3, and fecal pellets becoming more important again at E-5 (Laurenceau et al., 2014). Overall, our results indicate the large capacity of the Polar Front Meander to transfer POC mate-rial to depth, but in contrast to station A3 on the Plateau, this transfer is coupled to intense and near to complete POC remineralization (as also observed at E-4W and 25
BGD
11, 9035–9069, 2014Early season mesopelagic C remineralization and
transfer efficiency
S. H. M. Jacquet et al.
Title Page
Abstract Introduction
Conclusions References
Tables Figures
◭ ◮
◭ ◮
Back Close
Full Screen / Esc
Printer-friendly Version Interactive Discussion
Discussion
P
a
per
|
Discus
sion
P
a
per
|
Discussion
P
a
per
|
Discussion
P
a
per
|
sector of the Southern Ocean; SAZ-Sense cruise; Jacquet et al., 2011), where the
mesopelagic remineralization efficiency was reported relatively high (on average 91 %)
and the deep (>600 m) carbon sequestration weak (<10 %).
5 Conclusion
Based on spatially and temporally well resolved mesopelagic excess particulate Ba in-5
ventories this work estimated mesopelagic POC remineralization above the Kerguelen Plateau and inside a permanent meander of the Polar Front to the east of Plateau,
areas. The observed variability of mesopelagic remineralization reflects differences in
the fate of the biomass that is exported to the deep ocean, between Plateau and Polar
Front. In terms of deep ocean carbon sequestration efficiency, our results highlight that
10
above the plateau (A3 site) mesopelagic remineralization is not a major barrier to or-ganic matter transfer to the sea-floor, with carbon sequestration beyond 400 m reaching up to 87 % of EP, while in the Polar Front Meander remineralization of exported organic
carbon in the upper 400 m is more efficient than above the plateau. In the Meander
area remineralization may even balance export when including its effect in the deeper
15
waters (till 800 m and even deeper), thus resulting in a close to zero carbon sequestra-tion to sediment. A similar condisequestra-tion is observed for sites at the margin of the plateau (E-4W) and the Polar front (F-L).
Acknowledgements. We thank the officers and crew of R/V Marion Dufresne for their assis-tance during work at sea. We are indebted to chief scientist S. Blain and voyage leader B.
20
Quéguiner for skillful leadership during the cruise and to the CTD team for managing rosette operation and CTD data. This research was supported by the French Agency of National Re-search grant (project KEOPS 2, #ANR-10-BLAN-0614), the Belgian Science Policy (BELSPO) project “BIGSOUTH” (SD/CA/05A), Flanders Research Foundation (FWO Project G071512N), the European Union Seventh Framework Programme (Marie Curie CIG “MuSiCC” under grant
25
BGD
11, 9035–9069, 2014Early season mesopelagic C remineralization and
transfer efficiency
S. H. M. Jacquet et al.
Title Page
Abstract Introduction
Conclusions References
Tables Figures
◭ ◮
◭ ◮
Back Close
Full Screen / Esc
Printer-friendly Version Interactive Discussion
Discussion
P
a
per
|
Discus
sion
P
a
per
|
Discussion
P
a
per
|
Discussion
P
a
per
|
References
Armand, L. K., Crosta, X., Quéguiner, B., Mosseri, J., and Garcia, N.: Diatoms preserved in surface sediments of the northeastern Kerguelen Plateau, Deep-Sea Res. Pt. II, 55, 677– 692, 2008.
de Baar, H. J. W., Boyd, P. W., Coale, K. H., Landry, M. R., Tsud, A., Assmy, P., Bakker, D.
5
C. E, Bozec, Y., Barber, R. T., Brzezinski, M. A., Buesseler, K. O., Boyé, M., Croot, P. L., Gervais, F., Gorbunov, Y., Harrison, P. J., Hiscock, W. T., Laan, P., Lancelot, C., Law, C.S., Levasseur, M., Marchetti, A., Millero, F. J., Nishika, J., Nojiri, Y., van Oijen, T., Riebesell, U., Rijkenberg, M. J. A., Saito, H., Takeda, S., Timmermans, K. R., Veldhuis, J. W., Waite, A. M., and Wong, C. S.: Synthesis of iron fertilization experiments: from the Iron Age in the Age of
10
Enlightenment, J. Geophys. Res, 110, C09S16, doi:10.1029/2004JC002601, 2005.
Blain, S., Tréguer, P., Belviso, S., Bucciarelli, E., Denis, M., Desabre, S., Fiala, M., Martin Jézéquel, V., Le Fèvre, J., Mayzaud, P., Marty, J.-C., and Razouls, S.: A biogeochemical study of the island mass effect in the context of the iron hypothesis: Kerguelen Islands, Southern Ocean, Deep-Sea Res. Pt. I, 48, 163–187, 2001.
15
Blain, S., Queguiner, B., Armand, L., Belviso, S., Bombled, B., Bopp, L., Bowie, A., Brunet, C., Brussaard, C., Carlotti, F., Christaki, U., Corbiere, A., Durand, I., Ebersbach, F., Fuda, J.-L., Garcia, N., Gerringa, L., Griffiths, B., Guigue, C., Guillerm, C., Jacquet, S., Jeandel, C., Laan, P., Lefevre, D., Lo Monaco, C., Malits, A., Mosseri, J., Obernosterer, I., Park, Y.-H., Picheral, M., Pondaven, P., Remenyi, T., Sandroni, V., Sarthou, G., Savoye, N., Scouarnec,
20
L., Souhaut, M., Thuiller, D., Timmermans, K., Trull, T., Uitz, J., van Beek, P., Veldhuis, M., Vincent, D., Viollier, E., Vong, L., and Wagener, T.: Effect of natural iron fertilization on carbon sequestration in the Southern Ocean, Nature, 446, 1070–1074, 2007.
Blain, S., Quéguiner, B., and Trull, T.: The natural iron fertilization experiment KEOPS (KErgue-len Ocean and Plateau compared Study): an overview, Deep-Sea Res. Pt. II, 55, 559–565,
25
2008.
Boyd, P. W., Watson, A. J., Law, C. S., Abraham, E. R., Trull, T., Murdoch, R., Bakker, D. C. E., Bowie, A. R., Buesseler, K. O., Chang, H., Charette, M., Croot, P., Downing, K., Frew, R., Gall, M., Hadfield, M., Hall, J., Harvey, M., Jameson, G., LaRoche, J., Liddicoat, M., Ling, R., Maldonado, M. T., McKay, R. M., Nobber, S., Pickmere, S., Pridmore, R., Rintoul, S., Safi, K.,
30
BGD
11, 9035–9069, 2014Early season mesopelagic C remineralization and
transfer efficiency
S. H. M. Jacquet et al.
Title Page
Abstract Introduction
Conclusions References
Tables Figures
◭ ◮
◭ ◮
Back Close
Full Screen / Esc
Printer-friendly Version Interactive Discussion
Discussion
P
a
per
|
Discus
sion
P
a
per
|
Discussion
P
a
per
|
Discussion
P
a
per
|
bloom upon mesoscale iron fertilisation of polar Southern Ocean waters, Nature, 407, 695– 702, 2000.
Boyd, P. W., Law, C. S., Wong, C. S., Nojiri, Y., Tsuda, A., Levasseur, M., Takeda, S., Rivkin, R., Harrison, P. J., Strzepek, R., Gower, J., McKay, R. M., Abraham, E., Arychuk, M., Barwell-Clarke, J., Crawford, W., Crawford, D., Hale, M., Harada, K., Johnson, K., Kiyosawa, H.,
5
Kudo, I., Marchetti, A., Miller, W., Needoba, J., Nishioka, J., Ogawa, H., Page, J., Robert, M., Saito, H., Sastri, A., Sherry, N., Soutar, T., Sutherland, N., Taira, Y., Whitney, F., Wong, S. K. E., and Yoshimura, T.: The decline and fate of an iron-induced subarctic phytoplankton bloom, Nature, 428, 549–553, 2004.
Bowie, A. R., et al.: Iron budgets for trhee distrinct biogeochemical sites around the Kerguenlen
10
plateau (Southern Ocean) during the natural fertilization experiment KEOPS2, submitted, this issue, 2014.
Broecker, W. S., Takahashi, T., and Takahashi, T.: Sources and flow patterns of deep-ocean waters as deduced from potential temperature, salinity and initial phosphate concentration, J. Geophys. Res., 90, 6925–6939, 1985.
15
Buesseler, K. O. and Boyd, P. W.: Shedding light on processes that control particle export and flux attenuation in the twilight zone, Limnol. Oceanogr., 54, 1210–1232, 2009.
Buesseler, K. O., Andrews, J. E., Pike, S. M., and Charette, M. A.: The effect of iron fertilization on carbon sequestration in the Southern Ocean, Science, 304, 414–417, 2004.
Buesseler, K. O., Andrews, J. E., Pike, S. M., Charette, M. A., Goldson, L. E., Brzezinski, M. A.,
20
and Lance, V. P.: Particle export during the Southern Ocean Iron Experiment (SOFeX), Lim-nol. Oceanogr., 50, 311–327, 2005.
Buesseler, K. O., Lamborg, C. H., Boyd, P. W., Lam, P. J., Trull, T. W., Bidigare, R. R., Bishop, J. K. B., K. L., Casciotti, Dehairs, F., Elskens, M., Honda, M., Karl, D. M., Siegel, D. A., Silver, M. W., Steinberg, D. K., Valdes, J., Van Mooy, B., and Wilson, S.: Revisiting carbon flux through
25
the ocean’s twilight zone, Science, 316, 567–569, 2007.
Cardinal, D., Dehairs, F., Cattaldo, T., and André, L.: Constraints on export and advection in the Subantarctic and Polar Front Zones, south of Australia from the geochemistry of suspended particles, J. Geophys. Res.-Oceans, 106, 31637–31656, doi:10.1029/2000JC000251, 2001. Cardinal, D., Savoye, N., Trull., T. W., André, L., Kopczynska, E., and Dehairs, F.: Particulate Ba
30
BGD
11, 9035–9069, 2014Early season mesopelagic C remineralization and
transfer efficiency
S. H. M. Jacquet et al.
Title Page
Abstract Introduction
Conclusions References
Tables Figures
◭ ◮
◭ ◮
Back Close
Full Screen / Esc
Printer-friendly Version Interactive Discussion
Discussion
P
a
per
|
Discus
sion
P
a
per
|
Discussion
P
a
per
|
Discussion
P
a
per
|
Cavagna, A. J., et al.: Biological productivity regime and in-situ methods comparison around the Kerguelen Island in the Southern Ocean, submitted, this issue, 2014.
Dehairs, F., Chesselet, R., and Jedwab, J.: Discrete suspended particles of barite and the barium cycle in the open ocean, Earth Planet. Sc. Lett., 49, 40–42, 1980.
Dehairs, F., Baeyens, W., and Goeyens, L.: Accumulation of suspended barite at mesopelagic
5
depths and export production in the Southern Ocean, Science, 258, 1332–1335, 1992. Dehairs, F., Shopova, D., Ober, S., Veth, C., and Goeyens, L.: Particulate barium stocks and
oxygen consumption in the Southern Ocean mesopelagic water column during spring and early summer: relationship with export production, Deep-Sea Res. Pt II, 44, 497–516, 1997. Dehairs, F., Jacquet, S. H. M., Savoye, N., van Mooy, B., Buesseler, K., Bishop, J., Lamborg, C.,
10
Elskens, M., Baeyens, W., Casciotti, K., and Monnin, C.: Barium in twilight zone suspended matter as proxy for organic carbon mineralization: results for the North Pacific, Deep-Sea Res. Pt. II, 55, 1673–1683, 2008.
Dehairs, F., et al.: Nitrate isotopic composition in the Kerguelen area (Southern Ocean) during KEOPS2, submitted, this issue, 2014.
15
D’ovidio, F., et al.: Pathway of iron dispersion offKergueln plateau: the role of horizontal stirring, submitted, this issue, 2014.
Dymond, J. R., Suess, E., and Lyle, M.: Barium in deep-sea sediment: a geochemical proxy for paleoproductivity, Paleoceanography, 7, 163–181, 1992.
Ellison, S. L. R.: Eurachem/CITAC Guide CG4, Quantifying Uncertainty in Analytical
Measure-20
ment, 2nd edn., edited by: Ellison, S. L. R., Rosslein, M., and Williams, A., 120 pp., 2000. François, R., Honjo, S., Krishfield, R., and Manganini, S.: Factors controlling the flux of
or-ganic carbon to the bathypelagic zone of the ocean, Global Biogeochem. Cy., 16, 1087, doi:10.1029/2001GB001722, 2002.
Gervais, F., Riebesell, U., and Gorbunov, M. Y.: Changes in primary productivity and chlorophyll
25
a in response to iron fertilization in the southern Polar Frontal Zone, Limnol. Oceanogr., 47, 1324–1335, 2002.
Hoffmann, L., Peeken, I., Lochte, K., Assmy, P., and Veldhuis, M.: Different reactions of South-ern Ocean phytoplankton size classes to iron fertilization, Limnol. Oceanogr., 51, 1217–1229, 2006.
30
BGD
11, 9035–9069, 2014Early season mesopelagic C remineralization and
transfer efficiency
S. H. M. Jacquet et al.
Title Page
Abstract Introduction
Conclusions References
Tables Figures
◭ ◮
◭ ◮
Back Close
Full Screen / Esc
Printer-friendly Version Interactive Discussion
Discussion
P
a
per
|
Discus
sion
P
a
per
|
Discussion
P
a
per
|
Discussion
P
a
per
|
Jacquet, S. H. M., Dehairs, F., Elskens, M., Savoye, N., and Cardinal, D.: Barium cycling along WOCE SR3 line in the Southern Ocean, Mar. Chem., 106, 33–45, 2007.
Jacquet, S. H. M., Dehairs, F., Savoye, N., Obernosterer, I., Christaki, U., Monnin, C., and Cardinal, D.: Mesopelagic organic carbon mineralization in the Kerguelen Plateau region tracked by biogenic particulate Ba, Deep-Sea Res. Pt. II, 55, 868–879, 2008a.
5
Jacquet, S. H. M., Savoye, N., Dehairs, F., Strass, V., and Cardinal, D.: Mesopelagic carbon min-eralization during the European Iron Fertilization Experiment (EIFEX), Glob. Biogeochem. Cy., 22, GB1023, doi:10.1029/2006GB002902, 2008b.
Jacquet, S. H. M., Dehairs, F., Becquevort, S., Dumont, I., Cavagna, A., and Cardinal, D.: Twi-light zone organic carbon remineralization in the PFZ and SAZ south of Tasmania (Southern
10
Ocean), Deep-Sea Res. Pt. II, 58, 2222–2234, doi:10.1016/j.dsr2.2011.05.029, 2011a. Jacquet, S. H. M., Lam, P., Trull, T., and Dehairs, F.: Carbon export production in the Polar
front zone and Subantarctic Zone south of Tasmania, Deep-Sea Res. Pt. II, 58, 2277–2292, doi:10.1016/j.dsr2.2011.05.035, 2011b.
Jouandet, M. P., et al.: Particles distribution in contrasted area of the iron fertilized region around
15
Kerguenlen Islans, in preparation, this issue, 2014.
Lampitt, R. S. and Antia, A. N.: Particle flux in deep seas: regional characteristics and temporal variability, Deep-Sea Res. Pt. I, 44, 1377–1403, 1997.
Lasbleiz, M., et al.: Particulate matter distribution in relation to phytoplakton community struc-ture in the Fe-fertilized Kergueln region of the SOuthern Ocean during austral spring
20
(KEOPS2), submitted, this issue, 2014.
Laurenceau, E., et al.: The relative importance of phytodetrital aggregates and fecal pellets in the control of export fluxes from naturally iron-fertilised waters near the Kerguelen plateau, submitted, this issue, 2014.
Lefèvre, D., Guigue, C., and Obernosterer, I.: The metabolic balance at two contrasting sites
25
in the Southern Ocean: the iron-fertilized Kerguelen area and HNLC waters, Deep-Sea Res. Pt. II, 55, 766–776, doi:10.1016/j.dsr2.2007.12.006, 2008.
Longhurst, A. R., Bedo, A. W., Harrison, W. G., Head, E. J. H., and Sameoto, D. D.: Vertical flux of respiratory carbon by oceanic diel migrant biota, Deep-Sea Res., 37, 685–694, 1990. Martin, J. H., Knauer, G. A., Karl, D. M., and Broenkow, W. W.: VERTEX: carbon cycling in the
30
NE Pacific, Deep-Sea Res., 34, 267–285, 1987.
BGD
11, 9035–9069, 2014Early season mesopelagic C remineralization and
transfer efficiency
S. H. M. Jacquet et al.
Title Page
Abstract Introduction
Conclusions References
Tables Figures
◭ ◮
◭ ◮
Back Close
Full Screen / Esc
Printer-friendly Version Interactive Discussion
Discussion
P
a
per
|
Discus
sion
P
a
per
|
Discussion
P
a
per
|
Discussion
P
a
per
|
Morris, P. J. and Charette, M. A.: A synthesis of upper oceancarbon and dissolved iron budgets for Southern Ocean natural iron fertilization studies, Deep-Sea Res., 90, 147–157, 2013. Mosseri, J., Quéguiner, B., Armand, L. K., and Cornet-Barthaux, V.: Impact of iron on silicon
utilization by diatoms in the Southern Ocean: a case study of Si/N cycle decoupling in a natu-rally iron-enriched area, Deep-Sea Res. Pt. II, 55, 801–819, doi:10.1016/j.dsr2.2007.12.003,
5
2008.
Park, Y., et al.: Water masses and criculation in the Poalr Front region east of the Kerguelen Islands, submitted, this issue, 2014.
Planchon, F., Cavagna, A.-J., Cardinal, D., André, L., and Dehairs, F.: Late summer particulate organic carbon export and twilight zone remineralisation in the Atlantic sector of the Southern
10
Ocean, Biogeosciences, 10, 803–820, doi:10.5194/bg-10-803-2013, 2013.
Planchon, F., et al.: Carbon export in the naturally iron-fertilized Kerguelen area of the Southern Ocean using 234Th-based approach, in preparation, this issue, 2014.
Pollard, R. T., Salter, I., Sandars, R. J., Lucas, M. I., Mark Moore, C., Mills, R. A., Statham, P. J., Allen, J. T., Baker, A. R., Bakker, C. E., Charrette, M. A., fielding, S., Fones, G. R.,
15
French, M., Hickman, A. E., Holland, R. J., Hughes, J. A., Jickells, T. D., Lampitt, R. S., Morris, P. J., Nédélec, F. H., Nielsdottir, M., Planquette, H., Popova, E. E., Poulton, A. J., Read, J. F., Seeyave, S., Smith, T., Stinchcombe, M., Taylor, S., Thomalla, S., Venables, H. J., Williamson, R., and Zubkov., M.: Southern Ocean deep-water carbon export enhanced by natural iron fertilization, Nature, 457, 577–580, doi:10.1038/nature07716, 2009.
20
Ridgway, K. R. and Dunn, J. R.: Observational evidence for a Southern Hemisphere oceanic supergyre, Geophy. Res. Lett, 34, L13612, doi:10.1029/2007GL030392, 2007.
Salter, I., Lampitt, R. S., Sanders, R., Poulton, A., Kemp, A. E. S., Boorman, B., Saw, K., and Pearce, R.: Estimating carbon, silica and diatom export from a naturally fertilised phytoplank-ton bloom in the Southern Ocean using PELAGRA: a novel drifting sediment trap, Deep-Sea
25
Res. Pt. II, 54, 2233–2259, 2007.
Sarmiento, J. L., Slater, R. D., Fasham, M. J. R., Ducklow, H. W., and Toggweiler, J. R.: A sea-sonal three-dimensional ecosystem model of nitrogen cycling in the North Atlantic photic zone, Global Biogeochem. Cy., 7, 417–450, 1993.
Savoye, N., Trull, T., Jacquet, S. H. M., Navez, J., and Dehairs, F.:234Th-derived export fluxes
30
during a natural iron fertilization experiment (KEOPS), Deep-Sea Res. Pt. II, 55, 841–855, 2008.
BGD
11, 9035–9069, 2014Early season mesopelagic C remineralization and
transfer efficiency
S. H. M. Jacquet et al.
Title Page
Abstract Introduction
Conclusions References
Tables Figures
◭ ◮
◭ ◮
Back Close
Full Screen / Esc
Printer-friendly Version Interactive Discussion
Discussion
P
a
per
|
Discus
sion
P
a
per
|
Discussion
P
a
per
|
Discussion
P
a
per
|
Schneider, B., Bopp, L., and Gehlen, M.: Assessing the sensitivity of modeled airsea CO2 exchange to the remineralization depth of particulate organic and inorganic carbon, Global Biogeochem. Cy., 22, GB3021, doi:10.1029/2007GB003100, 2008.
Shopova, D., Dehairs, F., and Baeyens, W.: A simple model of biogeochemical element distri-bution in the oceanic water column, J. Marine Syst., 6, 331–344, 1995.
5
Smetacek, V., Klass, C., Strass, V. H., Assmy, P., Montresor, M., Cisewki, B., Savoye, N., Webb, A., d’Ovidio, F., Arrieta, J. M., Bathmann, U., Bellerby, R., Mine Berg, G., Croot, P., Gonza-lez, S., Jenjes, J., Herndl, G.J., Hoffmann, L.J., Leach, H., Losh, M., Mills, M. M., Neill, C., Peeken, I., Rottgers, R., Sachs, O., Sauter, E., Schmidt, M. M., Schwarz, J., Terbruggen, A., amd Wolf-Gladrow, D.: Deep carbon export from a Southern Ocean iron-fertilized diatom
10
bloom, Nature, 487, 313–319, doi:10.1038/nature11229, 2012.
Strass, V., Cisewski, B., Gonzales, S., Leach, H., Loquay, K.-D., Prandke, H., Rohr, H., and Thomas, M.: The physical setting of the European Iron Fertilization Experiment “EIFEX” in the Southern Ocean, Reports on Polar and Marine Research, 500, 15–49, 2005.
Stroobants, N., Dehairs, F., Goeyens, L., Vanderheijden, N., and Van Grieken, R.: Barite
forma-15
tion in the Southern Ocean water column, Mar. Chem., 35, 411–422, 1991.
Taylor, S. R. and McLennan, S. M.: The Continental Crust: its Composition and Evolution, Blackwell Scientific Publications, 312 pp., 1985.
Trull, T., et al.: Phytoplankton size and compositions variations in naturally iron fertilised South-ern Ocean waters: evidence for differing propensities for carbon export in waters dowstrem
20
versus over the Kerguelen plateau, in preparation, this issue, 2014.
Vandermerve, P., et al.: Sourcing the iron in the naturally-fertilised bloom around the Kerguelen plateau: particulate trace metal dynamics, submitted, this issue, 2014.
Venchiarutti, C., Jeandel, C., and Roy-Barman, M.: Particle dynamics study in the wake of Kerguelen Island using thorium isotopes, Deep-Sea Res. Pt. I, 55, 1343–1363, 2008.
25
Zhou, M., Zhu, Y., Dorland, R. D., and Measures, C. I.: Dynamics of the current system in the southern Drake Passage, Deep-Sea Res. Pt. I, 57, 1039–1048, 2010.
Zhou, M., Zhu, Y., Measures, C. I., Hatta, M., Charette, M. A., Gille, S. T., Frants, M., Jiang, M., and Mitchell, B. G.: Winter mesoscale circulation on the shelf slope region of the southern Drake Passage, Deep-Sea Res. Pt. II, 90, 4–14, 2013.
30
BGD
11, 9035–9069, 2014Early season mesopelagic C remineralization and
transfer efficiency
S. H. M. Jacquet et al.
Title Page
Abstract Introduction
Conclusions References
Tables Figures
◭ ◮
◭ ◮
Back Close
Full Screen / Esc
Printer-friendly Version Interactive Discussion
Discussion
P
a
per
|
Discus
sion
P
a
per
|
Discussion
P
a
per
|
Discussion
P
a
per
|
Table 1.Station locations, casts number and bottom depth during KEOPS 2. Depth-weighted
average values (DWAv) of mesopelagic Baxs(pM) and Baxsbased mesopelagic POC
reminer-alization (MR; mg C m−2d−1) integrated between 150–400 and 150–800 m depths. See text for further information on calculation.
Station CTD Long Lat Date of Seafloor DWAvb
DWAv MRc
MR Stnd MR MR Stnd
cast # (◦
E) (◦
S) sampling [m] Baxs[pM] Baxs[pM] 150–400 m Uncertainty 150–800 m Uncertainty
150–400 m 150–800 m [mg C m−2
d−1
] % [mg C m−2
d−1
] %
Plateau
A3-1 4a
72.080 50.629 20 Oct 2011 530 316 / 14 4 / /
A3-2 107a
72.056 50.624 16 Nov 2011 527 267 / 11 5 / /
TEW-3 38 71.018 48.799 31 Oct 2011 560 324 / 28 8 / /
Meander time series
TNS-6 10 72.277 48.779 22 Oct 2011 1885 427 389 31 7 69 17
E-1 27/30 72.187 48.458 29, 30 Oct 2011 2056 387 325 26 6 48 14
E-2 43 72.077 48.523 1 Nov 2011 2003 301 309 15 5 42 13
E-3 50/55 71.967 48.702 3, 4 Nov 2011 1915 258 286 10 4 35 12
E-4E 94/97 72.563 48.715 13, 14 Nov 2011 2210 395 357 27 7 58 15
E-5 113/114 71.900 48.412 18 Nov 2011 1920 402 380 28 7 66 17
Polar Front Zone
TNS-1 15 71.501 46.833 23 Oct 2011 2280 350 315 22 6 45 14
TEW-8 47 74.999 48.471 2 Nov 2011 2786 199 240 2 4 20 11
F-L 63/68 74.659 48.532 6, 7 Nov 2011 2695 345 328 21 6 49 14
Polar Front
E-4W 81/87 71.425 48.765 11, 12 Nov 2011 1384 468 411 36 8 76 18
Antarctic Zone
R-2 (Reference site) 17/20 66.717 50.359 25, 26 Oct 2011 2300 572 456 50 10 91 20
TNS-8 8 72.240 49.463 21 Oct 2011 1030 473 358 37 8 59 15
aStation A3 (CTD #4 and #107); integration up to 354 and 405 m.
BGD
11, 9035–9069, 2014Early season mesopelagic C remineralization and
transfer efficiency
S. H. M. Jacquet et al.
Title Page
Abstract Introduction
Conclusions References
Tables Figures
◭ ◮
◭ ◮
Back Close
Full Screen / Esc
Printer-friendly Version Interactive Discussion
Discussion
P
a
per
|
Discus
sion
P
a
per
|
Discussion
P
a
per
|
Discussion
P
a
per
|
Table 2.Comparison of mesopelagic POC remineralization (MR) with primary production (PP)
and export production (EP). All fluxes in mg C m−2 d−1
.rratio is the ratio of Mr over EP. The C sequestration (or transfer) efficiency at 400 and 800 m (T400, T800) is the fraction of C export (EP) at 150 m exiting through the 400 m (T400) or the 800 m (T800) horizons. See text for further information on calculation.
Station CTD MLD Ezb PPcEz EPd MR MR EP/PP rratio rratio T400 T800
[m] [m] [mg C m−2d−1] 150 m 150–400 m 150–800 m 150–400 m 150–800 m
[mg C m−2d−1] [mg C m−2d−1] [mg C m−2d−1]
Plateau
A3-1 4a 161 / / 47 14 / / 0.29 / 0.70 /
A3-2 107a 165 38 2172 85 11 / 0.04 0.13 / 0.87 /
Reference site
R-2 17/20 111 92 132 30 50 91 0.23 1.65 3.02 1.65 3.02 Meander time series
E-1 27/30 84 64 578 100 26 48 0.17 0.26 0.48 0.74 0.52 E-3 50/55 41 68 748 130 10 35 0.17 0.08 0.27 0.92 0.73 E-4E 94/97 77 34 1037 48 27 58 0.05 0.57 1.21 0.43 1.21 E-5 113/114 36 54 1064 84 28 66 0.08 0.33 0.78 0.67 0.22 Polar Front Zone
F-L 63/68 21 29 3380 43 21 49 0.01 0.48 1.13 0.52 1.13 Polar Front
E-4W 81/87 67 31 3287 54 36 76 0.02 0.67 1.41 0.33 1.41
a
Station A3 (CTD4 and 107); MR integrated up to 354 and 405 m.
bEZ euphotic layer (till 1 % PAR level). cPP data from Cavagna et al. (2014). d