www.atmos-chem-phys.net/8/3623/2008/ © Author(s) 2008. This work is distributed under the Creative Commons Attribution 3.0 License.
Chemistry
and Physics
The role of iron and black carbon in aerosol light absorption
Y. Derimian1,4, A. Karnieli1, Y. J. Kaufman2, M. O. Andreae3, T. W. Andreae3, O. Dubovik4, W. Maenhaut5, and I. Koren6
1Major part of this study was done while at: Jacob Blaustein Institute for Desert Research, Ben Gurion University of the Negev, Israel
2NASA Goddard Space Flight Center, NASA Goddard SFC, USA 3Max Planck Institute for Chemistry, Mainz, Germany
4Laboratoire de Optique Atmosph´erique, Universit´e de Lille 1/CNRS, Villeneuve d’Ascq, France
5Ghent University (UGent), Department of Analytical Chemistry, Institute for Nuclear Sciences, Gent, Belgium 6Department of Environmental Sciences, Weizmann Institute, Rehovot 76100, Israel
Received: 8 May 2007 – Published in Atmos. Chem. Phys. Discuss.: 13 June 2007 Revised: 26 February 2008 – Accepted: 3 June 2008 – Published: 10 July 2008
Abstract. Iron is a major component of atmospheric aerosols, influencing the light absorption ability of mineral dust, and an important micronutrient that affects oceanic bio-geochemistry. The regional distribution of the iron concen-tration in dust is important for climate studies; however, this is difficult to obtain since it requires in-situ aerosol sam-pling or simulation of complex natural processes. Simultane-ous studies of aerosol chemical composition and radiometric measurements of aerosol optical properties, which were per-formed in the Negev desert of Israel continuously for about eight years, suggest a potential for deriving a relationship be-tween chemical composition and light absorption properties, in particular the spectral single-scattering albedo.
The two main data sets of the present study were obtained by a sun/sky radiometer and a stacked filter unit sampler that collects particles in coarse and fine size fractions. Analysis of chemical and optical data showed the presence of mixed dust and pollution aerosol in the study area, although their sources appear to be different. Spectral SSA showed an evi-dent response to increased concentrations of iron, black car-bon equivalent matter, and their mixing state. A relationship that relates the spectral SSA, the percentage of iron in total particulate mass, and the pollution components was derived. Results calculated, using this relationship, were compared with measurements from dust episodes in several locations around the globe. The comparison showed reasonable
agree-Correspondence to:Y. Derimian
ment between the calculated and the observed iron concen-trations, and supported the validity of the suggested approach for the estimation of iron concentrations in mineral dust.
1 Introduction
dust deposition is significant (Gao et al., 2001; Wiggert et al., 2006).
Transported aeolian dust can be contaminated by anthro-pogenic aerosols and thus contain products of industrial and motor vehicle combustion emissions, or products of biomass burning. Such aerosols contain light-absorbing carbon that is a strong absorber and therefore contributes to global warm-ing (Jacobson, 2004; Chung and Seinfeld, 2005). Dubovik et al. (2002a) showed that the spectral absorption of pollution aerosols is distinctive from that of mineral dust. The spec-tral absorption properties of light-absorbing carbon depend on the origin of the material and combustion conditions (An-dreae and Gelencser, 2006; Schkolnik et al., 2007). Strongly absorbing black soot particles are commonly called black carbon (BC) and are characterized by a decrease of absorp-tion towards long wavelengths proporabsorp-tional to 1/λ (Kirch-stetter et al., 2004). In addition, the combustion of organic matter, such as biomass, or smoldering combustion may produce particles containing light-absorbing organic com-pounds. These particles have relatively strong absorption in the UV, and are denoted as brown carbon; they are suggested to be of higher relevance for regions outside of those that are highly industrialized and for cases where light absorption is not dominated by pure soot (Andreae and Gelencser, 2006). Here we will use the quantity “black carbon” (BC), oper-ationally defined as the amount of strongly light-absorbing carbon with the approximate optical properties of soot car-bon, which would give the same signal in our optical instru-ment as the sample. While the term “BC” has become com-mon usage in various contexts, the operationally defined BC implies an optically equivalent meaning (Hansen et al., 1984; Bond and Bergstrom, 2006). In the present study we would like to emphasize the optical equivalency of the measured values.
Several approaches can be used for evaluation of iron or BC concentrations in particulate matter, e.g., in-situ sam-pling of atmospheric aerosol particles with further laboratory analysis. However, in-situ sampling requires considerable effort, and can even be impossible for providing results of wide spatial and temporal coverage. Another possibility is to employ chemistry transport model simulations. Although models are able to represent anthropogenic emissions, the ad-equate estimation of BC concentrations remains challenging (Bond et al., 2004; Streets et al., 2004). The prediction of natural components, such as iron concentrations, depends on wind speeds and local mineralogy, and thus may carry even more uncertainty (Kaufman et al., 2005a). An additional ap-proach is modeling of aerosol optical properties (Sokolik and Toon, 1999), which can be employed for inversion of mea-surable aerosol optical characteristics and deriving concen-trations of chemical elements. Modeling of complex refrac-tive index, aerosol scattering and absorption coefficients for various combinations of minerals was recently improved by incorporation of the results of specifically designed measure-ments (Lafon et al., 2006). In their study Lafon et al. (2006)
composed dust mixtures from some key minerals, including hematite and goethite, typically found in soils and aerosol samples. Laboratory-obtained information on the fraction of minerals in different size modes was included in the mod-eling of aerosol optical properties. Schuster et al. (2005) demonstrated an approach of inversion of AERONET re-trievals into chemical elements concentrations (namely BC) and specific absorption, using an effective medium approx-imation. This approximation enables effective optical con-stants calculation of internally mixed chemical elements in various volume fractions. An advantage of the approach sug-gested by Schuster et al. (2005) lies in tying the effective medium approximation to real optical measurements of am-bient aerosols. Alfaro et al. (2004) employed aethalometer and nephelometer laboratory measurements to experimen-tally derive the spectral mass absorption efficiency and SSA of dust aerosols. They also estimated the relative contri-butions for the mixture of iron oxides and BC on dust ab-sorption. They found agreement between the calculated SSA and the one derived from the inversion of sun/sky radiome-ter measurements (Dubovik and King, 2000). Other studies showed the possibility of deconvoluting dust and BC spectral absorption and scattering properties, and thereby inferring iron and BC concentrations. For instance, Fialho et al. (2005) differentiated the absorption spectral dependence of dust and BC measured by an aethalometer. In a subsequent study, Fi-alho et al. (2006) calibrated these measurements with Fe on the filters, and derived empirical calibration constants for the determination of the iron concentration from the aethalome-ter observations. Koven and Fung (2006) employed a similar concept of absorption spectral dependence for the characteri-zation of dust composition; however, they studied sun/sky ra-diometer measurements through the whole atmospheric col-umn (AERONET) and incorporated the mineralogical effects by using different modeled relative fractions of hematite, sil-icate and BC.
in real atmospheric aerosols.
The general motivation for this study was to assess iron concentrations in atmospheric dust by aerosol spectral ab-sorption. The iron concentration in total dust mass can be useful for estimating the amounts of iron deposited to the ocean. We have analyzed the differential aerosol spectral ab-sorption from the blue to the NIR (near infrared) spectral re-gion, which should be proportional to the associated concen-trations of iron and BC. In this study, we consider concentra-tions of total iron, and assume that the optically relevant iron oxides represent a fixed part of the total iron in airborne min-eral dust. This iron oxide to total iron ratio may be unique for a given location with its specific sources, but at the end of Sect. 4.6 we discuss the reliability and restrictions of this as-sumption. The aerosol spectral absorption was obtained by inversion of sun/sky radiometer measurements (AERONET product). The aerosol chemical composition was obtained from aerosol sampling at ground level. Specific objectives were: (1) to correlate data sets for events where ground level aerosol chemistry was found to be representative for the total column optical measurement; (2) to estimate the contamina-tion of atmospheric dust by BC and its role in aerosol spec-tral absorption; and (3) to derive a relationship between iron concentrations and differential aerosol spectral absorption.
2 Site location
Measurements were conducted at the Sede Boker (in some sources referred to as Sde Boker) Campus of the Ben-Gurion University of the Negev (30◦51′N, 34◦47′E, 470 m a.m.s.l.), Israel. The site is located in the eastern Mediterranean re-gion, characterized by relatively high levels of tropospheric aerosol burden due to the influence of anthropogenic aerosols that originate mainly from Europe, and mineral dust from the North African, Sinai, and Saudi Arabian deserts (Ichoku et al., 1999; Formenti et al., 2001; Andreae et al., 2002; Gera-sopoulos et al., 2003; Israelevich et al., 2003; Kubilay et al., 2003). Specifically, Sede Boker is situated in the northern part of the Negev Desert, relatively far from highly populated and industrial areas. The climate is dry, with a mean annual precipitation of 100–200 mm and 20–40 rainy days through-out the year. The average relative humidity at 14:00 local time for July is 30–35% and for January, 40–50% (Stern et al., 1986).
3 Data sets and instrumentation
The main data sets were obtained from a CIMEL sun/sky radiometer, part of the global Aerosol Robotic Network (AERONET), and a “Gent” PM10 stacked filter unit (SFU) sampler. Additional data were obtained from a single-wavelength integrating nephelometer and a scanning electron microscope (SEM) equipped with an energy dispersive spec-trometer (EDS).
3.1 Sun/sky radiometer
The AERONET program is an automatic robotic sun and sky scanning measurement initiative (Holben et al., 1998). A CIMEL spectral radiometer performs direct sun measure-ments every 15 min, with a 1.2◦field of view at 340, 380,
440, 500, 675, 870, 940, and 1020 nm nominal wavelengths. The spectral aerosol optical thickness (AOT orτext)was re-trieved at seven of these wavelengths from the direct sun measurements; the 940 nm channel was used to retrieve wa-ter vapor content. The angular distribution of sky radiance was also measured at 440, 670, 870, and 1020 nm. The measured spectral sun and sky radiances were used to re-trieve aerosol optical parameters at four wavelengths by the AERONET inversion code (Dubovik and King, 2000).
In this paper we utilize data from Version 2 (V2) inver-sion products. V2 inverinver-sion partitions aerosol particles into spherical and non-spherical components, which are modeled by an ensemble of polydisperse, homogeneous spheres and a mixture of polydisperse, randomly-oriented homogeneous spheroids (Mishchenko et al., 1997) with a fixed spheroid as-pect ratio distribution (Dubovik et al., 2006). The retrievals utilized also contain redefined surface reflectance properties, which are obtained by the inclusion of combined satellite data, and which account for possible improvements in re-trieved aerosol properties and single-scattering albedo in par-ticular (Sinyuk et al., 2007). In addition, all restrictions rec-ommended in Dubovik et al. (2002a) for reliability of the inversion product were applied. More details on the devel-opment of the retrieval algorithm, modifications and accu-racy assessments can be found in Dubovik and King (2000), Smirnov et al. (2000), Dubovik et al. (2000; 2002a; 2002b), and Sinuyk et al. (2007).
3.2 “Gent” PM10 stacked filter unit sampler
particulate mass (PM), inµg m−3, for over 40 elements in-cluding Fe, in ng m−3, and black carbon (BC), also in µg m−3. The PM was measured using gravimetry at 20◦C and
50% relative humidity. The uncertainty associated with the weighing is usually less than 3% for the coarse PM and less than 5% for the fine PM. More than 40 elements were mea-sured using a combination of instrumental neutron activation analysis (INAA) and particle-induced X-ray emission anal-ysis (PIXE). BC, that is black carbon corresponding to a measured light extinction at fixed mass absorption efficiency, was measured by a light reflectance technique. The measure-ments were performed with a commercial smoke stain reflec-tometer (Diffusion Systems Ltd, London, UK, model 43) that uses white light. Instead of assuming a mass absorption effi-ciency (MAE, in m2g−1), the instrument was calibrated with secondary standards for BC determination. These secondary standards were produced by depositing soot from acetylene burning on filters. The MAE that corresponds to the cali-bration factor obtained by reflectance measurements of the secondary standards is estimated as being around 5 m2g−1. More details about the SFU samples and the chemical analy-sis, including studies conducted at the Sede Boker site, have been discussed by Maenhaut et al. (1996a; 1996b; 1997) and Andreae et al. (2002). In addition, in Sect. 4.2 we will dis-cuss the possible effects of extra light absorption by other species and their contribution to the BC signal.
3.3 Nephelometer
The Integrating Nephelometer (M903, Radiance Research, Seattle, WA, USA) measures the light scattering extinction coefficient (σscat)with a 2-min resolution at a wavelength of 545 nm, with a scattering angular range of 7–170◦. The instrument is operated indoors and air is supplied through a plastic tubing of up to 3 m length and of 2.2 cm internal diam-eter. The inlet of the tubing is located outdoors at about 10 m above ground level and faces downwards. Pressure, temper-ature, and relative humidity (RH) in the scattering volume of the instrument are also monitored and recorded. In order to eliminate a non-linear increase inσscat due to high humid-ity, the data with RH>80% were removed (Andreae et al., 2002).
3.4 Scanning electron microscope
The high-resolution field emission scanning electron micro-scope (SEM) LOE 1530, equipped with an energy dispersive X-ray (EDX) spectrometer, at the Max Planck Institute for Chemistry, Mainz, was used for visualization and qualitative analysis of individual aerosol particles collected on the Nu-clepore polycarbonate filters of the SFU samples. The work-ing conditions for the images presented here were set at an accelerating voltage of 5 or 15 kV and magnification varied from about 70 000X to 400 000X. This enabled the
observa-tion of particles and their structures in sizes from a few tens to hundreds of nanometers.
4 Data analysis and discussion
This section presents an analysis of aerosol absorption ob-tained from radiometric measurements (Sect. 4.1.), aerosol chemistry obtained from in-situ surface sampling (Sect. 4.2. and 4.3.), their integration (Sect. 4.4.), and development of a physical model for establishing the relationship between aerosol spectral absorption and chemistry (Sect. 4.5). The proposed relationship is examined with data for several loca-tions (Sect. 4.6).
4.1 Radiometric observations
The single-scattering albedo (SSA orω0)is the ratio of light scattering to total light extinction (scattering and absorption) and represents scattering effectiveness relative to total extinc-tion. Therefore, SSA decreases when absorption increases. Mineral dust and aerosol particles originating from combus-tion processes have different wavelength dependencies for SSA (Dubovik et al., 2002a). This difference in aerosol spec-tral absorption is predominantly related to absorption by two components, iron oxide and black carbon. The SSA for min-eral dust usually decreases towards short wavelengths due to the presence of iron oxide. The SSA for anthropogenic pol-lution aerosols that contain BC decreases towards long wave-lengths (Dubovik et al., 2002a). Thus, the presence of iron oxide or BC in aerosols can be determined by examining the behavior of the spectral SSA.
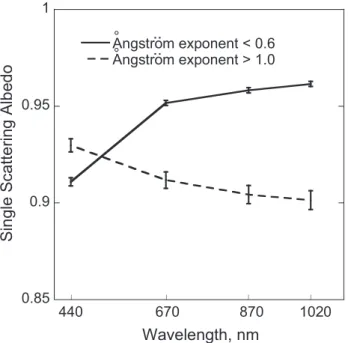
The mean spectral single-scattering albedo obtained dur-ing about eight years of measurements at Sede Boker for periods with predominantly coarse ( ˚Angstr¨om exponent (˚a)<0.6) and increased contribution of fine (˚a>1.0) aerosol, respectively, is presented in Fig. 1. The ˚Angstr¨om exponent represents the wavelength dependence of extinction and is calculated by
˚a= −ln τ
870 ext/τext440
ln λ870/λ440. (1)
0.85 0.9 0.95 1
Angstrom exponent < 0.6 Angstrom exponent > 1.0
440
S
ing
le
S
c
a
tt
e
ri
n
g A
lbe
do
Wavelength, nm
670 870 1020
..
..
Fig. 1. Average spectral single-scattering albedo for periods with significant contributions of coarse ( ˚Angstr¨om exponent<0.6) and fine ( ˚Angstr¨om exponent>1.0) aerosol for about eight years of measurements at the Sede Boker site.
effective radius could better describe aerosol size (Eck et al., 1999; Schuster et al., 2006), we prefer to use the ˚Angstr¨om exponent as an easily measurable and always available pa-rameter. It was also found in our test that the ˚Angstr¨om ex-ponent was well correlated with the other aerosol size param-eters.
Figure 2 shows all quality-assured observations of SSA(440)–SSA(1020) versus the ˚Angstr¨om exponent, which were made at the Sede Boker site from October 1995 to May 2006. The data presented in this figure are stratified into dif-ferent ranges of SSA(1020) in order to indicate events with different levels of absorption at 1020 nm. This figure re-veals that, as the ˚Angstr¨om exponent (870 nm–440 nm) in-creases from about zero to about 1.5 (indicating a decreasing contribution of coarse dust particles and increasing fraction of fine pollution particles), spectral SSA gradually changes from stronger absorption at 440 nm to stronger absorption at 1020 nm. It is noteworthy that absorption at 1020 nm is quite weak (marked by red diamonds and blue circles) for events dominated by coarse particles ( ˚Angstr¨om expo-nent about zero). As the contribution from fine particles in-creases ( ˚Angstr¨om exponent from 0.5 to 1.0), absorption is still strongest at 440 nm, but absorption at 1020 nm becomes significant (part of observations marked by green squares). This spectral SSA behavior is related to mixtures of dust and pollution, with characteristic ˚Angstr¨om exponent values in the range from 0.5 to 1.0. As the ˚Angstr¨om exponent con-tinues to increase, which means that the contribution of fine particles increases, absorption at 1020 nm becomes stronger
-0.1 -0.05 0 0.05 0.1
-0.5 0 0.5 1 1.5 2
SSA(1020) => 0.98
0.95 <= SSA(1020) < 0.98 0.90 <= SSA(1020) < 0.95
SSA(1020) < 0.90
SS
A(4
4
0)
- S
S
A(10
2
0
)
Angstrom exponent (870-440)..
Re
ddis
h
Bla
c
kish
Coarse Dominant size class Fine
Fig. 2. Difference of SSA(440 nm)–SSA(1020 nm) versus ˚
Angstr¨om exponent. All observations were conducted at the Sede Boker site from October 1995 to May 2006. Different ranges of SSA(1020 nm) values are presented by different symbols and indi-cate events from weak to strong absorption at 1020 nm.
than at 440 nm and SSA(1020 nm) may reach values of 0.85 (black triangles). Consequently, Fig. 2 classifies spectral SSA for events having dust- or pollution-dominated contri-butions and different degrees of mixing.
4.2 In-situ surface sampling
Concentrations of BC and total Fe at ground level were mea-sured simultaneously with the radiometric measurements. Figure 3 shows the percentage of BC versus the percentage of Fe in the PM10 total particulate mass (TPM). The BC or Fe percentages in the TPM (denoted hereafter as %TPM) were calculated as the sum of BC or Fe concentrations (µg m−3) in the fine and coarse size fractions relative to the sum of the particulate mass concentrations (µg m−3)in the two size fractions. This figure shows a pattern of negative correlation between the percentages of BC and Fe in the TPM. This im-plies that, generally, sources of BC (pollution tracer) and Fe (mainly from dust) are different. Another conclusion, sug-gested by this plot, is that during most of the events both elements are present at measurable concentrations, i.e., that we generally have a mixture of dust and pollution aerosol at our sampling site.
0 2 4 6 8 10 12
0 1 2 3 4
All data
Angstrom exponent < 0.6 Angstrom exponent > 0.7
BC(To
t), %TPM
Fe(Tot), %TPM
..
..
Fig. 3. BC percentage of the total particulate mass (BC, %TPM) versus Fe percentage of the total particulate mass (Fe, %TPM). Black open circles represent all available data, red solid circles ( ˚Angstr¨om exponent<0.6) and open squares ( ˚Angstr¨om exponent
>0.7) represent a subset of data matched to optical column mea-surements.
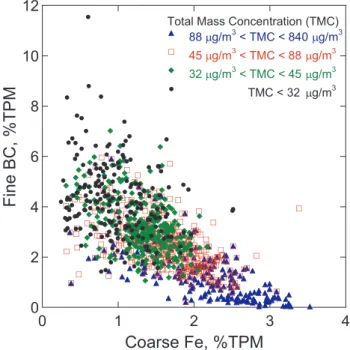
influence of Fe and high mass concentrations on the BC signal (Fig. 4). This figure shows BC, %TPM in the fine fraction, versus Fe, %TPM in the coarse fraction. Different ranges of total mass concentration are indicated by different symbols. Figure 4 reveals that (1) fine BC of pollution origin is not positively correlated with dust-related coarse Fe; (2) increase in mass concentration does not coincide with an in-crease of BC, %TPM in fine fraction; and (3) inin-crease in total mass concentration is clearly coincident with an increase in coarse Fe, %TPM. Later, in Fig. 7, we will also show that the main part of BC is found in the fine and that of Fe in the coarse size fraction. Thus, an increase in Fe, %TPM or total mass concentration does not cause a spurious increase in the measured BC, %TPM.
4.3 Individual particle analysis
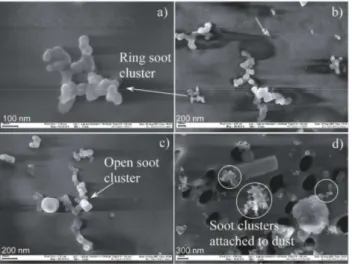
Four pairs of SFU sample filters (coarse and fine) from four dust storm events were analyzed by scanning electron micro-scope (SEM) in order to examine microphysical character-istics and possible mixing of the sampled aerosols. In this paper we present a few images from analyzed dust events on 2 April 2000 and 3 February 2001 in order to illustrate dust and pollution mixing and examples of the observed soot particles. Figure 5 shows images of individual particles col-lected on the fine and coarse filters. It demonstrates the presence of typical ring and open soot clusters that were
0 2 4 6 8 10 12
0 1 2 3 4
88 µg/m3 < TMC < 840 µg/m3 45 µg/m3 < TMC < 88 µg/m3
32 µg/m3 < TMC < 45 µg/m3 TMC < 32 µg/m3
Fin
e
BC, %TPM
Coarse Fe, %TPM
Total Mass Concentration (TMC)
Fig. 4.BC, %TPM in the fine size fraction versus Fe, %TPM in the coarse size fraction. Different symbols indicate different ranges of total mass concentration.
found among dust particles on the coarse filter from the dust event on 2 April 2000, and soot clusters attached to dust that were found on the fine filter from the dust event on 3 Febru-ary 2001. Quite similar pictures were observed on other ana-lyzed filters, where soot clusters were observed between min-eral dust particles, as well as attached to dust particles. 4.4 Data integration
Fig. 5.Scanning electron microscope images of individual particles (a),(b),(c)demonstrate the presence of typical ring and open soot clusters that were found among dust particles on the coarse filter from the dust event on 2 April 2000, and(d)soot clusters attached to dust that were found on the fine filter from the dust event on 3 February 2001.
An additional analysis was conducted to assure represen-tative surface sampling of dust events (˚a<0.6). This analysis employs the ratio ofτextσscatt0as a function of time, where τextis aerosol optical thickness measured through the entire atmospheric column andσscatt0 is the aerosol scattering co-efficient measured by the nephelometer at ground level. This ratio can be used for estimating the equivalent aerosol height or thickness of the aerosol layer, while its time series reflects vertical dynamics of aerosols passing over the site. For ex-ample, if the main aerosol concentration is near the surface or aloft, the value of the ratio will be low or high. In the case of homogeneous vertical aerosol distribution, this will indicate the thickness of the aerosol layer. In the case of aerosol verti-cal non-homogeneity, this will indicate an equivalent aerosol height. More detailed discussion and examples of the ratio τext
σscatt0 usage can be found in (Derimian et al., 2006). Thus, by parallel analysis of the ratioτext
σscatt0andτextas a function of the time, we are able to follow the dynamics of dust events and to distinguish between high altitude dust transport and dust settling episodes. This tool enables the selection of representative filters where chemical character-istics of settled dust were expected to reflect the measured optical properties. Based on the knowledge that pollution aerosols in the study area are generally transported at lower heights (Formenti et al., 2001; 2002a; 2002b) and surface sampling is representative for them, events with ˚a>0.7 were not subjected to additional analysis for vertical dynamics.
Figure 6 presents averaged values of the difference SSA(440)–SSA(1020) versus the ˚Angstr¨om exponent (870– 440) for 25 selected events that cover a wide range of optical data measured during elevated loadings of dust and
pollu--0.1 -0.05 0 0.05 0.1
-0.5 0 0.5 1 1.5 2
SSA(1020) => 0.98 0.95 <= SSA(1020) < 0.98
0.90 <= SSA(1020) < 0.95
SSA(1020) < 0.90
Angstrom exponent (870-440)
SS
A(4
4
0)
- S
S
A(10
2
0
)
..
Fig. 6. Averaged values of the difference SSA(440)–SSA(1020) versus the ˚Angstr¨om exponent for 25 selected events measured dur-ing elevated loaddur-ings of dust and pollution aerosols. The presented data set was matched to the data set on aerosol chemistry.
tion aerosols. This optical data set was matched with aerosol chemistry and selected from the general data set (Figs. 2 and 3) by the above-mentioned criteria. Representation of the covered concentration range of the chemical elements BC and Fe is shown in Fig. 3. The selected data are marked using red circles (˚a>0.7 – increased contribution of fine par-ticles) and squares (˚a<0.6 – increased contribution of coarse particles), over the background of all observations. Unfor-tunately, optical data for extremely high BC concentrations were not available, probably due to some systematic prob-lem such as meteorological conditions, or sky homogeneity that prevented sun/sky radiometer measurements, or that vio-lated the criterion for proper almucantar retrievals. However, the existing optical data were matched to a range of points in Fig. 3 with the highest density of data, i.e., the range of most frequent concentrations. Thus, at this stage we have a set of carefully matched optical and chemical data for 25 dust and pollution loaded events.
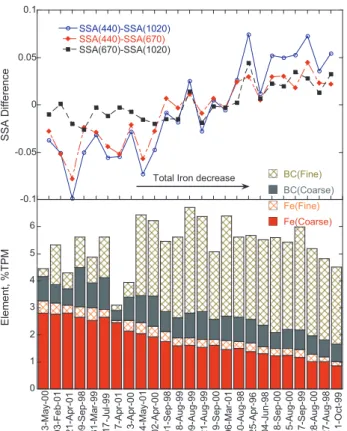
-0.1 -0.05 0 0.05 0.1 SSA(440)-SSA(1020) SSA(440)-SSA(670) SSA(670)-SSA(1020) E lem en t, % T P M
Total Iron decrease
SS A D iffere n c e 0 1 2 3 4 5 6 03-Ma y-00 03-Feb -01 21-Ap r-01 09-Se p-98 31-Ma r-99 17-Ju l-99 17-Ap r-01 13-Ap r-00 24-Ma y-01 02-Ap r-00 01-Se p-98 18-Au g-99 09-Au g-99 21-Au g-99 19-Se p-00 06-Ma r-01 30-Au g-98 25-Ap r-96 04-Ju n-98 18-Se p-00 15-Au g-00 17-Se p-99 28-Au g-00 27-Au g-98 11-Oct-99 BC(Fine) BC(Coarse) Fe(Fine) Fe(Coarse)
Fig. 7. BC and Fe percentage of the total particulate mass in the fine and coarse size fractions for 25 selected events and the corresponding differences of SSA(440)–SSA(1020), SSA(440)– SSA(670), and SSA(670)–SSA(1020). The data are sorted by de-creasing total iron concentration.
The difference SSA(440)–SSA(670) shows negative values in response to dominant iron contribution and gradually be-comes positive as the role of BC increases. The SSA(670)– SSA(1020) response is similar to SSA(440)–SSA(670) and SSA(440)–SSA(1020) only when the contribution of BC is high, however it varies little and is close to zero when the iron contribution is dominant. This implies that spectral SSA from 440 nm to 670 nm responded to both iron and BC, while spectral SSA from 670 nm to 1020 nm generally responded to BC. Figure 7 also shows that the major concentration of iron is in the coarse size fraction, which supports its mineral dust origin, while most of BC is in the fine fraction, which is typical for anthropogenic pollution. In summary, Fig. 7 reveals that SSA retrievals from AERONET are consistent with aerosol chemical composition and suggests a potential for deriving a relationship between retrieved SSA, Fe, and BC.
4.5 Development of relationship equation
The matched data set was employed for deriving the coeffi-cients of a relationship equation which ties spectral SSA with
the Fe and BC percentage in the total particulate mass. The developed relationship includes the difference SSA(440)– SSA(1020), which indicates spectral SSA behavior. This spectral SSA was consistent with Fe and BC concentrations, as was shown above. However, the difference alone repre-sents only relative values and gives no information about the absolute SSA values. The ratio of the difference SSA(440)– SSA(1020) to SSA(1020) carries information about the spec-tral SSA as well as about the absolute values. Therefore it was used for developing equations relating spectral variabil-ity of SSA with the concentrations of the absorbing elements. The ratio of SSA(440)–SSA(1020) to SSA(1020) was ex-pressed in terms of absorption (τabs)and extinction (τext) op-tical thickness at 440 nm and 1020 nm, and then modified by substitutingτext1020with its estimateτext1020≈τext440·440
1020 a˚
=
τext440·0.43a˚. Theτext1020was derived fromτext440using the linear approximation lnτ (λ)=a˚·ln(λ)+βof spectral dependence lnτ (λ), where the coefficient ˚a is the ˚Angstr¨om exponent (Angstrom, 1929; O’Neill et al., 2001; Schuster et al., 2006) (here ˚ais estimated using 440 and 1020 nm). Then, we can write as follows:
ω440−ω1020 ω1020
=
τabs1020 τext1020
−τ 440 abs τext440
1−τ 1020 abs τext1020
=
1 τext440
0.43−a˚·τ1020 abs −τabs440
1− 1
τext440·0.43
−a˚·τ1020
abs
. (2)
Assuming that only Fe and BC are responsible for aerosol absorption, and that Fe absorption at 1020 nm is close to zero (τFe1020→0), we can rewrite Eq. (2) in the following form:
ω440−ω1020 ω1020 =
1 τext440
0.43−a˚·τ1020
BC −τBC440−τFe440
1− 1
τext440 ·0.43
−a˚·τ1020
BC
, (3)
whereτBC andτFe denote absorption optical thickness due to the presence of BC and Fe. Then, the extinction and absorption optical thicknesses in Eq. (3) were unified to one wavelength. Specifically, we used the linear approxi-mation of lnτBC(λ)=a˚BC·ln(λ)+β for the spectral depen-dence of the BC absorption optical thickness (where ˚aBCis the ˚Angstr¨om exponent of the BC absorption spectral depen-dence, e.g. Dubovik et al., 1998) and replacedτBC1020by an estimateτBC1020≈τBC440·0.43a˚BC. As a result, Eq. (3) was trans-formed to the following:
ω440−ω1020
ω1020
=
τBC440 τext440
· 0.43˚aBC−˚a−1−τ 440 Fe τext440
1−τ 440 BC τext440 ·0.43
˚aBC−˚a
. (4)
The aerosol absorption and extinction optical thickness can be represented by integrating over the entire atmospheric column of specific aerosol absorption and extinction proper-ties known in each atmospheric layer:
τabs/ext= H Z
0
wherecabs/total(h) is the concentration of aerosol particles mass per unit of the air volume in each layerh, andk′
abs(h) andk′
ext(h) are coefficients of specific (calculated per unit of aerosol particle mass) absorption and extinction in each atmospheric layer. Assuming that specific aerosol properties do not change vertically, i.e. k′abs/ext(h)=const=K′abs/ext, Eq. (5) can be transformed as follows:
τabs/ext= H Z
0
kabs′ /ext(h) cabs/total(h) dh=
Kabs′ /ext H Z
0
cabs/total(h) dh=Kabs′ /extCabs/total, (6)
whereCabs/total is the Fe, BC or total mass of the aerosol particles in the entire atmospheric column. Correspondingly, we can write:
τFe/BC τext =
KFe′ /BC Kext′
CFe/BC
Ctotal . (7)
Making an additional assumption that the Fe and BC per-centage of the total particulate mass is constant with altitude, i.e.
cFe(h) ctotal(h)
=const(Fe%)and cBC(h) ctotal(h)
=const(BC%) , (8) we can rewrite Eq. (7) as follows:
τFe/BC τext =
KFe′ /BC Kext′
cFe/BC(h)
ctotal(h) . (9)
Using this, the relationships in Eq. (4) can be expressed via specific aerosol absorption and extinction characteristics, and mass concentrations known at any atmospheric altitude, for example as:
ω440−ω1020 ω1020
=
KBC′440 Kext′440
· cBC(h0) ctotal(h0) · 0.43
˚aBC−˚a−1−K
′440
Fe Kext′440
· cFe(h0) ctotal(h0)
1−K
′440
BC Kext′440 ·
cBC(h0) ctotal(h0)·0.43
˚aBC−˚a
, (10)
see also Alfaro et al. (2004). Here cFe(h0), cBC(h0) and ctotal(h0)are the concentrations of the Fe, BC and total par-ticulate mass at the near surface layer.
Thus, Eq. (10) allowed us to use the ratios of cFe(h0) ctotal(h0) and cBC(h0)
ctotal(h0) corresponding to the fractions of Fe and BC in the total particulate mass sampled at the surface level. The specific extinction Kext′440 can be estimated as Kext′440=τext440·Ctotal−1, where τext440 is directly measured by
AERONET sun-photometers, andCtotal is the total column aerosol concentration. The total column aerosol volume con-centration (CVtotal)(calculated as aerosol particles volume in the entire atmospheric column with a unit cross-section area) is a product of the AERONET inversion. The volume concentration can be converted to the mass concentration as Ctotal=CVtotal·ρtotal, whereρtotalis aerosol particles density. Then Eq. (10) can be rewritten as follows:
ω440−ω1020 ω1020
=
K′BC440CVtotalρtotal
τext440
·BC%· 0.43˚aBC−˚a−1
−K
′440
Fe CVtotalρtotal
τext440
·Fe%
1−K
′440
BCCVtotalρtotal
τext440
·BC%·0.43˚aBC−˚a
(11)
The values of ˚aBCandρtotal can be selected from values presented in the literature. Thus, all parameters in Eq. (11), except for KBC′440 and KFe′440, are the known characteristics or are provided from available measurements. Correspond-ingly, if we assume that the absorption properties of BC and Fe (expressed viaKBC′440andKFe′440)do not change for obser-vations at the given site with its constant sources, then we can use Eq. (11) in a multivariate regression analysis for the estimation ofKBC′440 andKFe′440. Specifically, one can fit the measurements of spectral SSA using Eq. (11) as a physical model with unknown coefficientsKBC′440andKFe′440. The cor-rectly fitted values ofKBC′440 andKFe′440should reproduce the variability of SSA observed in a redundant measurement set (the number of measured SSA≫2). Once the coefficients KBC′440 andKFe′440 are derived, they can be used for estimat-ing Fe% and BC% from measured SSA,τext440, ˚a andCVtotal in each single aerosol event. With that purpose one can use the following transformations of Eq. (11). The equation for estimation of Fe% can be rewritten as
Fe%= K′440
BC CVtotalρtotal τ440
ext
·BC%·0.43˚aBC−˚a· ω440 ω1020−1
−ω440−ω1020 ω1020
KFe′440CVtotalρtotal τext440
(12)
The expression for estimation of BC% can also be pre-sented as
BC%=
K′Fe440CVtotalρtotal
τext440 ·Fe%+
ω440−ω1020 ω1020
KBC′440CVtotalρtotal τ440
ext
·0.43˚aBC−˚a· ω440 ω1020−1
. (13)
account for the SSA spectral variability caused by changes in size distribution. It is also important to note that BC absorp-tion spectral dependence (included in Eq. (11) via ˚Angstr¨om exponent) can be different for different types of BC. How-ever, we assume that the aerosols observed in the current study contain similar types of BC. Correspondingly, we im-plemented a series of fits with different values of ˚aBC and have chosen the one value ( ˚aBC=0.8)that yielded the high-est fitted correlation coefficient. Although it differs from the commonly used value of one, it is still in the range of possi-ble values presented in the literature, e.g., (Kirchstetter et al., 2004). Since, in our case, the bulk material was dust, we uti-lized the density of dust and assumedρtotalof 1 g cm−1e.g., (Cattle et al., 2002). However, the dust density may vary in the range from around 1 to 2 g cm−1, e.g., (Sugimae, 1984; Mamane and Dzubay, 1988; Simonson, 1995; Seinfeld et al., 2004; Menendez et al., 2007).
The performed multivariate regression analysis of Eq. (11) yielded KBC′440=0.037±0.008 and KFe′440=0.013±0.005 (±Standard Error). Note that by using BC and Fe fractions instead of percentages in Eq. (11), the derived specific mass absorptions are: KBC′440=3.7m2g−1, and KFe′440=1.3m2g−1. The regression is significant at p<0.0001, the fitted cor-relation coefficient is 0.74, and the coefficient of multiple determination (r2)is 0.55. This means that Fe, BC,τ440
ext , ˚a andCtotal in this model explain 55% of the variance in the spectral single scattering albedo. The rest of the variance may be explained by the following facts: (i) Fe is not directly related to the optically relevant iron oxide (Lafon et al., 2004), (ii) other components of mineral dust may contribute to dust absorption (Jacobson, 2001), (iii) spectral absorption of pollution cannot be completely explained by measured BC, (Bond, 2001; Kirchstetter et al., 2004), and (iv) measurement uncertainties.
For the purposes of comparison, theKBC′440andKFe′440were also estimated using Mie theory calculations. For instance, the specific mass absorptions, calculated by Mie theory, were 4.7 m2g−1for BC and 1.3 m−2g for Fe. The refractive index at 440 nm used in the Mie calculations for BC wasm=1.76– 0.45i(Shettle and Fenn, 1979), and for Fe it wasm=3–0.2i (Jennings, 1993). Here, we also used a ρBC=2.26 g cm−1 (Hess and Herd, 1993) and a ρFe=5.24 g cm−1 (Sugimae, 1984) for converting volume to mass concentrations. Thus, theKBC′440andKFe′440derived by the regression equation and by the Mie calculations were in agreement. The obtained values also remained comparable and of the same order of magnitude as when we varied the assumed refractive indices and aerosol densities over a possible range. Therefore, con-sidering all the assumptions, the agreement obtained is en-couraging.
A drawback of the above model is that this approach re-quires information on BC in order to derive the Fe concen-tration, and vice-versa. However, for example, a recent study on inversion of AERONET retrievals into BC concentrations (Schuster et al., 2005; Dey et al., 2006) can be employed for
completing this information. Thus AERONET retrievals can be utilized for deriving both, BC and Fe concentrations. 4.6 Evaluation of the derived relationship
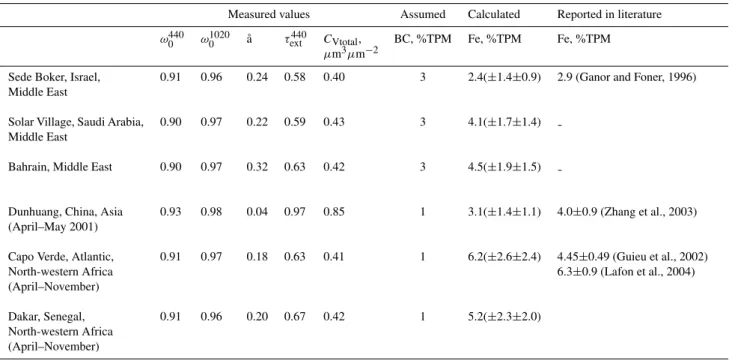
In order to evaluate our attempt to assess the Fe concentra-tion, we utilized AERONET retrievals from several locations (Table 1). For some of these locations the Fe concentra-tions had been reported in the literature and were available for comparison. Specifically, we used an average of all avail-able data from several years from the following sites: Sede Boker, Israel; Solar Village, Saudi Arabia; and Bahrain, Per-sian Gulf. For the Dunhuang site in China, average val-ues observed during the ACE-Asia field campaign (April– May 2001) were used. For the Capo Verde and Dakar sites in North-western Africa, average values for about ten years of observations, during the dust-dominated season of April– November, were used. An accumulated error was estimated in order to assess the uncertainty in the calculated Fe per-centage. This error is caused by uncertainty in the variables (BC, ˚a, SSA,τext440, andCtot)and uncertainty of the derived relationship (i.e., errors of the regression coefficients). Since measured concentrations of BC were not available, they were assumed to be 3±0.3% for the Middle East region (based on existing data for the Sede Boker site), and 1±0.1% for lo-cations and periods where strong contamination was not ex-pected. The error for ˚awas estimated as 0.1. The error of the SSA was assumed to be 0.03, which is the reported error of the SSA values (Dubovik et al., 2002a). However, for events with high aerosol optical thickness, the SSA accuracy can in-crease up to 0.01. The reported error ofτext440measurements by AERONET is 0.01. The error of Ctot was estimated as being 5%.
Table 1. Reported in literature and calculated percentage of Fe in total particulate mass (TPM) for several locations with dust-dominated conditions, and corresponding measured spectral single-scattering albedo (ω0), ˚Angstr¨om exponent (aa), aerosol optical thickness (τext), and
column volume concentration (CVtotal). Calculated Fe is for an assumed BC percentage and accompanied by an error assessed for the SSA accuracy of±0.03 and±0.01, respectively.
Measured values Assumed Calculated Reported in literature
ω0440 ω10200 ˚a τext440 CVtotal,
µm3µm−2
BC, %TPM Fe, %TPM Fe, %TPM
Sede Boker, Israel, Middle East
0.91 0.96 0.24 0.58 0.40 3 2.4(±1.4±0.9) 2.9 (Ganor and Foner, 1996)
Solar Village, Saudi Arabia, Middle East
0.90 0.97 0.22 0.59 0.43 3 4.1(±1.7±1.4)
Bahrain, Middle East 0.90 0.97 0.32 0.63 0.42 3 4.5(±1.9±1.5)
Dunhuang, China, Asia (April–May 2001)
0.93 0.98 0.04 0.97 0.85 1 3.1(±1.4±1.1) 4.0±0.9 (Zhang et al., 2003)
Capo Verde, Atlantic, North-western Africa (April–November)
0.91 0.97 0.18 0.63 0.41 1 6.2(±2.6±2.4) 4.45±0.49 (Guieu et al., 2002) 6.3±0.9 (Lafon et al., 2004)
Dakar, Senegal, North-western Africa (April–November)
0.91 0.96 0.20 0.67 0.42 1 5.2(±2.3±2.0)
characterizing Saharan dust. However, it is lower than the reported 7.8±0.4% in the Sahelian zone (Lafon et al., 2004). In summary, the calculated percentages of Fe and those re-ported in the literature appear comparable. Considering the agreement between the calculated results and the results re-ported in the literature, one may also expect improvement of modeling accuracy by the presented approach with increas-ing number and quality of observations.
One additional aspect should be discussed here for the proper interpretation of the results obtained. That is, how representative is the total iron concentration for the iron ox-ide content of the aerosol? Iron oxox-ide is present as a major aerosol component affecting the short-wavelength absorption of mineral dust. However, iron oxide represents only part of the total iron, which may also exist in the crystal lattice of numerous other desert minerals. The iron oxide-to-total iron ratio in natural and soil-derived aerosols was character-ized by (Lafon et al., 2004; 2006). They reported consider-able variability in the iron oxide-to-total iron ratio for var-ious regions and sampling conditions. Lafon et al. (2006), however, conclude that there is no clear relationship between the oxide-to-total iron ratio and dust origin or aging; though, both effects probably play a role, and additional studies are required. Based on all the values for the oxide-to-total iron ratio reported in (Lafon et al., 2004; 2006) we calculated an average of 0.54 (±0.10) (±Std. Dev.). This variability can be reduced by removing the largest outliers, therefore a
vari-ability of that level or lower may be expected for the ratio at a regional scale. Thus, given the present lack of knowl-edge, we concluded that a fixed oxide-to-total iron ratio is an acceptable assumption for the conducted analysis of the regional aerosol observations.
5 Summary and conclusions
The importance of the radiative and biogeochemical impact of iron on the climate system requires the estimation of the iron distribution, especially in regions of the globe that are strongly affected by mineral dust. The observed mixtures of dust and pollution aerosols over the Negev desert of Is-rael enabled the characterization of the relationship between spectral absorption and chemical composition. We have pre-sented the response of remotely sensed aerosol spectral ab-sorption to varying iron concentrations, and suggested an approach for the estimation of the iron content of the dust aerosol. The following is a summary of specific conclusions inferred in this study.
ring and open soot clusters, both externally-mixed and attached to dust particles.
2. The difference SSA(440)–SSA(1020), which indicates SSA spectral behavior, showed a trend from negative (stronger absorption in 440 nm) to positive (stronger ab-sorption in 1020 nm) values as the total iron concentra-tion decreased and the role of BC increased.
3. While the suggested approach should be validated under different conditions in order to assure the consistency of the method, the presented results are encouraging and support the validity of the approach. The accuracy of the presented method can be improved with higher quality and increased number of observations.
An advantage of the derived relationship is the use of actual ambient aerosol measurements, namely, the retrieved spec-tral absorption from the total column, and in-situ Fe and BC concentrations. Such an approach does not involve modeling of aerosol composition and optical characteristics. The ap-proach suggested here may be employed for the estimation of the iron concentration in mineral dust, and further may enable quantification of the iron distribution and deposition during dust storm events.
Acknowledgements. The authors thank all members of the AERONET group, led by Brent N. Holben, for data processing and operation of the AERONET sites. In addition we thank the principle investigators Didier Tanr´e, Naif Al-Abbadi, and their staff for establishing and maintaining Capo Verde, Dakar and Solar Village sites used in this investigation. The filter analysis was supported by the Belgian Federal Science Policy Office. The authors are thankful to Joachim Huth from the Max Planck Institute for Chemistry, Mainz, Germany, for the SEM images. Also, we appreciate thoughtful and constructive comments made by reviewers G. Schuster, P. Fialho and J. Barnard, which contributed to significant improvement of the paper.
Edited by: R. Volkamer
References
Alfaro, S. C., Lafon, S., Rajot, J. L., Formenti, P., Gaudichet, A., and Maille, M.: Iron oxides and light absorption by pure desert dust: An experimental study, J. Geophys. Res., 109, D08208, doi:10.1029/2003JD004374, 2004.
Alpert, P., Kishcha, P., Shtivelman, A., Krichak, S. O., and Joseph, J. H.: Vertical distribution of Saharan dust based on 2.5-year model predictions, Atmos. Res., 70, 109–130, 2004.
Andreae, M. O. and Gelencser, A.: Black carbon or brown car-bon? The nature of light-absorbing carbonaceous aerosols, At-mos. Chem. Phys., 6, 3131–3148, 2006,
http://www.atmos-chem-phys.net/6/3131/2006/.
Andreae, T. W., Andreae, M. O., Ichoku, C., Maenhaut, W., Cafmeyer, J., Karnieli, A., and Orlovsky, L.: Light scat-tering by dust and anthropogenic aerosol at a remote site in the Negev desert, Israel, J. Geophys. Res., 107, 4008, doi:4010.1029/2001JD900252, 2002.
Angstrom, A.: On the atmospheric transmission of sun radiation and on dust in the air, Geogr. Ann., 11, 156–166, 1929. Behrenfeld, M. J., Bale, A. J., Kolber, Z. S., Aiken, J., and
Falkowski, P. G.: Confirmation of iron limitation of phytoplank-ton photosynthesis in the equatorial pacific ocean, Nature, 383, 508–511, 1996.
Bond, T. C.: Spectral dependence of visible light absorption by carbonaceous particles emitted from coal combustion, Geophys. Res. Lett., 28, 4075–4078, 2001.
Bond, T. C., Streets, D. G., Yarber, K. F., Nelson, S. M., Woo, J. H., and Klimont, Z.: A technology-based global inventory of black and organic carbon emissions from combustion, J. Geo-phys. Res., 109, D14203, doi:10.1029/2003JD003697, 2004. Bond, T. C. and Bergstrom, R. W.: Light absorption by
carbona-ceous particles: An investigative review, Aerosol Science and Technology, 40, 27–67, 2006.
Boyd, P. W., Watson, A. J., Law, C. S., Abraham, E. R., Trull, T., Murdoch, R., Bakker, D. C. E., Bowie, A. R., Buesseler, K. O., Chang, H., Charette, M., Croot, P., Downing, K., Frew, R., Gall, M., Hadfield, M., Hall, J., Harvey, M., Jameson, G., LaRoche, J., Liddicoat, M., Ling, R., Maldonado, M. T., McKay, R. M., Nodder, S., Pickmere, S., Pridmore, R., Rintoul, S., Safi, K., Sutton, P., Strzepek, R., Tanneberger, K., Turner, S., Waite, A., and Zeldis, J.: A mesoscale phytoplankton bloom in the polar southern ocean stimulated by iron fertilization, Nature, 407, 695– 702, 2000.
Broecker, W. S. and Henderson, G. M.: The sequence of events surrounding Termination II and their implications for the cause of glacial-interglacial CO2changes, Paleoceanography, 13, 352– 364, 1998.
Capone, D. G., Zehr, J. P., Paerl, H. W., Bergman, B., and Carpenter, E. J.: Trichodesmium, a globally significant marine cyanobac-terium, Science, 276, 1221–1229, 1997.
Cattle, S. R., McTainsh, G. H., and Wagner, S.: Ae olian dust con-tributions to soil of the Namoi Valley, Northern NSW, Australia, Catena, 47, 245–264, 2002.
Chung, S. H. and Seinfeld, J. H.: Climate response of direct ra-diative forcing of anthropogenic black carbon, J. Geophys. Res., 110, D11102, doi:10.1029/2004JD005441, 2005.
Coale, K. H., Johnson, K. S., Fitzwater, S. E., Gordon, R. M., Tanner, S., Chavez, F. P., Ferioli, L., Sakamoto, C., Rogers, P., Millero, F., Steinberg, P., Nightingale, P., Cooper, D., Cochlan, W. P., Landry, M. R., Constantinou, J., Rollwagen, G., Trasvina, A., and Kudela, R.: A massive phytoplankton bloom induced by an ecosystem-scale iron fertilization experiment in the equatorial Pacific Ocean, Nature, 383, 495–501, 1996.
Colarco, P. R., Toon, O. B., Reid, J. S., Livingston, J. M., Rus-sell, P. B., Redemann, J., Schmid, B., Maring, H. B., Savoie, D., Welton, E. J., Campbell, J. R., Holben, B. N., and Levy, R.: Saharan dust transport to the Caribbean during PRIDE: 2. Trans-port, vertical profiles, and deposition in simulations of in situ and remote sensing observations, J. Geophys. Res., 108(D19), 8589, doi:10.1029/2002JD002658, 2003.
black carbon and specific absorption over Kanpur City, Northern India during 2001-2003 using aeronet data, Atmos. Environ., 40, 445–456, 2006.
di Sarra, A., Di Iorio, T., Cacciani, M., Fiocco, G., and Fua, D.: Sa-haran dust profiles measured by lidar at Lampedusa, J. Geophys. Res., 106, 10 335–10 347, 2001.
Dubovik, O., Holben, B. N., Kaufman, Y. J., Yamasoe, M., Smirnov, A., Tanre, D., and Slutsker, I.: Single-scattering albedo of smoke retrieved from the sky radiance and solar transmittance measured from ground, J. Geophys. Res., 103, 31 903–31 923, 1998. Dubovik, O. and King, M. D.: A flexible inversion algorithm for
retrieval of aerosol optical properties from sun and sky radiance measurements, J. Geophys. Res., 105, 20 673-20 696, 2000. Dubovik, O., Smirnov, A., Holben, B. N., King, M. D.,
Kauf-man, Y. J., Eck, T. F., and Slutsker, I.: Accuracy assessments of aerosol optical properties retrieved from Aerosol Robotic Net-work (AERONET) sun and sky radiance measurements, J. Geo-phys. Res., 105, 9791–9806, 2000.
Dubovik, O., Holben, B., Eck, T. F., Smirnov, A., Kaufman, Y. J., King, M. D., Tanre, D., and Slutsker, I.: Variability of absorption and optical properties of key aerosol types observed in world-wide locations, J. Atmos. Sci., 59, 590–608, 2002a.
Dubovik, O., Holben, B. N., Lapyonok, T., Sinyuk, A., Mishchenko, M. I., Yang, P., and Slutsker, I.: Non-spherical aerosol retrieval method employing light scattering by spheroids, Geophys. Res. Lett., 29, 1415, doi:10.1029/2001GL014506, 2002b.
Dubovik, O., Sinyuk, A., Lapyonok, T., Holben, B. N., Mishchenko, M., Yang, P., Eck, T. F., Volten, H., Munoz, O., Veihelmann, B., van der Zande, W. J., Leon, J. F., Sorokin, M., and Slutsker, I.: Application of spheroid mod-els to account for aerosol particle nonsphericity in remote sens-ing of desert dust, J. Geophys. Res.-Atmos., 111, D11208, doi:10.1029/2005JD006619, 2006.
Dulac, F. and Chazette, P.: Airborne study of a multi-layer aerosol structure in the eastern Mediterranean observed with the airborne polarized lidar ALEX during a STAAARTE campaign (7 June 1997), Atmos. Chem. Phys., 3, 1817–1831, 2003,
http://www.atmos-chem-phys.net/3/1817/2003/.
Eck, T. F., Holben, B. N., Reid, J. S., Dubovik, O., Smirnov, A., O’Neill, N. T., Slutsker, I., and Kinne, S.: Wavelength depen-dence of the optical depth of biomass burning, urban, and desert dust aerosols, J. Geophys. Res.-Atmos., 104, 31 333–31 349, 1999.
Falkowski, P. G.: Evolution of the nitrogen cycle and its influence on the biological sequestration of CO2in the ocean, Nature, 387, 272–275, 1997.
Fan, S. M., Moxim, W. J., and Levy, H.: Aeolian input of bioavailable iron to the ocean, Geophys. Res. Lett., 33, L07602, doi:10.1029/2005GL024852, 2006.
Fialho, P., Hansen, A. D. A., and Honrath, R. E.: Absorption coef-ficients by aerosols in remote areas: A new approach to decou-ple dust and black carbon absorption coefficients using seven-wavelength aethalometer data, J. Aerosol Sci., 36, 267–282, 2005.
Fialho, P., Freitas, M. C., Barata, F., Vieira, B., Hansen, A. D. A., and Honrath, R. E.: The aethalometer calibration and determi-nation of iron concentration in dust aerosols, J. Aerosol Sci., 37, 1497–1506, 2006.
Formenti, P., Andreae, M. O., Andreae, T. W., Galani, E., Vasaras, A., Zerefos, C., Amiridis, V., Orlovsky, L., Karnieli, A., Wendisch, M., Wex, H., Holben, B. N., Maenhaut, W., and Lelieveld, J.: Aerosol optical properties and large-scale trans-port of air masses: Observations at a coastal and a semiarid site in the eastern Mediterranean during summer 1998, J. Geophys. Res., 106, 9807–9826, 2001.
Formenti, P., Boucher, O., Reiner, T., Sprung, D., Andreae, M. O., Wendisch, M., Wex, H., Kindred, D., Tzortziou, M., Vasaras, A., and Zerefos, C.: STAAARTE-MED 1998 summer airborne mea-surements over the Aegean Sea - 2. Aerosol scattering and ab-sorption, and radiative calculations, J. Geophys. Res., 107(D21), 4451, doi:10.1029/2001JD001536, 2002a.
Formenti, P., Reiner, T., Sprung, D., Andreae, M. O., Wendisch, M., Wex, H., Kindred, D., Dewey, K., Kent, J., Tzortziou, M., Vasaras, A., and Zerefos, C.: STAAARTE-MED 1998 sum-mer airborne measurements over the Aegean Sea – 1. Aerosol particles and trace gases, J. Geophys. Res., 107(D21), 4450, doi:10.1029/2001JD001337, 2002b.
Fung, I. Y., Meyn, S. K., Tegen, I., Doney, S. C., John, J. G., and Bishop, J. K. B.: Iron supply and demand in the upper ocean, Global Biogeochem. Cy., 14, 281–295, 2000.
Ganor, E., and Foner, H. A.: The mineralogical and chemical prop-erties and the behaviour of aeolian Saharan dust over Israel, in: The impact of desert dust across the Mediterranean, edited by: Guerzoni, S., and Chester, R., Kluwer Academic Publishers, Printed in the Netherlands, 163–172, 1996.
Gao, Y., Kaufman, Y. J., Tanre, D., Kolber, D., and Falkowski, P. G.: Seasonal distributions of aeolian iron fluxes to the global ocean, Geophys. Res. Lett., 28, 29–32, 2001.
Gao, Y., Fan, S. M., and Sarmiento, J. L.: Aeolian iron input to the ocean through precipitation scavenging: A modeling perspec-tive and its implication for natural iron fertilization in the ocean, J. Geophys. Res., 108(D7), 4221 doi:10.1029/2002JD002420, 2003.
Gerasopoulos, E., Andreae, M. O., Zerefos, C. S., Andreae, T. W., Balis, D., Formenti, P., Merlet, P., Amiridis, V., and Papaste-fanou, C.: Climatological aspects of aerosol optical properties in Northern Greece, Atmos. Chem. Phys., 3, 2025–2041, 2003, http://www.atmos-chem-phys.net/3/2025/2003/.
Guieu, C., Loye-Pilot, M. D., Ridame, C., and Thomas, C.: Chem-ical characterization of the Saharan dust end-member: Some biogeochemical implications for the western Mediterranean Sea, J. Geophys. Res., 107(D15), 4258, doi:10.1029/2001JD000582, 2002.
Hamonou, E., Chazette, P., Balis, D., Dulac, F., Schneider, X., Galani, E., Ancellet, G., and Papayannis, A.: Characterization of the vertical structure of Saharan dust export to the Mediterranean basin, J. Geophys. Res., 104, 22 257–22 270, 1999.
Hansen, A. D. A., Rosen, H., and Novakov, T.: The aethalome-ter – an instrument for the real-time measurement of optical-absorption by aerosol-particles, Sci. Total Environ., 36, 191–196, 1984.
Hess, W. H. and Herd, C. R.: Microstructure, morphology, and gen-eral physical properties, in carbon black, in, edited by: Donnet, J., Bansal, R., and Wang, M., CRC Press, Boca Raton, Fla., 89– 173, 1993.
Naka-jima, T.: AERONET – A federated instrument network and data archive for aerosol characterization, Remote Sensing of Environ-ment, 66, 1–16, 1998.
Ichoku, C., Andreae, M. O., Andreae, T. W., Meixner, F. X., Schebeske, G., Formenti, P., Maenhaut, W., Cafmeyer, J., Ptasin-ski, J., Karnieli, A., and Orlovsky, L.: Interrelationships between aerosol characteristics and light scattering during late winter in an Eastern Mediterranean arid environment, J. Geophys. Res., 104, 24 371–24 393, 1999.
Israelevich, P. L., Ganor, E., Levin, Z., and Joseph, J. H.: Annual variations of physical properties of desert dust over Israel, J. Geophys. Res.-Atmos., 108(D13), 4318, doi:10.1029/2002JD003163, 2003.
Jacobson, M. Z.: Global direct radiative forcing due to multicompo-nent anthropogenic and natural aerosols, J. Geophys. Res., 106, 1551–1568, 2001.
Jacobson, M. Z.: Climate response of fossil fuel and bio-fuel soot, accounting for soot’s feedback to snow and sea ice albedo and emissivity, J. Geophys. Res., 109, D21201, doi:10.1029/2004JD004945, 2004.
Jennings, S. G.: Aerosol effects on climate, University of Arizona Press, Tucson, 304 pp., 1993.
Jickells, T. D., An, Z. S., Andersen, K. K., Baker, A. R., Berga-metti, G., Brooks, N., Cao, J. J., Boyd, P. W., Duce, R. A., Hunter, K. A., Kawahata, H., Kubilay, N., laRoche, J., Liss, P. S., Mahowald, N., Prospero, J. M., Ridgwell, A. J., Tegen, I., and Torres, R.: Global iron connections between desert dust, ocean biogeochemistry, and climate, Science, 308, 67–71, 2005. Johnson, K. S., Elrod, V. A., Fitzwater, S. E., Plant, J. N., Chavez,
F. P., Tanner, S. J., Gordon, R. M., Westphal, D. L., Perry, K. D., Wu, J. F., and Karl, D. M.: Surface ocean-lower atmosphere interactions in the Northeast Pacific Ocean Gyre: Aerosols, iron, and the ecosystem response, Global Biogeochemical Cycles, 17, 1063, doi:10.1029/2002GB002004, 2003.
Kaufman, Y. J., Boucher, O., Tanre, D., Chin, M., Remer, L. A., and Takemura, T.: Aerosol anthropogenic component es-timated from satellite data, Geophys. Res. Lett., 32, L17804, doi:10.1029/2005GL023125, 2005a.
Kaufman, Y. J., Koren, I., Remer, L. A., Tanre, D., Ginoux, P., and Fan, S.: Dust transport and deposition observed from the Terra-Moderate Resolution Imaging Spectroradiometer (MODIS) spacecraft over the Atlantic ocean, J. Geophys. Res., 110, D10S12, doi:10.1029/2003JD004436, 2005b.
Kirchstetter, T. W., Novakov, T., and Hobbs, P. V.: Evidence that the spectral dependence of light absorption by aerosols is affected by organic carbon, J. Geophys. Res., 109, D21208, doi:10.1029/2004JD004999, 2004.
Koven, C. D. and Fung, I.: Inferring dust composition from wavelength-dependent absorption in Aerosol Robotic Net-work (AERONET) data, J. Geophys. Res., 111, D14205, doi:10.1029/2005JD006678, 2006.
Kubilay, N., Cokacar, T., and Oguz, T.: Optical properties of min-eral dust outbreaks over the northeastern Mediterranean, J. Geo-phys. Res., 108(D21), 4666, doi:10.1029/2003JD003798, 2003. Lafon, S., Rajot, J. L., Alfaro, S. C., and Gaudichet, A.:
Quan-tification of iron oxides in desert aerosol, Atmos. Environ., 38, 1211–1218, 2004.
Lafon, S., Sokolik, I. N., Rajot, J. L., Caquineau, S., and Gaudichet, A.: Characterization of iron oxides in mineral dust aerosols:
Im-plications for light absorption, J. Geophys. Res., 111, D21207, doi:10.1029/2005JD007016, 2006.
Maenhaut, W., Salma, I., Cafmeyer, J., Annegarn, H. J., and An-dreae, M. O.: Regional atmospheric aerosol composition and sources in the eastern Transvaal, South Africa, and impact of biomass burning, J. Geophys. Res., 101, 23 631–23 650, 1996a. Maenhaut, W., Salomonovic, R., Cafmeyer, J., Ichoku, C., Karnieli,
A., and Andreae, M. O.: Anthropogenic and natural radiatively active aerosol types at Sede Boker, Israel, J. Aerosol Sci., 27, S47–S48, 1996b.
Maenhaut, W., Cafmeyer, J., Ptasinski, J., Andreae, M. O., Andreae, T. W., Elbert, W., Meixner, F. X., Karnieli, A., and Ichoku, C.: Chemical composition and light scattering of the atmospheric aerosol at a remote site in the Negev desert, Israel, J. Aerosol Sci., 28, S73–S74, 1997.
Mahowald, N. M., Baker, A. R., Bergametti, G., Brooks, N., Duce, R. A., Jickells, T. D., Kubilay, N., Prospero, J. M., and Tegen, I.: Atmospheric global dust cycle and iron inputs to the ocean, Glob. Biogeochem. Cy., 19, GB4025, doi:10.1029/2004GB002402, 2005.
Mamane, Y. and Dzubay, T. G.: Fly-ash concentrations in philadel-phia aerosol determined by electron-microscopy, Water Air and Soil Pollution, 37, 389–405, 1988.
Martin, J. H. and Gordon, R. M.: Northeast pacific iron distributions in relation to phytoplankton productivity, Deep-Sea Research Part a-Oceanographic Research Papers, 35, 177–196, 1988. Menendez, I., Diaz-Hernandez, J. L., Mangas, J., Alonso, I., and
Sanchez-Soto, P. J.: Airborne dust accumulation and soil devel-opment in the North-East sector of Gran Canaria (Canary Islands, Spain), Journal of Arid Environments, 71, 57–81, 2007. Mishchenko, M. I., Travis, L. D., Kahn, R. A., and West, R. A.:
Modeling phase functions for dustlike tropospheric aerosols us-ing a shape mixture of randomly oriented polydisperse spheroids, J. Geophys. Res., 102, 16 831–16 847, 1997.
Mongin, M., Nelson, D. M., Pondaven, P., and Treguer, P.: Simula-tion of upper-ocean biogeochemistry with a flexible-composiSimula-tion phytoplankton model: C, N and Si cycling and Fe limitation in the southern ocean, Deep-Sea Research Part Ii-Topical Studies in Oceanography, 53, 601–619, 2006.
O’Neill, N. T., Dubovik, O., and Eck, T. F.: Modified Angstrom ex-ponent for the characterization of submicrometer aerosols, Appl. Opt., 40, 2368–2375, 2001.
Schkolnik, G., Chand, D., Hoffer, A., Andreae, M. O., Erlick, C., Swietlicki, E., and Rudich, Y.: Constraining the density and com-plex refractive index of elemental and organic carbon in biomass burning aerosol using optical and chemical measurements, At-mos. Environ., 41, 1107–1118, 2007.
Schuster, G. L., Dubovik, O., Holben, B. N., and Clothiaux, E. E.: Inferring black carbon content and specific absorption from Aerosol Robotic Network (AERONET) aerosol retrievals, J. Geophys. Res., 110, D10S17, doi:10.1029/2004JD004548, 2005.
Schuster, G. L., Dubovik, O., and Holben, B. N.: Angstrom ex-ponent and bimodal aerosol size distributions, J. Geophys. Res., 111, D07207, doi:10.1029/2005JD006328, 2006.
Shi-nozuka, Y., Song, C. H., Tang, Y. H., Uno, I., Vogelmann, A. M., Weber, R. J., Woo, J. H., and Zhang, X. Y.: ACE-ASIA – Re-gional climatic and atmospheric chemical effects of Asian dust and pollution, Bulletin of the American Meteorological Society, 85, 367–380, 2004.
Shettle, E. P., and Fenn, R. W.: Models of aerosols of lower tropo-sphere and the effect of humidity variations on their optical prop-erties, Air Force Cambrige Lab., Hambscom, Air Force Base, Mass., 1979.
Simonson, R. W.: Airborne dust and its significance to soils, Geo-derma, 65, 1–43, 1995.
Sinyuk, A., Dubovik, O., Holben, B., Eck, T. F., Breon, F. M., Martonchik, J., Kahn, R., Diner, D. J., Vermote, E. F., Roger, J. C., Lapyonok, T., and Slutsker, I.: Simultaneous retrieval of aerosol and surface properties from a combination of AERONET and satellite data, Remote Sensing of Environment, 107, 90–108, 2007.
Smirnov, A., Holben, B. N., Eck, T. F., Dubovik, O., and Slutsker, I.: Cloud-screening and quality control algorithms for the AERONET database, Remote Sensing of Environment, 73, 337– 349, 2000.
Sokolik, I. N. and Toon, O. B.: Incorporation of mineralogical com-position into models of the radiative properties of mineral aerosol from UV to IR wavelengths, J. Geophys. Res., 104, 9423–9444, 1999.
Stern, E., Gradus, Y., Meir, A., Krakover, S., and Tsoar, H.: Atlas of the Negev, Keterpress Enterprises, Jerusalem, 1986.
Streets, D. G., Bond, T. C., Lee, T., and Jang, C.: On the future of carbonaceous aerosol emissions, J. Geophys. Res., 109, D24212, doi:10.1029/2004JD004902, 2004.
Sugimae, A.: Elemental constituents of atmospheric particulates and particle density, Nature, 307, 145–147, 1984.
Tsidulko, M., Krichak, S. O., Alpert, P., Kakaliagou, O., Kallos, G., and Papadopoulos, A.: Numerical study of a very intensive east-ern Mediterranean dust storm, 13–16 March 1998, J. Geophys. Res., 107(D21), 4581, doi:10.1029/2001JD001168, 2002. Watson, A. J., Bakker, D. C. E., Ridgwell, A. J., Boyd, P. W., and
Law, C. S.: Effect of iron supply on southern ocean CO2uptake and implications for glacial atmospheric CO2, Nature, 407, 730– 733, 2000.
Wiggert, J. D., Murtugudde, R. G., and Christian, J. R.: Annual ecosystem variability in the tropical Indian Ocean: Results of a coupled bio-physical ocean general circulation model, Deep-Sea Research Part Ii-Topical Studies in Oceanography, 53, 644–676, 2006.