Escher: A Web Application for Building,
Sharing, and Embedding Data-Rich
Visualizations of Biological Pathways
Zachary A. King1, Andreas Dräger1,2, Ali Ebrahim1, Nikolaus Sonnenschein3, Nathan E. Lewis4, Bernhard O. Palsson1,4*
1Department of Bioengineering, University of California, San Diego, La Jolla, California, United States of America, USA,2Center for Bioinformatics Tuebingen (ZBIT), University of Tuebingen, Tübingen, Germany, 3Novo Nordisk Foundation Center for Biosustainability, Technical University of Denmark, Lyngby, Denmark, 4Department of Pediatrics, University of California, San Diego, La Jolla, California, United States of America
*palsson@ucsd.edu
Abstract
Escher is a web application for visualizing data on biological pathways. Three key features make Escher a uniquely effective tool for pathway visualization. First, users can rapidly design new pathway maps. Escher provides pathway suggestions based on user data and genome-scale models, so users can draw pathways in a semi-automated way. Second, users can visualize data related to genes or proteins on the associated reactions and path-ways, using rules that define which enzymes catalyze each reaction. Thus, users can iden-tify trends in common genomic data types (e.g. RNA-Seq, proteomics, ChIP)—in
conjunction with metabolite- and reaction-oriented data types (e.g. metabolomics, fluxo-mics). Third, Escher harnesses the strengths of web technologies (SVG, D3, developer tools) so that visualizations can be rapidly adapted, extended, shared, and embedded. This paper provides examples of each of these features and explains how the development approach used for Escher can be used to guide the development of future visualization tools.
Author Summary
We are now in the age of big data. More than ever before, biological discoveries require powerful and flexible tools for managing large datasets, including both visual and statisti-cal tools. Pathway-based visualization is particularly powerful since it enables one to ana-lyze complex datasets within the context of actual biological processes and to elucidate how each change in a cell effects related processes. To facilitate such approaches, we pres-ent Escher, a web application that can be used to rapidly build pathway maps. On Escher maps, diverse datasets related to genes, reactions, and metabolites can be quickly contextu-alized within metabolism and, increasingly, beyond metabolism. Escher is available now for free use (under the MIT license) athttps://escher.github.io.
OPEN ACCESS
Citation:King ZA, Dräger A, Ebrahim A, Sonnenschein N, Lewis NE, Palsson BO (2015) Escher: A Web Application for Building, Sharing, and Embedding Data-Rich Visualizations of Biological Pathways. PLoS Comput Biol 11(8): e1004321. doi:10.1371/journal.pcbi.1004321
Editor:Paul P Gardner, University of Canterbury, NEW ZEALAND
Received:March 18, 2015
Accepted:May 5, 2015
Published:August 27, 2015
Copyright:© 2015 King et al. This is an open access article distributed under the terms of theCreative Commons Attribution License, which permits unrestricted use, distribution, and reproduction in any medium, provided the original author and source are credited.
Data Availability Statement:All relevant data are within the paper and its Supporting Information files.
This is aPLOS Computational BiologySoftware Article.
Introduction
The behavior of an organism emerges from the complex interactions between genes, proteins, reactions, and metabolites. With next-generation sequencing and various“omics”technologies, it is now possible to rapidly and comprehensively measure these components and interactions. These technologies have transformed the scientific process over the past decade. Data acquisi-tion is substantially easier, but data analysis is increasingly becoming the primary bottleneck to discovery. To address the analysis bottleneck, there has been a demand for data visualization tools to complement statistical and modeling methods.
Biological visualizations often fall into categories characterized by biological scale, and the style of a visualization reflects the type of information at that scale. Three-dimensional objects are often used for representing protein structures [1,2], one-dimensional tracks for genome sequences [3,4], force-directed graphs for interaction networks [5], trees for phylogenetic rela-tionships [6,7]. And, finally, two-dimensionalpathway mapshave long been a popular visual representation of metabolic pathways and other biological pathways. For each type of visualiza-tion, data can be associated with the biological components in the visualization. Visualizing data in this way contextualizes and enriches the dataset for scientists. Data-rich visualizations have been extremely valuable for viewing, interpreting, and communicating data.
A tool for visualizing pathway maps must satisfy a set of core features. The tool must (1) visually represent reactions and pathways clearly and in a way that is biochemically correct, (2) allow users to navigate and search through the visualization, (3) allow users to design and cus-tomize pathway maps, (4) allow users to represent diverse data types within the map using visual cues like size and color, (5) provide import and export features so that maps can be stored, shared, and exported to other tools, and (6) provide an application program interface (API) so the tool can be used within data analysis pipelines.
The existing tools that satisfy these core features are all desktop applications. Briefly, these tools include Omix [8], Cytoscape [5], CellDesigner [9], Vanted [10] with the SBGN-ED add-on [11], VisAnt [12] and PathVisio [13]. Desktop applications have many advantages over web applications, including speed, stability, and integration with the operating system, and these merits have made desktop applications more popular.
The advantages of web applications include rapid deployment (no need to download an application or browser plug-in), greater cross-platform compatibility (e.g. mobile devices), flex-ible sharing, collaborating, and embedding features, as well as easy application development. Recently, a critical mass of performance enhancements and new libraries has made web tools comparable to desktop tools for many applications.
A number of web-based tools exist for visualizing pathway maps: ArrayXPath [14], Pathway Projector [15], iPath2.0 [16], WikiPathways [17], Biographer [18], and the BioCyc pathway viewer [19]. However, none of these satisfy all the core features for a pathway map visualization tool.
One of the key differentiating features of a web application is that modern web browsers come with a built-in software development platform (often called the Developer Tools). This development platform includes a JavaScript shell for directly interacting with the web page runtime and a tool for inspecting and modifying every element in the web page document
Escher: A Web Application for Visualizing Biological Pathways
the Novo Nordisk Foundation provided to the Center for Biosustainability at the Technical University of Denmark (http://www.biosustain.dtu.dk/english) NEL: Novo Nordisk Foundation grant NNF 132150-002 (http://www.novonordiskfonden.dk/en), and a grant from the National Institutes of Health #R21 HD080682 (http://www.nih.gov/) BOP: The Department of Energy under Grant no. DE-SC0008701 (http://www.energy.gov/) The funders had no role in study design, data collection and analysis, decision to publish, or preparation of the manuscript.
object model (DOM). Thus,any user can locally modify any element on the page at any time. If a web application is built on the DOM, then users can rapidly prototype new features and build extensions to the application while it is running. (A comparable feature is the extensibility of the EMACS editor, which can be extended while the editor is running [20]. On the strength of this feature, EMACS has remained popular for 30 years.) To utilize this powerful feature, one must use a visualization library that is based on the DOM, the most popular of which is Data-Driven Documents (D3) [21].
Escher is a web application for visualizing pathway maps, and it is designed to be a fully fea-tured pathway visualization tool that also harnesses all the advantages of the web. Escher has three key features that distinguish it from all existing pathway visualization tools, including the popular desktop applications. First, Escher makes building pathway maps fast and easy, using the information in datasets and genome-scale models to suggest pathways to the user—with this, pathway map design can be semi-automated. Second, Escher connects genes and enzymes to the reactions they catalyze, so that genomic data can be visualized in the context of the reac-tion network. We show how Escher can be used to visualize reacreac-tion data (metabolic fluxes), metabolite data (metabolomics), and genomic data (transcriptomic data), bridging the gap between these data types. Third, Escher uses the advantages of web technologies so that path-way maps can be adapted, extended, shared, and embedded. We illustrate the export and devel-opment features of Escher, including native support for scalable vector graphics (SVG) export, a downloadable tool for converting Escher maps to common standards for representing lay-outs, and application program interfaces (APIs) for developing new applications that extend the functionality of Escher.
Results
Building pathway maps
To build a pathway map, one first needs a source for the names, stoichiometries, and associated genes for each biochemical reaction in an organism. This information is provided by ac on-straint-basedreconstruction andanalysis (COBRA) model, a collection of all the reactions, metabolites, and genes known to exist in an organism (also called a genome-scale model (GEM) or constraint-based model (CBM)) [22]. While COBRA models have generally focused on metabolism, the COBRA modeling approach can be applied to any biochemical reaction network [22], so Escher could be used to visualize pathways like gene expression and mem-brane translocation, which are now being incorporated into COBRA models [23–25].
The Escher interface is centered around a canvas for the pathway map (Fig 1A). In the Escher Builder, a number of editing modes are available in theEditmenu; these include tools for navigating the map (Pan mode), selecting and modifying elements (Select mode), adding reactions (Add reaction mode), rotating the current selection (Rotate mode), and adding and editing text annotations (Text mode).
InAdd reaction mode, a new pathway can be added to the canvas. Clicking on the canvas or an existing metabolite opens the new reaction search box. The search box can find reactions with a number of queries: reaction identifiers (IDs) and display names, metabolite IDs and dis-play names, and gene IDs and names (Fig 1B). (IDs and names are based on those in the COBRA model.) If a reaction or gene dataset is loaded, then Escher provides suggestions of the next reaction to build, sorted by the data value for that reaction (Fig 1B).
Fig 1. The Escher interface.A) The application includes a set of menus with a link to the documentation, a button bar for accessing common features, and a menu for jumping to maps that were built with the same model. B) To build pathway maps, enter theAdd reactionmode using theEditmenu or the button bar. Click on the canvas or an existing metabolite to see a search menu. Reactions can be searched by reaction ID, by metabolite, and by gene. When a gene dataset or reaction dataset is loaded, suggestions appear for the reactions with the largest values in the dataset.
doi:10.1371/journal.pcbi.1004321.g001
any bias toward well known pathways. To add the top suggested reaction, a user can simply press the Enter key. Thus, if a pathway is linear or has high values in a given dataset, then press-ing Enter repeatedly will draw a linear pathway that is based entirely on the information in the data and the COBRA model. This process can be repeated to build perpendicular branches from metabolites in the pathway.
The Escher interface includes a general menu, a menu bar for accessing common functions, a tool for switching between maps, and a canvas containing the interactive pathway map (Fig 1A). TheMapandModelmenus contain import and export functions for maps and COBRA models. TheDatamenu contains the data loading functions, and theViewmenu contains zoom options and access to theSettingspage.
Visualizing data
Three types of data can be visualized on an Escher map: reaction data, metabolite data, and gene data. And Escher supports visualizing a single dataset, or visualizing the comparison of two datasets using a number of comparison functions (log, log2, and difference). TheSettings page includes a detailed set of options for coloring and sizing elements based on statistical fea-tures of a dataset (min, max, quartiles, mean). Here, examples are provided for each data type, and the files required for recreating the visualizations are in the supplementary data.
Reaction data. To demonstrate the visualization of reaction fluxes, anin silicosimulation
of anaerobic growth was performed in theEscherichia coliCOBRA modeliJO1366 using parsi-monious flux balance analysis (pFBA) [26,27]. The Escher map ofiJO1366 central metabolism was loaded (iJO1366.Central Metabolism) and the dataset (S1 Data) was loaded using
theData>Load reaction datafunction. (Datasets can be JavaScript Object Notation (JSON) or
comma separated values (CSV) files, as described in the documentation.) Two settings were changed for this visualization: The absolute value of reaction data was visualized so that negative fluxes appear as large values, and the secondary nodes were hidden to simplify the visualization.
The resulting figure shows reaction fluxes for fermentation pathways (Fig 2A). It was down-loaded as a SVG image with the commandMap>Export as SVG, and the text labels of the
high flux reactions were made larger for the figure.
Metabolite data. Metabolite concentrations are shown from a dataset recently reported by
our research group [28], which were organized in a CSV file with metabolite BiGG IDs as keys (S2 Data). The example figure shows aerobic metabolite concentrations on a modified map of E. colicentral metabolism (S3 Data). To better identify metabolite concentration differences, the metabolite size was changed on theSettingspage, and the secondary metabolites were hidden.
The resulting figure provides a high level view of the most abundant metabolites in the net-work during aerobic growth ofE. coli(Fig 2B). It was downloaded as a SVG image with the commandMap>Export as SVG, and the text annotations were made larger for the figure.
Gene data. To demonstrate the use of gene data on an Escher map, transcript abundances
for aerobic and anaerobic growth ofE. coliwere calculated using RNA-Seq datasets from a recent publication [29]. The datasets were downloaded from the Gene Expression Omnibus (GEO) repository [30] (accession numberGSE48324), and fragments per kilobase of exon per million fragments mapped (FPKMs) were calculated using the Cufflinks functions cuffquant and cuffnorm [31], with appropriate parameters for the library type of the published data. These data were then collected, with locus tags as gene identifiers, in a single CSV file (D4 Data).
Fig 2. Data visualization.A) The results of anin silicoflux simulation visualized on the reactions. B) Metabolomics data forE. coliaerobic growth visualized
on the metabolites. C) RNA-Seq data showing the shift from aerobic to anaerobic conditions inE. coli. Green represents reactions downregulated in anaerobic growth and red represents gene upregulated in anaerobic growth, based on the log2of the fold change.
doi:10.1371/journal.pcbi.1004321.g002
(GPRs)) [32]. When either of two enzymes can catalyze a reaction—as with isozymes—then these genes are connected with an OR rule. Escheraddsthe values of two genes connected with an OR rule. When two enzymes are required together for catalysis—as in an enzyme complex —these are connected with an AND rule. Escher can take themeanor theminimumof the two values connected with an OR rule; this option is selected on theSettingspage. For a compari-son of two datasets, the gene reaction rules are evaluated for each dataset separately, then a comparison is made between the two resulting values (Fig 2C).
The resulting figure shows the shift from aerobic to anaerobic conditions, where green reac-tions are downregulated anaerobically and red reacreac-tions are upregulated anaerobically (Fig 2C). Escher shows the log2of fold change between the conditions. However, Escher cannot yet display statistical significance for the datasets, so it should be paired with statistical tools (e.g. cuffdiff [31]).
Design and Implementation
JavaScript
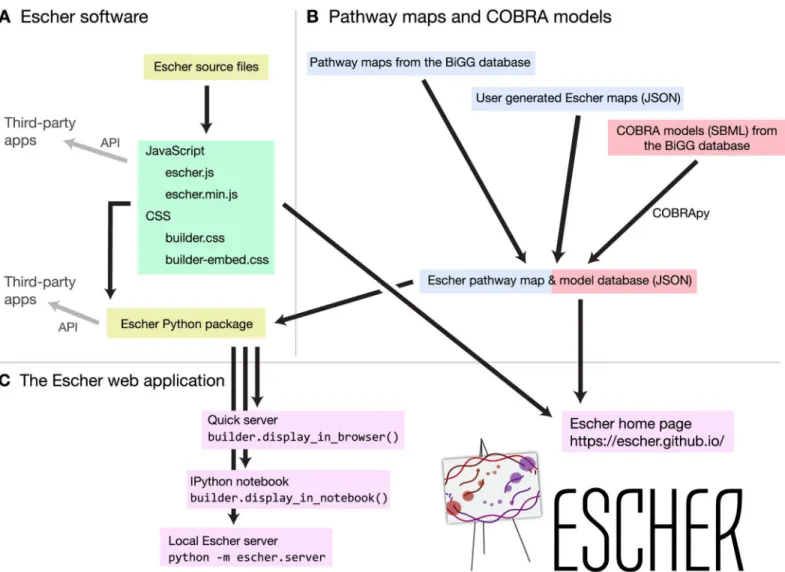
Escher is a web application written primarily in JavaScript, using the libraries D3 [21], and, optionally, JQuery (http://jquery.com) and Bootstrap (http://getbootstrap.com). The Escher JavaScript code can be compiled into a single JavaScript file, and a JavaScript API is available for interacting with and extending an Escher visualization (Fig 3A). All layout, editing, import, and export features of Escher are included in the JavaScript library, and the default visual styles are defined in two cascading style sheets (CSS) files. The Escher website is built using the Java-Script API, and other web applications can be built on top of this library.
Python
A Python package for Escher is also available (Fig 3A), and this package includes a number of extra features: access to Escher maps from Python terminals and IPython Notebooks, offline access to Escher, a local server with map and model caching, and a Python API for developing applications with these additional features. Accessing maps from Python and IPython Notebook allows Escher to be integrated directly with data analysis and modeling workflows. For example, within an IPython Notebook, the results of anin silicoflux simulation can be applied to an Escher map, and the map will be embedded and shared with the notebook. Escher even supports NBViewer for sharing static IPython Notebooks as websites (http://nbviewer.ipython.org).
Map and model database
Escher includes a database of pathway maps and genome-scale models. Pathway maps are cur-rently available for a number of organisms, and new pathway maps will be continually added to the database from our group. The maps in the BiGG database are being converted to the new Escher format [33]. We also accept contributions from the community, and the method for submitting pathway maps is described in the documentation (S2 File).
JSON schema
Export
Escher represents biochemical reactions as transformations from a set of reactants to a set of products, and each reaction can be assigned enzymes using a Booleangene reaction rule. Thus, Escher uses a well-defined representation of the biochemical network, but the scope of the Escher notation is much more specific than community standards such as Systems Biology Graphical Notation (SBGN) [34] and Systems Biology Markup Language (SBML) with the lay-out extension [35–37]. Escher can be exported to both formats using the EscherConverter application (Fig 4). EscherConverter is written in Java™, and it is available as a standalone exe-cutable file (S3 File) that includes a graphical user interface with graph drawing capabilities and a command-line interface. Files can be opened through drag and drop or the file menu, and a history of up to 10 recent files is stored. Several user preferences allow flexible customiza-tion of the file conversion. The conversion to SBML and SBGN-ML (the XML implementacustomiza-tion of SBGN) relies heavily on JSBML [38] and libSBGN [39].
Fig 3. The organization of the Escher project.A) Escher source code can be compiled to a single JavaScript file (either minified or not minified) and two style sheets. The Python package is used to serve the Escher web application in various ways. APIs exist for both JavaScript and Python. B) Escher maps are generated from the BiGG database or built by users. COBRA models are generated using COBRApy. C) The Escher web application can be viewed on the Escher website, or, for local access, using various methods in the Python package.
doi:10.1371/journal.pcbi.1004321.g003
Open-source development
Escher is hosted on GitHub, with a public bug tracker and tools for community contribution to the codebase (https://github.com/zakandrewking/escher). Documentation for Escher is avail-able and was generated using Sphinx and ReadTheDocs (https://escher.readthedocs.org). This documentation includes a description of the Escher features and detailed information on the JavaScript and Python APIs.
Integrating Escher with analysis workflows
The Escher Python package, which is available from the Python Package Index (PyPI,https:// pypi.python.org), can be used to integrate Escher maps with data analysis and simulation workflows. Using the available functions, datasets can be applied to Escher maps, and the resulting maps can be saved as standalone web pages, saved as JSON or SVG, or exported using the EscherConverter as a command line utility. The Python package works directly with COBRA models using COBRApy [40]. It also includes functions for modifying all of the Escher map settings, including the color and size scales for all elements.
Fig 4. The import and export types in Escher and the EscherConverter.A) Escher can save to the Escher JSON file format or export to a SVG image. EscherConverter can be used to generate files in the SBML and SBGN-ML formats. B) The EscherConverter graphical user interface.
The Python package also includes a simple web server to run Escher locally. The web server caches maps and models for offline use, and users can also add maps to the cache directory so that they appear in the local web application. The following commands will install the package, print the location of the local cache directory, and run the Escher server:
# install escher pip install escher
# print the cache directory
python -c“import escher; print escher.get_cache_dir()”
# run the local server (available athttp://localhost:7778) python -m escher.server
Developing with Escher
Application programming interfaces (APIs) are available for both JavaScript and Python to enable users to build, modify, and export maps programmatically. The specific functions in the APIs are defined in the Escher Documentation. New web applications can be built on top of the basic Escher functions by developing with the Escher JavaScript API. The Documentation provides details on implementing a very simple web page with an embedded Escher map.
Availability and Future Directions
Escher version 1.1 is now available. Bug fixes and new pathway maps will be released regularly, and a number of Escher applications are currently in progress. Escher releases will follow the Semantic Versioning guidelines (http://semver.org) so that application developers can rely on new versions of Escher to be backwards compatible.
The Escher approach to web visualization
A major focus during development of future Escher versions will be to generalize and improve the approach to web visualization. As discussed in the Introduction, there are many types of biological visualizations that contribute to our interpretation of“omics”datasets. Successful user interface designs should be applicable to all of these visualization types, with modifications for the specific needs of a tool. As web platforms become ubiquitous for application develop-ment, it is important to consider what elements might be shared across a suite of visualization tools. This would make development of new tools easier, and improve interoperability between tools. For example, a genetic dataset in Escher could link directly to a visualization of the data-set on a genome browser.
The BiGG database
Escher will be included in the next release of the BiGG database [33]. The BiGG database is a repository for COBRA models developed in the Systems Biology Research Group at the Uni-versity of California, San Diego. BiGG already includes static pathway maps for many models in the database. Escher maps will be embedded in the web pages for models, reactions, and metabolites so that users can quickly see the network context of a biological component, and the maps will be available on both the BiGG and Escher websites.
A community effort
The Escher framework is highly amenable to improvements, such as new visual features. Exam-ple improvements include compartment membranes, representations of regulation and signal-ing such as those in the SBGN specification, better statistical tools for analyzsignal-ing and comparsignal-ing various data types, more import and export options, and direct integration of other visualiza-tions (such as protein and metabolite structures). Because Escher is an open-source project, contributions from the community—bug fixes, use cases, code contributions, etc.—will be encouraged and will be an important factor in making Escher a sustainable, long-term solution to the challenges of visualizing biological pathways.
Availability and Requirements
1. Project name: Escher
2. Project home page:https://escher.github.io
3. Project source:https://github.com/zakandrewking/escher
4. Open-source license: MIT license
5. Operating systems(s): Platform independent
6. Programming languages: JavaScript, Python, and Java
7. Other requirements: none
8. Any restrictions to use by non-academics: no limitations
Supporting Information
S1 File. The source code for Escher JavaScript and Python libraries.This source code is for
Escher version 1.1.2. The latest Escher source code can be cloned or downloaded fromhttps:// github.com/zakandrewking/escher.
(ZIP)
S2 File. The Escher documentation as a PDF file.This documentation is for Escher version
1.1.2. The latest Escher documentation can be found athttps://escher.readthedocs.org. (ZIP)
S3 File. The executable EscherConverter.Requires Java™version 1.8 or higher. The latest
ver-sion of EscherConverter is available on the Escher homepage athttps://escher.github.io. (ZIP)
S1 Data. Thein silicoflux predictions used to demonstrate reaction data visualization.
(ZIP)
S2 Data. The metabolomics dataset used to demonstrate metabolite data visualization. (ZIP)
S3 Data. The Escher map used to demonstrate metabolite data visualization. (ZIP)
Acknowledgments
We would like to thank Joshua Lerman, Pierre Salvy, Amoolya Singh, Daniel Dougherty, Erin Wilson, Maxime Durot, and all the scientists at Amyris, Inc., for their invaluable help and guid-ance during the development of Escher.
Author Contributions
Wrote the paper: ZAK. Designed the user interface: ZAK, AD. Designed import/export func-tionality: ZAK, AD, AE, NS. Authored the core Escher library: ZAK, AE. Defined the broad goals and software features: ZAK, AD, NEL, BOP.
References
1. Arnold K, Bordoli L, Kopp J, Schwede T (2006) The SWISS-MODEL workspace: A web-based environ-ment for protein structure homology modelling. Bioinformatics 22: 195–201. PMID:16301204
2. Herráez A (2006) Biomolecules in the computer: Jmol to the rescue. Biochem Mol Biol Educ 34: 255–
261. doi:10.1002/bmb.2006.494034042644PMID:21638687
3. Skinner ME, Uzilov AV, Stein LD, Mungall CJ, Holmes IH (2009) JBrowse: A next-generation genome browser. Genome Res 19: 1630–1638. doi:10.1101/gr.094607.109PMID:19570905
4. Karolchik D, Barber GP, Casper J, Clawson H, Cline MS, et al. (2014) The UCSC Genome Browser database: 2014 update. Nucleic Acids Res 42: 764–770. doi:10.1093/nar/gkt1168
5. Smoot ME, Ono K, Ruscheinski J, Wang PL, Ideker T (2011) Cytoscape 2.8: New features for data inte-gration and network visualization. Bioinformatics 27: 431–432. doi:10.1093/bioinformatics/btq675
PMID:21149340
6. Letunic I, Bork P (2007) Interactive Tree Of Life (iTOL): An online tool for phylogenetic tree display and annotation. Bioinformatics 23: 127–128. doi:10.1093/bioinformatics/btl529PMID:17050570
7. Huson DH, Richter DC, Rausch C, Dezulian T, Franz M, et al. (2007) Dendroscope: An interactive viewer for large phylogenetic trees. BMC Bioinformatics 8: 460. doi:10.1186/1471-2105-8-460PMID:18034891
8. Droste P, Nöh K, Wiechert W (2013) Omix—A visualization tool for metabolic networks with highest usability and customizability in focus. Chemie-Ingenieur-Technik 85: 849–862. doi:10.1002/cite. 201200234
9. Funahashi A, Matsuoka Y, Jouraku A, Morohashi M, Kikuchi N, et al. (2008) CellDesigner 3.5: A Versa-tile Modeling Tool for Biochemical Networks. Proc IEEE 96: 1254–1265. doi:10.1109/JPROC.2008. 925458
10. Rohn H, Junker A, Hartmann A, Grafahrend-Belau E, Treutler H, et al. (2012) VANTED v2: a framework for systems biology applications. BMC Syst Biol 6: 139. doi:10.1186/1752-0509-6-139PMID:
23140568
11. Czauderna T, Klukas C, Schreiber F (2010) Editing, validating and translating of SBGN maps. Bioinfor-matics 26: 2340–2341. doi:10.1093/bioinformatics/btq407PMID:20628075
12. Hu Z, Chang YC, Wang Y, Huang CL, Liu Y, et al. (2013) VisANT 4.0: Integrative network platform to connect genes, drugs, diseases and therapies. Nucleic Acids Res 41: 225–231. doi:10.1093/nar/ gkt401
13. Kutmon M, van Iersel MP, Bohler A, Kelder T, Nunes N, et al. (2015) PathVisio 3: An Extendable Path-way Analysis Toolbox. PLOS Comput Biol 11: e1004085. doi:10.1371/journal.pcbi.1004085PMID:
25706687
14. Chung HJ, Kim M, Park CH, Kim J, Kim JH (2004) ArrayXPath: Mapping and visualizing microarray gene-expression data with integrated biological pathway resources using Scalable Vector Graphics. Nucleic Acids Res 32: 621–626. doi:10.1093/nar/gkh476
15. Kono N, Arakawa K, Ogawa R, Kido N, Oshita K, et al. (2009) Pathway projector: Web-based zoomable pathway browser using KEGG Atlas and Google Maps API. PLoS One 4: e7710. doi:10.1371/journal. pone.0007710PMID:19907644
16. Yamada T, Letunic I, Okuda S, Kanehisa M, Bork P (2011) IPath2.0: Interactive pathway explorer. Nucleic Acids Res 39: 412–415. doi:10.1093/nar/gkr313
17. Kelder T, van Iersel MP, Hanspers K, Kutmon M, Conklin BR, et al. (2012) WikiPathways: Building research communities on biological pathways. Nucleic Acids Res 40: 1301–1307. doi:10.1093/nar/ gkr1074
18. Krause F, Schulz M, Ripkens B, Flöttmann M, Krantz M, et al. (2013) Biographer: Web-based editing and rendering of SBGN compliant biochemical networks. Bioinformatics 29: 1467–1468. doi:10.1093/ bioinformatics/btt159PMID:23574737
19. Latendresse M, Karp PD (2011) Web-based metabolic network visualization with a zooming user inter-face. BMC Bioinformatics 12: 176. doi:10.1186/1471-2105-12-176PMID:21595965
20. Stallman RM (1981). EMACS the extensible, customizable self-documenting display editor. ACM. 21. Bostock M, Ogievetsky V, Heer J (2011) D3: Data-Driven Documents. IEEE Trans Vis Comput Graph
17: 2301–2309. doi:10.1109/TVCG.2011.185PMID:22034350
22. Bordbar A, Monk JM, King ZA, Palsson BØ(2014) Constraint-based models predict metabolic and
associated cellular functions. Nat Rev Genet 15: 107–20. doi:10.1038/nrg3643PMID:24430943
23. King ZA, Lloyd CJ, Feist AM, Palsson BO (2015) Next-generation genome-scale models for metabolic engineering. Curr Opin Biotechnol 35: 23–29. doi:10.1016/j.copbio.2014.12.016
24. Liu J, O’Brien E, Lerman J, Zengler K, Palsson BØ, et al. (2014) Reconstruction and modeling protein
translocation and compartmentalization inEscherichia coliat the genome-scale. BMC Syst Biol 8: 110. doi:10.1186/s12918-014-0110-6PMID:25227965
25. O’Brien EJ, Lerman JA, Chang RL, Hyduke DR, Palsson BØ(2013) Genome-scale models of metabo-lism and gene expression extend and refine growth phenotype prediction. Mol Syst Biol 9: 693. doi:10. 1038/msb.2013.52PMID:24084808
26. Lewis NE, Hixson KK, Conrad TM, Lerman JA, Charusanti P, et al. (2010) Omic data from evolvedE. coliare consistent with computed optimal growth from genome-scale models. Mol Syst Biol 6: 390. doi:
10.1038/msb.2010.47PMID:20664636
27. Orth JD, Conrad TM, Na J, Lerman JA, Nam H, et al. (2011) A comprehensive genome-scale recon-struction ofEscherichia colimetabolism—2011. Mol Syst Biol 7: 535. doi:10.1038/msb.2011.65PMID:
21988831
28. McCloskey D, Gangoiti J, King Z, Naviaux R, Barshop B, et al. (2013) A model-driven quantitative metabo-lomics analysis of aerobic and anaerobic metabolism inE. coliK-12 MG1655 that is biochemically and thermodynamically consistent. Biotechnol Bioeng 111: 803–815. doi:10.1002/bit.25133PMID:24249002
29. Bordbar A, Nagarajan H, Lewis NE, Latif H, Ebrahim A, et al. (2014) Minimal metabolic pathway struc-ture is consistent with associated biomolecular interactions. Mol Syst Biol 10: 737. doi:10.15252/msb. 20145243PMID:24987116
30. Edgar R, Domrachev M, Lash AE (2002) Gene Expression Omnibus: NCBI gene expression and hybridization array data repository. Nucleic Acids Res 30: 207–210. doi:10.1093/nar/30.1.207PMID:
11752295
31. Trapnell C, Roberts A, Goff L, Pertea G, Kim D, et al. (2012) Differential gene and transcript expression analysis of RNA-seq experiments with TopHat and Cufflinks. Nat Protoc 7: 562–78. doi:10.1038/nprot. 2012.016PMID:22383036
32. Reed JL, Vo TD, Schilling CH, Palsson BØ(2003) An expanded genome-scale model ofEscherichia coliK-12 (iJR904 GSM/GPR). Genome Biol 4: R54. doi:10.1186/gb-2003-4-9-r54PMID:12952533
33. Schellenberger J, Park JO, Conrad TM, Palsson BØ(2010) BiGG: a Biochemical Genetic and Genomic
knowledgebase of large scale metabolic reconstructions. BMC Bioinformatics 11: 213. doi:10.1186/ 1471-2105-11-213PMID:20426874
34. Kitano H, Funahashi A, Matsuoka Y, Oda K (2005) Using process diagrams for the graphical represen-tation of biological networks. Nat Biotechnol 23: 961–966. doi:10.1038/nbt1111PMID:16082367
35. Hucka M, Finney A, Sauro HM, Bolouri H, Doyle JC, et al. (2003) The systems biology markup lan-guage (SBML): A medium for representation and exchange of biochemical network models. Bioinfor-matics 19: 524–531. doi:10.1093/bioinformatics/btg015PMID:12611808
36. Gauges R, Rost U, Sahle S, Wegner K (2006) A model diagram layout extension for SBML. Bioinfor-matics 22: 1879–1885. doi:10.1093/bioinformatics/btl195PMID:16709586
37. Dräger A, Palsson BØ(2014) Improving collaboration by standardization efforts in systems biology. Front Bioeng Biotechnol 2: 1–20.
38. Rodriguez N, Thomas A, Watanabe L, Vazirabad IY, Kofia V, et al. (2015) JSBML 1.0: providing a smor-gasbord of options to encode systems biology models. Bioinformatics. In press. doi:10.1093/
bioinformatics/btv341
39. van Iersel MP, Villéger AC, Czauderna T, Boyd SE, Bergmann FT, et al. (2012) Software support for SBGN maps: SBGN-ML and LibSBGN. Bioinformatics 28: 2016–2021. doi:10.1093/bioinformatics/ bts270PMID:22581176