Received on 01/08/2015; Reviewed on 04/13/2015;Accepted on 03/23/2016; Divulgued on 01/02/2017.
*Author for correspondence:
†. Master in Administration and PhD Student in Administration by the University of Fortaleza - UNIFOR.
Link: Professor of the Administration Course at Christus University Center.
Address: Avenue Dom Luís, 911 – Aldeota – Fortaleza – CE – Brazil. Cep: 60160-230.
E-mail: [email protected]
PhD in Economy by the University of Illinois.
Link: Adjunct Professor of the Post-Graduate Program in Administration of the State University of Ceará.
Address: Avenue Dr. Silas Munguba, 1700 – Campus Itaperi – Fortaleza – CE - Brazil. Cep: 60714-903.
E-mail: [email protected]
Note from the Editor: This paper was accepted by Bruno Felix.
This article has a Creative Commons License - Attribution 3.0 Not Adapted.
59
Strategic Antecedents and Consequents for the Performance of
E-Business
Companies
Elnivan Moreira de Souza†
Christus Universitary Center - Unichristus
Paulo César de Sousa BatistaΩ
State University of Ceará - UECE
ABSTRACT
This article aims to examine the influence of the strategic background and of the business model elements on its value proposition, and to investigate the relationship between the value proposition and the performance of e-business. The research is supported theoretically by the Technological, Organizational and Environmental framework (TOE), derived from the Diffusion of Innovation Theory (DIT), for the Strategic Background (IFINEDO, 2011), by the Business Model theory (OSTERWALDER; PIGNEUR; 2010; SOUZA; BATISTA, 2014) and by the business performance literature (RAMANUJAN; VENKATRAMAN, 1987). We tested the proposed model with a sample of 252 observations, using the structural equation modeling. The main results indicate a partial influence of the strategic background in the value proposition through the constructs management positioning, organizational readiness, relative advantage and pressure from stakeholders. Relating to the business model, the constructs of market segmentation, customer relationships, capabilities, partnerships and revenue model influence the value proposition, which in turn affects positively the performance of e-business companies.
BBR, Braz. Bus. Rev. (Engl. ed., Online),
Vitória, v.14, n.1, Art. 4, p. 59-85, jan.-feb. 2017 www.bbronline.com.br 1 INTRODUCTION
echnological development is changing the way companies do business. One of
the main sources of these transformations is the Internet, which became of
great importance for doing business (e-business) and to improve the
productivity of economic activities in general.
Indeed, the use of the Internet in management processes gave origin to
e-business, which favors the integration of communication technologies with
business process and management practices (KOO et al., 2007; KALAKOTA;
ROBINSON, 2005).
The Internet evolved from the condition of being an information and dissemination tool
and of affordable online exchanges to become the actual business model of companies,
characterized by global interaction of organizational activities.
Zhu, Kramer and Xu (2006) stressed that the economic impact of e-businesses are
universal knowledge and its potential to transform business models, organizational structures,
processes and relationships with customers and suppliers.
For all these aspects, there has been growing interest in the study of various dimensions
of business. By analyzing the literature, we were able to identify two main focal points on
e-business studies. The first focal point comprises the analyzes of e-e-business Strategic
Antecedents, in the form of Organizational, Technological and Environmental (TOE)
Contexts, in addition to the impact of these elements on corporate performance (IFINEDO,
2011; MARTINEZ-LÓPEZ; MARTINEZ-LÓPEZ, 2010; WEISBERG; TE’ENI; ARMAN,
2011). Specifically regarding the investigation of Strategic Antecedents (TOE), the
contributions by Ifinedo (2011) and Bordonaba-Juste, Lucia-Palacios and Polo-Redondo
(2012), who used well established scales on this construct, are of great importance for this
study.
The second group of studies are related to the activities that comprise the Business
Model (CHASTON; MAGLES, 2002; OSTERWALDER, 2004; OSTERWALDER;
PIGNEUR; TUCCI, 2005; WU; MAHJAN; BALASUBRAMANIAN, 2003). In this respect,
the contributions of greater relevance to this study are those by Osterwalder, Pigneur and
Tucci (2005). These authors developed an analysis tool, for the study of companies such as
Dell, Amazon.com and eBay, which is based on four pillars: Product, Customer Interface,
Infrastructure Management and Financial Management.
BBR, Braz. Bus. Rev. (Engl. ed., Online),
Vitória, v.14, n.1, Art. 4, p. 59-85, jan.-feb. 2017 www.bbronline.com.br
In Brazil, Araújo and Zilber (2013) used this theoretical model in research conducted
with small e-business companies. Santos, Seloti and Silva (2013) adopted the same model for
research of traditional and gourmet bakeries. These contributions are relevant, but they did not
contemplate the development of a scale to analyze the relationships of the model constructs.
With these information at hand, the authors of these research adopted as objectives: (i)
to examine the influence of strategic antecedents and the constituent elements of the business
model in its value proposition, and (ii) to investigate the relation between the value
proposition and the corporate performance of e-businesses.
In pursuing the objectives, the research strategy we adopted was an applied survey to a
non-probabilistic sample of 252 cases, of a universe comprised of managers, entrepreneurs
and practitioners engaged in activities that use the Internet to do businesses. For the data
analysis, we used descriptive statistics and multivariate data analysis, the latter comprised of
exploratory and confirmatory factor analyses and structural equation modeling.
The relevance of this study can be explained by the economic importance of the
e-business segment and the contribution that the model may offer to the improvement of these
companies’ management and the research in this type of business. In the macroeconomic
dimension, the expansion of business conducted in online environment is highlighted, whose
revenues grew from 0.5 billion (BRL) in 2001 to 28 billion in 2013 – an average increase of
430% per year and 5,600% accumulated over 13 years. There was an even greater adhesion of
consumers via web transactions, with more than 51 million consumers purchasing, at least
once in 2013, (growth of 21% over the previous year) with spending average of 350 BRL
(E-COMMERCE.ORG, 2014).
In terms of management, the study provides resource to improve the understanding of
the strategic background, the business model and the impact that both have on e-businesses’
performance, in addition to presenting indicators that allow measuring the allocation of
resources and guide strategic decisions, according to the influence of each construct on the
company’s performance.
As for the academic contribution, the study seeks to help fill the gaps observed in
empirical studies on the following aspects: (i) integrated treatment of strategic antecedents,
business model and performance; (ii) empirical application to statistically validate or reject
BBR, Braz. Bus. Rev. (Engl. ed., Online),
Vitória, v.14, n.1, Art. 4, p. 59-85, jan.-feb. 2017 www.bbronline.com.br
environmental variables (antecedents) and of each activity of the business model on the
performance of e-business companies.
In addition to this introduction, this study is composed of three more sections and final
considerations. In section 1, we present the theoretical support, the conceptual and theoretical
research hypotheses. In section 2, the methodological aspects of the research. In section 3, we
analyze and expose the results of the investigation. The article is closes with the final
considerations of the research, indicating its limitations, the relevance of the results and
suggestions for future research.
2 THEORETICAL SUPPORT, THEORETICAL-CONCEPTUAL MODEL AND HYPOTHESES
The implementation of e-business is more than a simple adoption of Information
System (IS), since it involves a deeper integration between the internal and external
management process, a closer link with partner companies, suppliers and customers, as well
as managerial and strategic advantages (LUCIA-PALACIOS et al., 2014). Koo et al. (2007)
define e-business as a business activity via online networks, in special, via the Internet. The
use of e-business can generate benefits such as cost reduction and acquisition of new skills.
The decrease of costs can occur in the supply chain and in the form of distribution
(CHAKRAVARTY; KUMAR; GREWAL; 2014). New skills can be acquired, such as the
ability to reach and serve a group of consumers in greater geographic coverage and to react
quickly to the preferences and demands of consumers (LAUDON; TRAVER, 2010).
Technological development led the Internet to evolve from being a tool of information
dissemination and affordable online exchanges to become the actual business model of
companies (KALAKOTA; ROBINSON, 2005). Companies change creating or adapting their
business model in such a way that there is a global integration of organizational activities.
In seeking to understand the e-business phenomenon, the literature review revealed two
theoretical focus of study. The former is directed to the efforts of identifying and analyzing
environmental elements that influence the adoption of e-business and the corporate
performance of the e-business. These studies brought to light a consolidated framework by the
TOE acronym, which encompasses the Technological, Organizational and Environmental
Contexts (IFINEDO, 2011; WU; MAHAJAN; BALASUBRAMANIAN, 2003;
MARTINEZ-LÓPEZ; MARTINEZ-LÓPEZ, 2010; TEO; PIAN, 2003; WEISBERG; TE’ENI; ARMAN,
BBR, Braz. Bus. Rev. (Engl. ed., Online),
Vitória, v.14, n.1, Art. 4, p. 59-85, jan.-feb. 2017 www.bbronline.com.br
The second group of studies is related to the understanding of the dynamic and
architecture used by these businesses. The new organizational arrangements that emerged
with the use of internet/e-business technology gave rise to the term Business Model, whose
centrality is the Value Proposition offered to customers (CHASTON; MAGLES, 2002;
DASILVA, TRKMAN, 2014;MARKIDES; SOSA, 2013; OSTERWALDER, 2004;
OSTERWALDER; PIGNEUR; TUCCI, 2005).
Based on these findings, and with the objective of unifying the two theoretical lines
identified in the research, the investigation was guided by the theoretical-conceptual model
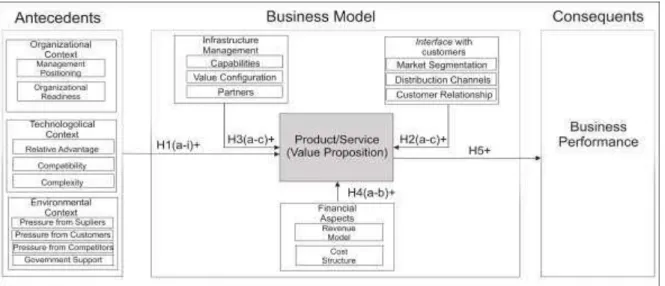
shown in Figure 1 and the hypotheses underlying it.
Figure 1 – Theoretical-conceptual model and research hypotheses
Source: Developed by the author based on Ifinedo (2011), Souza and Batista (2014) and Ramanujam and Venkatraman (1987).
2.2STRATEGIC ANTECEDENT ASSOCIATED WITH E-BUSINESS
In the Organizational Context, Management Positioning and Organizational Readiness
as influencing elements for the adoption of e-business. The first refers to the participation of
senior management in the implementation of information systems. Jeyaraj, Rottman and
Lacity (2006) found the support from the executive board to be one of the best predictors of
the adoption of technology in innovations and information systems.
When senior management understands the importance of computer technology, the
same tend to play a crucial role in influencing other members of the organization (IFINEDO,
2011). Conversely, when the support of management is low or nonexistent, acceptance and
adoption of technologies do not take priority places in the organizational objectives.
Given these considerations, we formulate the following hypothesis:
BBR, Braz. Bus. Rev. (Engl. ed., Online),
Vitória, v.14, n.1, Art. 4, p. 59-85, jan.-feb. 2017 www.bbronline.com.br
Organizational Readiness is defined by Iacavou, Benbasat and Dexter (1995) as the
availability of resources needed for adoption of Internet/e-business technologies. These
resources include not only material goods but also intangibles ones, like the human
knowledge of information systems (IFINEDO, 2011, LUNARDI; DOLCI; WENDLAND,
2013). Companies with e-business experts are more likely to adopt technological innovations
because they can develop their own web site or use specific technologies to improve the
management of its supply chain (LIN; LEE, 2005). The absence of organizational readiness is
the main harmful element to the implementation and development of e-businesses
(LUNARDI; DOLCI; WENDLAND, 2013).
Based on these contributions, we formulate the following hypothesis:
H1b – Organizational Readiness positively influences the Value Proposition;
The Technological Context has its origin in the Diffusion of Innovation Theory (DIT)
(ROGERS, 2003) and it is explained by the Relative Advantage, Compatibility and
Complexity of Technologies constructs.
Relative Advantage is the degree to which a technology is perceived as being better than
the one being currently used (ROGERS, 2003). The benefits perceived by the use of new
technologies influence the adoption of e-business as well as business performance
(LUCIA-PALACIOS et al., 2014). Therefore, we formulate the following hypothesis:
H1c – Relative Advantage positively influences the Value Proposition.
Compatibility is defined as the degree to which an innovation is perceived as being
consistent with the existing values, past experience and the needs of potential users
(ROGERS, 2003). In summary, this construct expresses the evaluation of the degree of
congruence between the new technology and the various aspects of the business and with the
situation in which the new technology will be used. The importance of compatibility in
predicting results of technology acceptance was also supported in other empirical studies
(AGARWAL; PRASAD, 1997; IFINEDO; 2011). Therefore, the following hypothesis states:
H1d – Compatibility positively influences the Value Proposition.
The Complexity of Innovations is described as the degree to which a perceived
innovation can be relatively difficult to understand and use (ROGERS, 2003). Consistent with
DIT, the acceptance of an innovation is inhibited when it is perceived by the user as complex
BBR, Braz. Bus. Rev. (Engl. ed., Online),
Vitória, v.14, n.1, Art. 4, p. 59-85, jan.-feb. 2017 www.bbronline.com.br
complex tend to raise greater support and acceptance among adopters than the more complex
ones. Thus, the complexity is related to the perceived degree of difficulty in the process of
innovation, as well as in the capacity of organizational restructuring required for its
implementation (MAKAME; KANG; PARK, 2014). Therefore, we formulate the following
hypothesis:
H1e – Complexity positively influences the Value Proposition.
In the Environmental Context, the pressure from Stakeholders, which include customers
and suppliers Competitors and the support offered by the Government.
The introduction of stakeholders as applicants and captors of value in their interaction
with the company opens an opportunity to better investigate this relationship
(GARCIA-CASTRO; AGUILERA, 2015). The pressures from external stakeholders are also important
for the adoption of e-business (CHAKRAVARTY; KUMAR; GREWAL; 2014; DEL
AGUILA; PADILLA, 2008; CHONG et al., 2009). Suppliers and customers can exert great
pressure, because they know that the benefits and advantages of these technologies are
maximized when more people use them (LUNARDI; DOLCI; WENDLAND, 2013).
Furthermore, if suppliers and customers are users of these technologies, the company will be
under pressure to adapt their processes and management, in case it wishes to continue its
relationship with these stakeholders (GARCIA-CASTRO; AGUILERA, 2015). Otherwise,
the company will assume the risk of isolating itself in the market. Thus, the following
hypotheses are formulated:
H1f – Pressure from Suppliers positively influences the Value Proposition; H1g – Pressure from customers positively influences the Value Proposition.
As for the competitive pressure, there is a growing rivalry in an environment where new
technologies have relevant influence and actions of competitors are unpredictable (PAVLOV;
EL SAWY, 2010). In markets with high competition, obtaining updated information is seen as
a basic requirement to support management decisions and technological innovation activities
(CHAKRAVARTY; KUMAR; GREWAL; 2014). Thus, the following hypothesis is
formulated:
H1h – Pressure from competitors positively influences the Value Proposition.
Government Support refers to the assistance provided by the government authorities to
BBR, Braz. Bus. Rev. (Engl. ed., Online),
Vitória, v.14, n.1, Art. 4, p. 59-85, jan.-feb. 2017 www.bbronline.com.br
relevance of government support for the adoption of technology have produced mixed results
(IFINEDO, 2011). For example, GIBBS; KRAEMER (2004) and CHAU; HUI (2001) present
the existence of a significant relationship between government support and the probability of
companies adopting innovations, including the use of Internet/e-business technology. Based
on these studies, we formulate the following hypothesis:
H1i – Government Support positively influences the Value Proposition.
2.3 THE BUSINESS MODEL AND E-BUSINESS
The concept of business model does not have a clear and unequivocal definition in the
literature, which has made studies on the subject difficult. More than that, this expression has
been misunderstood and improperly used over the years, both by practitioners and scholars. It
has often been confused with other popular terms of management literature, such as strategy,
business concept, revenue model, economic model, or even business process modeling
(DASILVA, TRKMAN, 2014).
The construction of the business model enables companies to deploy e-business
activities, this being defined as the complex function of business processes, business
applications and organizational structure required to achieve high performance. Strategies,
structures and systems must be aligned for the success of virtual business (MARKIDES,
2013). Companies often have strategies that do not line up properly their structures and
systems, which leads to poor performance in the implementation phase of electronic
businesses (EPSTEIN, 2000). An integrated strategy should direct the investments required to
develop the necessary infrastructure, not only in terms of information systems, but mainly of
human resources and appropriate processes to support the virtual operation. In these
circumstances, the business model concept is relevant as guidance of the company
architecture for the delivery of value.
Osterwalder (2004) proposes a framework for the formulation of business models of
any kind, albeit stressing that his model is more suitable for companies making intensive use
of technologies because it contributes to the alignment between business, organizational and
technological strategies. The Business Model proposed by this author is composed of four
pillars which are divided into nine elements which constitute the scope of companies’
activities.
The product/service, first pillar, is a central element in the Ontological Business Model
BBR, Braz. Bus. Rev. (Engl. ed., Online),
Vitória, v.14, n.1, Art. 4, p. 59-85, jan.-feb. 2017 www.bbronline.com.br
presented by the company to the market and it conditions all activities to be performed. The
Value Proposition presented in the Business Model, can be understood as the statement of
benefits that are delivered by the company to its customers and other stakeholders
(MCNAMARA; PECK; SASSON, 2013).
The other three elements are the Market Segmentation, Distribution Channels and
Customer Relationship, selected from the customer interface area. This area refers to the way
the company presents itself to the market, as it actually reaches its customers and how it
interacts with them (CHAKRAVARTY; KUMAR; GREWAL, 2014; OSTERWALDER,
2004; OSTERWALDER; PIGNEUR, 2010).
According to Osterwalder and Pigneur (2010), effective targeting allows a company to
better allocate investment resources to target customers who will be more attracted by its
Value Proposition, In addition to assisting in the decision-making process of choices of
distribution channels. In view of the above, we formulate the hypotheses H2a and H4b, in
relation to the influence of the business model elements on the Value Proposition:
H2a – Market Segmentation positively influences the Value Proposition.
The Distribution Channel corresponds to the means by which the organization can
contact the customer. The activities of this construct that will interconnect Value Proposition
and Market Segmentation. Its purpose is to make the right quantities of the right products or
services available for the right income at the right time reach out to customers, for the right
people, subject to cost, investment and flexibility constraints (MAKAME; KANG; PARK,
2014).
Thus, the following hypothesis is formulated:
H2b – Distribution channels positively influence the Value Proposition.
The activities associated with Customer Relationship define the type of connection and
the strength of the relationship the company has with the client (OSTERWALDER;
PIGNEUR; TUCCI, 2005). The profits of relationships with customers are the lifeblood of all
businesses, and can be reached by the acquisition of new customers, increasing the
profitability of existing customers and the relationships lasting length of time
(CHAKRAVARTY; KUMAR; GREWAL, 2014).
Given these considerations on the relationship with the customer, we have the following
BBR, Braz. Bus. Rev. (Engl. ed., Online),
Vitória, v.14, n.1, Art. 4, p. 59-85, jan.-feb. 2017 www.bbronline.com.br H2c – Customer Relationship positively influences the Value Proposition.
The Infrastructure Management is the dimension that describes what skills are necessary
to promote the Value Proposition, in line with the Customer Interface (ARAÚJO; ZILBER,
2013). In other words, it specifies the capabilities and resources of the business model, its
owners and suppliers, as well as the activities that it performs and how they are related.
Wilden et al. (2013) describe the capabilities as repetitive patterns of action in the use of
assets to create, produce and offer products and services to the market. Thus, a company has
to have a set of capabilities, in order to provide its Value Proposition and obtain top
performance. These resources depend on the goods or the company’s resources (PETERAF;
STEFANO; VERONA, 2013), and they increasingly outsourced to partners, using e-business
technologies to maintain tight integration, which is necessary for a business to function
efficiently. Having presented the main concepts and aspects of capabilities, we introduce the
following hypothesis:
H3a – Capabilities positively influence the Value Proposition.
The main purpose of a business is to create value that customers are willing to pay for.
This value is the result of a configuration of activities and processes inside and outside the
organization (GARCIA-CASTRO; AGUILERA, 2015). The value of the configuration shows
all necessary activities and the links between these, in order to create value for the customer.
Thus, we have the hypothesis:
H3b – Value Configuration positively influences the Value Proposition.
Partnership is a voluntary initiative agreed between two or more organizations with the
goal of creating value for customers. In the context of e-business, there are several names for
these new forms of strategic networks in the process of creating value, among them the
b-webs, fluid and flexible organizations and value networks (NALEBUFF;
BRANDENBURGER, 1997). The appearance of such business networks significantly
improved the range of possible organizational arrangements for value creation (GULATI,
1998). As a result, companies should reflect on what kind of resources the partner could
leverage on their business model and on their own competencies. Therefore, we formulate the
following hypothesis:
BBR, Braz. Bus. Rev. (Engl. ed., Online),
Vitória, v.14, n.1, Art. 4, p. 59-85, jan.-feb. 2017 www.bbronline.com.br
The Financial Aspects are the last block of the framework proposed by Osterwalder
(2004). It is transversal because all the other pillars influence it. The Financial aspects consist
of the Revenue Model and Cost Structure. Together, these factors determine the financial
situation of the company and its survival ability in the competitive market. The Revenue
Model measures the ability of a company to transform into cash and incoming revenue flows,
the value offered to customers. It may be composed of different flows with different pricing
mechanisms (DASILVA, TRKMAN, 2014; OSTERWALDER; PIGNEUR, 2010). Thus, we
have the hypothesis:
H4a – The Revenue Model positively influences the Value Proposition.
The last element is the Cost Structure. This structure measures all costs generated by the
company, in order to create, sell and deliver value to its customers. It sets price for all
resources, goods, activities and relationships of the partners network and exchanges
(OSTERWALDER, PIGNEUR, 2010). Therefore, we formulate the following hypothesis:
H4b – The Cost Structure positively influences the Value Proposition.
2.4 BUSINESS PERFORMANCE
Business Performance is a complex and multifaceted phenomenon, and is an issue that
has received great attention in conceptual and empirical studies. For Barney (1991), the
concept of business performance represents a general perception of the firm’s results,
resulting from a comparison of the value generated by an organization, using given capital,
with the value that the owners of this capital hope to obtain.
Unlike the one-dimensional concept provided by the neoclassical economic model, the
performance of companies offers a great variety. The differences between companies’
performance can derive from unique resources and expertise of a specific company and from
holding a privileged and protected position from the market structure. However, the
performance of companies can also be explained by the relevance to a particular type of
industry or economic shocks in particular years (BRITO; VASCONCELOS, 2004).
Regardless of the approach, the fact is that the information and performance evaluation
are organizational tools translated to the flexibility in identifying future directions in the
shortest period of time. By performance analysis, organizations can measure their
survivability and continuity in view of the requirements of the internal and external
environment which they are inserted in. The development of a management process which
BBR, Braz. Bus. Rev. (Engl. ed., Online),
Vitória, v.14, n.1, Art. 4, p. 59-85, jan.-feb. 2017 www.bbronline.com.br
redesign and implement systems to measure and evaluate performance (SINK; TUTTLE,
1993).
Among the many existing scales to measure performance, we opted to use the scale
developed by Ramanujam and Venkatraman (1987), recently adapted by Parnel (2011) and
already validated and used in Brazil by Almeida and others (2013). Given the above and the
common approach to the Business Performance construct in strategy research (WILDEN et
al., 2013), we have the last hypothesis and possibly the most relevant one to this research:
H5 – The Value Proposition positively influences the Performance. 3 METHODOLOGICAL ASPECTS
3.1 POPULATION, SAMPLE AND RESEARCH DESIGN
Based on the understanding that e-business consists of business activities favored by the
use of the Internet (Koo et al., 2007), the world of research included managers entrepreneurs
and practitioners engaged in activities using the Internet and related technologies for doing
business. In this universe, we used a non-probabilistic sample of 252 cases.
As to the objectives, the research is explanatory since its main purpose is the
investigation of the relationship between the strategic background, the activities of the
business model and business performance. With regard to procedures, the research strategy
combines bibliographical research and survey, in this case with the use of qualitative
variables, the five-point Likert type. Survey respondents were selected by accessibility
(MARTINS; THEÓFILO, 2009; BABBIE, 2001).
3.2 DATA COLLECTION INSTRUMENT AND CONSTRUCTS MEASUREMENT SCALES
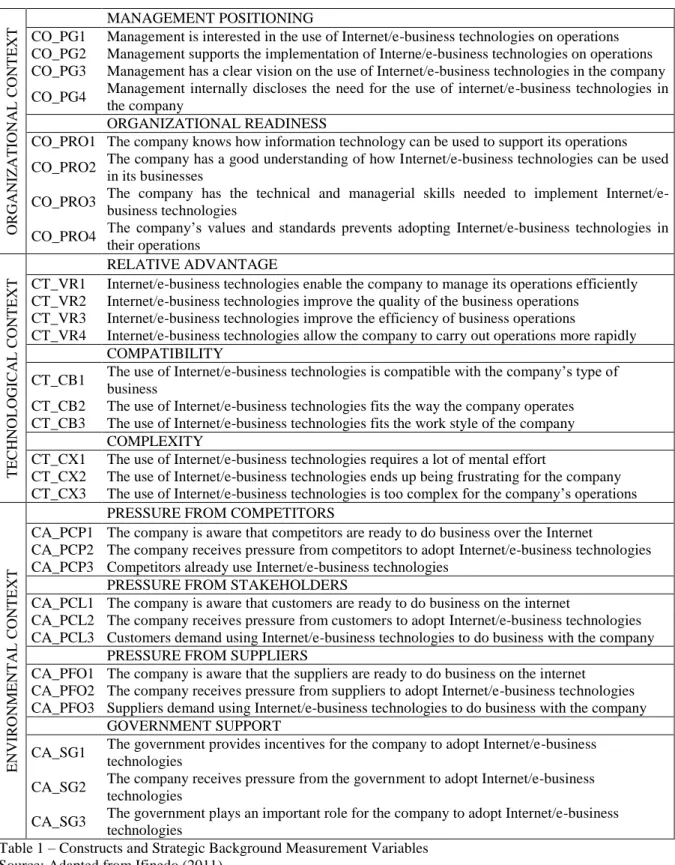
For the fulfillment of the proposed objective we used, in a way that was adapted for the
antecedents, the scale by Ifinedo (2011) (Table 1). For the Business Model, we used the scale
by Souza and Batista (2014), which was developed based on studies by Osterwalder (2004),
Osterwalder, Pigneur and Tucci (2005); and Osterwalder and Pigneur (2010) for Business
Models (Table 2) and to measure business performance (Table 3) the scale developed by
Ramanujam and Venkatraman (1987).
Regarding the Business Model, according to the bibliometric study by Zott, Amit and
Massa (2011) on the application of the concept in empirical research and theoretical tests, we
BBR, Braz. Bus. Rev. (Engl. ed., Online),
Vitória, v.14, n.1, Art. 4, p. 59-85, jan.-feb. 2017 www.bbronline.com.br
theoretical constructs. This same research also indicates the model by Osterwalder and Pineur
(2010) as one of the most widespread in the academic and professional field.
OR GANI Z AT IONAL C ONT E XT MANAGEMENT POSITIONING
CO_PG1 Management is interested in the use of Internet/e-business technologies on operations CO_PG2 Management supports the implementation of Interne/e-business technologies on operations CO_PG3 Management has a clear vision on the use of Internet/e-business technologies in the company
CO_PG4 Management internally discloses the need for the use of internet/e-business technologies in the company
ORGANIZATIONAL READINESS
CO_PRO1 The company knows how information technology can be used to support its operations
CO_PRO2 The company has a good understanding of how Internet/e-business technologies can be used in its businesses
CO_PRO3 The company has the technical and managerial skills needed to implement Internet/e-business technologies
CO_PRO4 The company’s values and standards prevents adopting Internet/e-business technologies in their operations T E C HNOL OGI C AL C ONT E XT RELATIVE ADVANTAGE
CT_VR1 Internet/e-business technologies enable the company to manage its operations efficiently CT_VR2 Internet/e-business technologies improve the quality of the business operations
CT_VR3 Internet/e-business technologies improve the efficiency of business operations
CT_VR4 Internet/e-business technologies allow the company to carry out operations more rapidly COMPATIBILITY
CT_CB1 The use of Internet/e-business technologies is compatible with the company’s type of business
CT_CB2 The use of Internet/e-business technologies fits the way the company operates CT_CB3 The use of Internet/e-business technologies fits the work style of the company
COMPLEXITY
CT_CX1 The use of Internet/e-business technologies requires a lot of mental effort
CT_CX2 The use of Internet/e-business technologies ends up being frustrating for the company CT_CX3 The use of Internet/e-business technologies is too complex for the company’s operations
E NVI R ONM E NT AL C ONT E XT
PRESSURE FROM COMPETITORS
CA_PCP1 The company is aware that competitors are ready to do business over the Internet
CA_PCP2 The company receives pressure from competitors to adopt Internet/e-business technologies CA_PCP3 Competitors already use Internet/e-business technologies
PRESSURE FROM STAKEHOLDERS
CA_PCL1 The company is aware that customers are ready to do business on the internet
CA_PCL2 The company receives pressure from customers to adopt Internet/e-business technologies CA_PCL3 Customers demand using Internet/e-business technologies to do business with the company
PRESSURE FROM SUPPLIERS
CA_PFO1 The company is aware that the suppliers are ready to do business on the internet CA_PFO2 The company receives pressure from suppliers to adopt Internet/e-business technologies CA_PFO3 Suppliers demand using Internet/e-business technologies to do business with the company
GOVERNMENT SUPPORT
CA_SG1 The government provides incentives for the company to adopt Internet/e-business technologies
CA_SG2 The company receives pressure from the government to adopt Internet/e-business technologies
CA_SG3 The government plays an important role for the company to adopt Internet/e-business technologies
Table 1 – Constructs and Strategic Background Measurement Variables Source: Adapted from Ifinedo (2011).
The scale used to measure the business model followed the taxonomy and ontological
BBR, Braz. Bus. Rev. (Engl. ed., Online),
Vitória, v.14, n.1, Art. 4, p. 59-85, jan.-feb. 2017 www.bbronline.com.br VALUE PROPOSITION
PR
OD/
SERV.
PS_PV1 The product/service that the company offers perfectly meets the needs of customers PS_PV2 Products/services offered by the company are known for their quality
PS_PV3 The price of the product/service of the company has significant impact on the value proposition
PS_PV4 The company offers a product/service considered as innovative
PS_PV5 The life cycle of the product / service offered by the company is relatively short (less than 1 year) C USTO ME R I NT E R F AC E MARKET SEGMENTATION
IC_SM1 In the company there is a clear definition of the market segment that it serves
IC_SM2 The market segment that the company serves is directly linked to the product/service that it offers
IC_SM3 The company is already recognized in the market because of the product/service that is offers DISTRIBUTION CHANNELS
IC_CD1 The company uses the Internet to deliver products/services
IC_CD2 The company uses more than one mechanism to deliver products/services IC_CD3 The company’s operations are integrated with the logistics (delivery of products)
IC_CD4 The type of client that the company serves is considered when choosing distribution channels CUSTOMER RELATIONSHIP
IC_RC1 The company adopts a personalized relationship with customers IC_RC2 Customers put their trust in the company/brand
IC_RC3 The relationship with customers is based on high switching costs (e.g. software replacement) IC_RC4 The company can retain and maintain a good relationship with customers
INFR AST R U C T UR E MA NA GE ME NT CAPABILITIES
GI_CP1 The company can make good use of the resources it has to offer differentiated products/services
GI_CP2 The company knows how to use machines, buildings and equipment to produce quality products/services
GI_CP3 The company knows how to use the knowledge and team skills to generate innovative products/services
VALUE CONFIGURATION
GI_CV1 The company uses in an integrated manner all the operational activities GI_CV2 The company seeks to add value by incorporating new products/services GI_CV3 Products/services offered by the company are difficult to copy
PARTNERSHIPS
GI_PA1 The company establishes partnerships to purchase cheaper products/services GI_PA2 The company forms partnerships to reduce environmental risks and uncertainties
GI_PA3 The company forms partnerships to acquire new resources such as machines and equipment
GI_PA4 The company forms partnerships to acquire new capabilities such as patents, trademarks and know-how FIN ANCIAL MA NAGE ME NT REVENUE MODEL
GF_MR1 The company earns revenue through the sale of products/services GF_MR2 The company earns revenues by receiving loan interest
GF_MR3 The company earns revenue from advertising products/services from partner companies GF_MR4 The company earns revenue by receiving commissions
COST STRUCTURE
GF_EC1 The company knows the participation of each item of its cost structure
GF_EC2 The company regularly monitors the cost of its activities
GF_EC3 The company’s costs are compatible with the costs of major competitors
GF_EC4 The company’s cost structure is compatible with the business model that it adopts Table 2 – Constructs and Business Models Measurement Variables
Source: Souza and Batista (2014).
In order to measure the business performance, qualitative variables were used based on
BBR, Braz. Bus. Rev. (Engl. ed., Online),
Vitória, v.14, n.1, Art. 4, p. 59-85, jan.-feb. 2017 www.bbronline.com.br
Venkatraman (1987) and adapted by Parnell (2011), composed of five measurement variables
(Table 3).
Table 3 – Construct Performance Measurement Variables
PERFORMANCE DES_1 Sales Volume Growth DES_2 Revenue Growth DES_3 Market share DES_4 Profit Margin DES_5 Net Profit
Source: Ramanujan and Venkatraman (1987)
3.3 COLLECTION PROCEDURES AND DATA DESCRIPTION
Data were collected in November and December 2013, in events on innovation,
entrepreneurship, startups, social media and digital marketing through printed and electronic
questionnaires.
Respondents were asked about the strategic antecedents, formed by Organizational,
Technological and Environmental contexts (IFINEDO, 2011), business models, comprised by
the dimensions Product/Service, Customer Interface, Infrastructure Management and
Financial Management (OSTERWALDER, 2004; OSTERALDER; PIGNEUR; TUCCI,
2005) and business performance (RAMANUJAN; VENKATRAMAN, 1987).
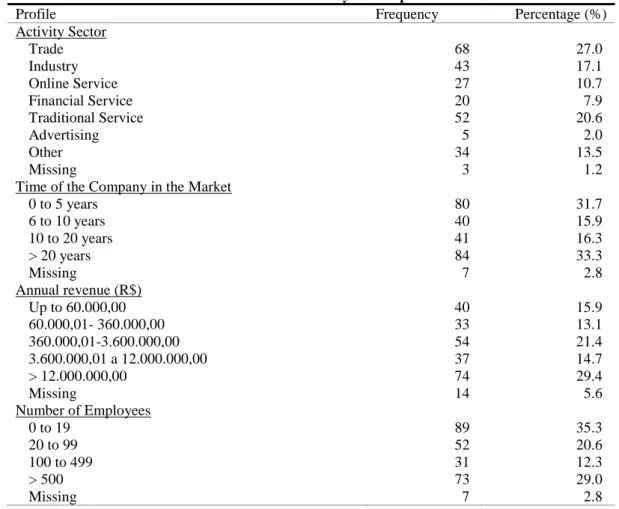
Table 4 - Profile of Surveyed Companies
Profile Frequency Percentage (%)
Activity Sector
Trade 68 27.0
Industry 43 17.1
Online Service 27 10.7
Financial Service 20 7.9
Traditional Service 52 20.6
Advertising 5 2.0
Other 34 13.5
Missing 3 1.2
Time of the Company in the Market
0 to 5 years 80 31.7
6 to 10 years 40 15.9
10 to 20 years 41 16.3
> 20 years 84 33.3
Missing 7 2.8
Annual revenue (R$)
Up to 60.000,00 40 15.9
60.000,01- 360.000,00 33 13.1
360.000,01-3.600.000,00 54 21.4
3.600.000,01 a 12.000.000,00 37 14.7
> 12.000.000,00 74 29.4
Missing 14 5.6
Number of Employees
0 to 19 89 35.3
20 to 99 52 20.6
100 to 499 31 12.3
> 500 73 29.0
BBR, Braz. Bus. Rev. (Engl. ed., Online),
Vitória, v.14, n.1, Art. 4, p. 59-85, jan.-feb. 2017 www.bbronline.com.br
Regarding the time of companies in the market, there is a higher incidence of young
companies (up to 5 years, 31.7%) and companies in the market for longer than 20 years
(33.3%), while companies in the market between 6 and 10 years and between 10 and 20 years
presented relatively close numbers (16%) (Table 4).
4 RESULTS PRESENTATION AND ANALYSIS
For the treatment of data we used the software Statistical Package for the Social
Sciences (SPSS), descriptive statistics modules, factor analysis and scale reliability tests and
the Analysis of Moment Structures (AMOS) for the construction of the measurement and
structural models.
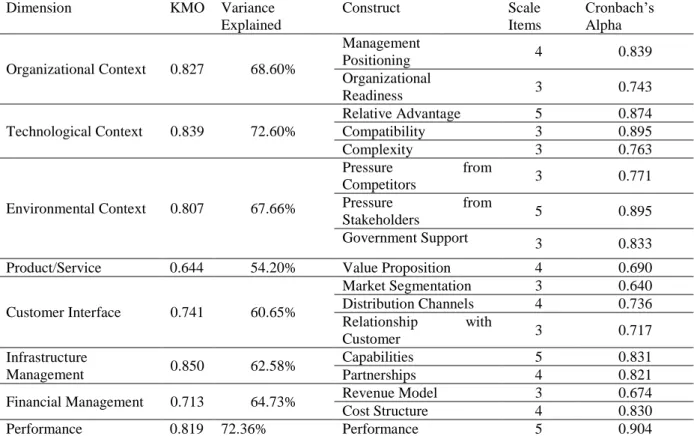
4.1 EXPLORATORY FACTOR ANALYSIS AND SCALE CLEANING
The Exploratory Factor Analysis (EFA) took place through the analysis method of the
main components and varimax orthogonal rotation. The criteria adopted for the EFA
demanded extracted communality of the items greater than 0.4, Bartlett’s sphericity test,
significant at the 0.05 level, and the Keiser-Meyer-Olkin (KMO) greater than 0.50 (HAIR et
al., 2009). The internal reliability analysis was used for calculating the Cronbach’s alpha
coefficient. As a criterion of choice, we used the classification by Hair et al. (2009).
To verify the discriminant validity, the factors of the constructs were transformed into
variables and their correlations were extracted. Zero values indicate the difference between
the constructs (COSTA, 2011). Once these procedures were done, it was necessary to remove
six variables from the scales as they did not fit in the theoretical group (factors) nor in the
statistical criteria: CO_PRO4, CA_PCL1, PS_PV5, IC_RC3, GI_CV3 e GF_MR1.
The EFA for the Environmental Context dimension constructs was done keeping the
theoretical constructs initially proposed. We hoped that four factors would emerge, however,
only three did. The variables from the group CA_PCL were divided into two factors. The
variables CA_PCL2 and CA_PCL3 grouped together with the variables of the CA_PF group.
The CA_PCL1 variable was grouped with the variables of the CA_PCP group. We verified
that the variable CA_PCL1 does not have theoretical adherence in relation to the variables of
the CA_PCP construct; therefore, we decided to remove this variable from the analysis. The
CA_PCL2 and CA_PCL3 variables were grouped with the CA_PFO construct and, for
analysis purposes, these new items were renamed as Pressure from Stakeholders (CA_PSK).
This taxonomy is the same used by Del Aguila and Padilla (2008), Chong et al. (2009) and
Gao, Liu and Wu (2010) and Bordonaba-Juste, Lucia-Palacios and Polo-Redondo (2012),
BBR, Braz. Bus. Rev. (Engl. ed., Online),
Vitória, v.14, n.1, Art. 4, p. 59-85, jan.-feb. 2017 www.bbronline.com.br
CA_PCL2 was renamed as CA_PSK1, CA_PCL3 as CA_PSK2, and CA_PFO1 as CA_PSK3,
CA_PFO2 as CA_PSK4, and CA_PFO3 as CA_PSK5.
The constructs of the Infrastructure Management dimension also underwent
adjustments. The EFA presented only two factors instead of three. The variables GI_CV1 and
GI_CV2 were grouped in the factor of the GI_CP variables. The variable GI_CV3 presented
communality of 0.111 and was not grouped with any factor. By analyzing the affirmatives of
the construct GI_CV, we can verify that the variables GI_CV1 and GI_CV2 are associated
with capabilities more than they are with the value configuration. Thus, the GI_CV construct
was dissolved. The variable GI_CV3 was excluded, the variables GI_CV1 and GI_CV2 were
incorporated to the construct GI_CP being named GI_CP4 e GI_CP5, respectively.
Table 5 shows the factor structure of the constructs used in this study.
Table 5 - Factorial Structure of Constructs
Dimension KMO Variance
Explained
Construct Scale
Items
Cronbach’s
Alpha
Organizational Context 0.827 68.60%
Management
Positioning 4 0.839
Organizational
Readiness 3 0.743
Technological Context 0.839 72.60%
Relative Advantage 5 0.874
Compatibility 3 0.895
Complexity 3 0.763
Environmental Context 0.807 67.66%
Pressure from
Competitors 3 0.771
Pressure from
Stakeholders 5 0.895
Government Support 3 0.833
Product/Service 0.644 54.20% Value Proposition 4 0.690
Customer Interface 0.741 60.65%
Market Segmentation 3 0.640
Distribution Channels 4 0.736 Relationship with
Customer 3 0.717
Infrastructure
Management 0.850 62.58%
Capabilities 5 0.831
Partnerships 4 0.821
Financial Management 0.713 64.73% Revenue Model 3 0.674
Cost Structure 4 0.830
Performance 0.819 72.36% Performance 5 0.904
4.2 A CONFIRMATORY FACTOR ANALYSIS AND MEASUREMENT MODEL
The objectives of the CFA are to verify the factorial structure proposed and explore if
any significant changes are necessary. By running the model, we verified that the aggregate
values of the CFA returned some indexes below what is recommended by the literature. The χ
2
/df < 3, significance level at 0.99 and RMSEA < 0.08, however, the IFI, TLI and the CFI
BBR, Braz. Bus. Rev. (Engl. ed., Online),
Vitória, v.14, n.1, Art. 4, p. 59-85, jan.-feb. 2017 www.bbronline.com.br
In calculating the full model, five variables presented factor loadings below 0.50— the
PS_PV3, PS_PV4, IC_CD3, IC_CD4 and the IC_SM3 —, and all were removed. The next
step was the re-specification by the covariance of the residual errors identified in the reports
of the modification indexes of the AMOStm (BYRNE, 2010). The results indicate that the chi-square differences were statistically significant, then the re-specified models replaced the
original models of the seventeen constructs. After these adjustment procedures, there was an
improvement in the indicators, with the IFI, TLI and CFI (Table 6) greater than 0.90 (HAIR
JUNIOR et al., 2009).
Table 6 – Statistical Adjustment Indices of the Re-Specified Model
Chi-square ( 2) Degrees of freedom (df) 2/df p IFI TLI CFI RMSEA
2,218.921 1.554 1.428 0.000 0.915 0.900 0.912 0.041
Given that there were considerable changes in the constructs, we chose to again perform
the procedures of convergent and discriminant validity through metrics of composite
reliability (CR), average variance extracted (AVE) correlation of constructs.
Thus, by using the confirmatory factor analysis statistical technique, in order to verify
the validity of the constructs and to assess whether the sets of indicators used were measuring
what they should theoretically measure in terms of reliability, convergent and discriminant
validity we can conclude that the results were consistent in all the constructs of the model.
4.3 THE STRUCTURAL MODEL AND HYPOTHESIS TESTING
The Structural Equation Modeling is a statistical method used to achieve a confirmatory
framework, by means of hypothesis testing and the theory structural analysis (BYRNE, 2010).
The hypothetical model can be tested statistically in simultaneous analysis of all variables to
determine the consistency of the data. In terms of indicators, for the acceptance of the
hypothesis, the Critical Ratio (C.R.) should be greater than 1.64 for p≤0.10, greater than 1.96 for p≤0.05, both for tolerable acceptance, and ideally, it should be greater than 2.58 in order to
meet the adequate significance of p≤ 0.01 (HAIR JUNIOR et al., 2009; BYRNE; 2010).
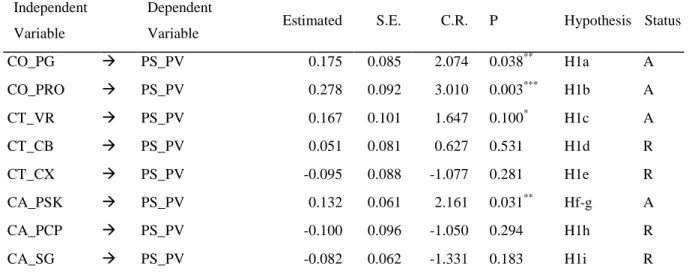
The hypotheses H1a, H1b, H1c, H1d, H1e, H1f, H1g, H1h and H1i refer to the
relationship between the Strategic Antecedents (independent variables) and the Business
Model (dependent variables). In Table 7, we verify that out of the eight constructs, four
presented significant relationship with the Value Proposition. Therefore, hypotheses H1a,
H1b, H1c and H1f-g were not rejected. Thus, we conclude that Management Positioning,
Organizational Readiness, Relative Advantage and Pressure from Stakeholders positively
BBR, Braz. Bus. Rev. (Engl. ed., Online),
Vitória, v.14, n.1, Art. 4, p. 59-85, jan.-feb. 2017 www.bbronline.com.br
Table 7 – Hypotheses test between Strategic Antecedents and Value Proposition
Independent
Variable
Dependent
Variable Estimated S.E. C.R. P Hypothesis Status
CO_PG PS_PV 0.175 0.085 2.074 0.038** H1a A
CO_PRO PS_PV 0.278 0.092 3.010 0.003*** H1b A
CT_VR PS_PV 0.167 0.101 1.647 0.100* H1c A
CT_CB PS_PV 0.051 0.081 0.627 0.531 H1d R
CT_CX PS_PV -0.095 0.088 -1.077 0.281 H1e R
CA_PSK PS_PV 0.132 0.061 2.161 0.031** Hf-g A
CA_PCP PS_PV -0.100 0.096 -1.050 0.294 H1h R
CA_SG PS_PV -0.082 0.062 -1.331 0.183 H1i R
Notes:*p≤0.10; **p≤0.05; ***p≤0.01; A=Hypothesis not Rejected; R= Hypothesis Rejected.
In Table 8 we present the results of the hypothesis test H2a, H2b, H2c, H3a, H3c, H4a
and H4b, referring to the relationship between the business model constructs. According to
Osterwalder and Pigneur (2010), business model elements should be directed to impact the
Value Proposition. It should be highlighted that hypothesis H3b was not tested, considering
that the three observable variables of the Value Configuration, in the EFA, one was excluded,
and the other two were incorporated to the Capabilities construct. The hypothesis test revealed
that 5 elements positively influence the Value Proposition. They are: Market Segmentation,
Relationship with the Customer, Capabilities, Partnerships and Revenues Model. Only Cost
Structure and Distribution Channels presented no significant relationship with the Value
Proposition.
Table 8 – Hypotheses test between the Constructs of the Business Model and Value Proposition
Independent Variable
Dependent
Variable Estimated S.E. C.R. P Hypothesis Status
IC_SM PS_PV 0.178 0.090 1.985 0.047** H2a A
IC_CD PS_PV -0.054 0.047 -1.136 0.256 H2b R
IC_RC PS_PV 0.588 0.116 5.061 0.001*** H2c A
GI_CP PS_PV 0.242 0.098 2.481 0.013** H3a A
GI_PA PS_PV 0.121 0.062 1.957 0.050** H3c A
GF_MR PS_PV -0.133 0.065 -2.048 0.041** H4a A
GF_EC PS_PV 0.058 0.085 0.684 0.494 H4b R
Notes:*p≤0.10; **p≤0.05; ***p≤0.01; A=Hypothesis not Rejected; R= Hypothesis Rejected.
In Table 9, we present H5, which is the last hypothesis tested. As all the activities of the
business model should impact the Value Proposition, this one should therefore, positively
influence Business Performance. It is what Table 9 shows, demonstrating statistically that the
BBR, Braz. Bus. Rev. (Engl. ed., Online),
Vitória, v.14, n.1, Art. 4, p. 59-85, jan.-feb. 2017 www.bbronline.com.br
Table 9 – Hypotheses Test between the Value Proposition Construct and Performance
Independent
Variable Dependent Variable Estimated S.E. C.R. P Hypothesis Status
PS_PV DES 0.300 0.083 3.603 0.001*** H5 A
Notes:*p≤0.10; **p≤0.05; ***p≤0.01; A=Hypothesis not Rejected; R= Hypothesis Rejected.
4.4 DISCUSSION OF RESULTS
We verified in the hypotheses testing that the Organizational Readiness, Pressure from
Stakeholders, Management Positioning and Relative Advantage, in this order of importance
directly influence the Value Proposition of e-business activities. In practice, it implies stating
that the company must: (i) prepare itself internally to implement these activities; (ii) map how
stakeholders (customers and suppliers) influence the purchase of its products and services;
(iii) have a management that is positioned in favor of the use of Internet/e-business
technology in their management processes and finally, (iv) use technologies that are safe and
easy to use. The correct combination of the practice of these activities is to be able to promote
a Value Proposition that is unique and difficult to copy. In the theoretical and research aspect,
the results are interesting as they contribute to the prevailing notion that this field of research
is in its infancy and there are still gaps to be explored, especially with regard to the
understanding of non-compliance of the constructs Compatibility, Complexity, Pressure from
Competitors and Government Support. The great challenge is to find out if there are other
antecedents that may impact the Value Proposition.
In the Business Model, we found that the Relationship with the Customer, Capabilities,
Revenue Model, Market Segmentation and Partnerships, in this order of importance, directly
influence the Value Proposition. The Relationship with the Customer had the highest CR
(5.061), which means that this construct is the one with the greatest impact in the Value
Proposition. That is, in addition to the technological expertise necessary to create, develop
and maintain e-business activities, relationship continues to be valued and the automation of
business processes cannot replace it completely. The human element will continue being
present and has significant impact.
Capabilities was the construct that presented the second highest CR (2.481), these are
directly associated with the proper use of tangible and intangible resources present in the
company, thus presenting a close relationship with the RBV (BARNEY, 1991).
In e-business activities, many businesses are characterized by the diversity of revenue
sources. In addition to the traditional ones, received through the sale of goods and services,
BBR, Braz. Bus. Rev. (Engl. ed., Online),
Vitória, v.14, n.1, Art. 4, p. 59-85, jan.-feb. 2017 www.bbronline.com.br
itself does not define how a company creates value in its entirety, but how revenue is
appropriated by the company. Having a revenue model itself does not define the business
model of a company, although it is an important component of a business model (DASILVA;
TRKMAN, 2014).
Market Segmentation also seems important for the formation of the Value Proposition,
because it will direct the company to its target audience and will allow consumers to
experience it.
Partnerships, in a coherent manner with the current context of interaction and constant
sharing of information, are presented as relevant for Value Proposition. It is this rich and
extensive relationship network provided by the Internet, and more specifically, through social
media, the basis of partnerships of modern organizations. Knowing how to choose and
maintain the right partnerships is an important element to induce and maintain Value
Proposition.
Distribution channels and cost structure showed no significant relationship with the
value proposition. This result deserves to be analyzed in greater depth, particularly with
regard to distribution channels, because some authors consider the Internet to be a distribution
channel (HONGSHUANG; LI; KANNAN, 2014).
Finally, the last hypothesis to be tested checks the influence of the Value Proposition on
Business Performance, which ended up being confirmed. This result is important in that it can
contribute to the acceptance of a new performance measurement logic. It is very common that
managers measure their performance only analyzing financial data, i.e., the end, without
properly understanding the means, that is, how the management process was performed. The
results, however, suggest that to achieve a satisfactory performance companies need, first, to
achieve a unique and differentiated value proposition.
5 FINAL CONSIDERATIONS
This study aimed to examine the influence of strategic antecedents and the elements that
constitute the business model in its value proposition and only then, the relationship between
the value proposition and performance of e-business companies. To this end, we identified
and validated a scale for measuring the strategic antecedent and business model and
elaborated a structural model to verify the relationship between the constructs of the strategic
BBR, Braz. Bus. Rev. (Engl. ed., Online),
Vitória, v.14, n.1, Art. 4, p. 59-85, jan.-feb. 2017 www.bbronline.com.br
Albeit this study not being a new research, its results present as a contribution to the
literature on e-business a validated scale for strategic antecedents. Furthermore, the
theoretical-conceptual model applied allowed a methodological approach for these types of
businesses, based on structural equation modeling to verify the relationship between the
constructs. It presents, in this regard, the contribution in seeking to simplify strategic
relationships developed in e-businesses, by using a mathematical model.
Of the eighteen hypotheses, sixteen were tested and ten were confirmed. Two
hypotheses were not tested due to changes in the constructs of Strategic Antecedents and
Business Models in the statistical stage. The study’s initial proposal contemplates the use of
seventy variables in the model, however, after the steps of scales validation and the
re-specification of the structural model, eleven variables were excluded, with fifty-nine (59)
being kept in the final measurement model.
This first study made evident that the Value Proposition is influenced by the Strategic
Antecedent, specifically Management Positioning and Organizational Readiness, comprised
in the Organizational Context. Therefore, the positive attitude of upper management
associated with the organizational preparation, influences the Value Proposition. Regarding
the Technology Context, only Relative Advantage influences Value Proposition. It is inferred,
therefore, that a technological advantage compared to other companies also impacts positively
on the Value Proposition. With regard to the Environmental Context, Pressure from
Stakeholders, comprised in customers and the suppliers, positively influences the Value
Proposition, but this did not occur with the pressure from Competitors and Governments
support, which do seem to be relevant to the Value Proposition. We concluded that,
managerially, the aspects related to the context of the internal dynamics of e-business
companies are more important to influence the Value Proposition than the external aspects,
that do not depend exclusively on companies concrete actions.
In the analysis relating to the Business Model, out of the seven hypotheses tested, five
were significant, thus partially confirming this theory. Only Distribution Channels and Cost
Structure have shown not to influence the Value Proposition. Customer Relationship was the
construct with the highest CR and the only one with significance level at 0.99, i.e., it is the
one with the most influence on the Value Proposition. The managerial implications of these
results indicate that, in order of importance, Relationship with the Customer, Capabilities,
BBR, Braz. Bus. Rev. (Engl. ed., Online),
Vitória, v.14, n.1, Art. 4, p. 59-85, jan.-feb. 2017 www.bbronline.com.br
The last hypothesis tested verifies whether Value Proposition influences e-businesses’
Business Performance. This hypothesis was also confirmed. Therefore, managing elements of
the Strategic Antecedents and Business Models that presented a significant relationship with
the Value Proposition lead to a superior performance.
Although this study has contributed to theoretical and empirical levels, there are some
limitations that need to be reported. The first refers to the sample, which was taken
predominantly in the city of Fortaleza/CE. The use of the electronic questionnaire was
intended to achieve responses from other states, however, this strategy was not effective
because of subjects’ resistance, resulting in less than 10% of the observations collected.
These limitations undermine the generalization of the study results, including
hypothesis testing, for what we suggest expanding the research to different states in Brazil as
a strategy for getting generalizable results.
The second limitation relates to the hypothesis not confirmed in the research. It is
evident that the model proposed in this study must undergo reformulations, in order to
increase assertiveness in understanding the operation of Internet/e-business activities.
We suggest, for future investigations, that adjustment be made to the scales in this
study, aimed at strengthening its explanatory power, in addition to replicating this study in
other states of Brazil, comparing between the perception of corporate professionals in states
considered more and less developed, comparison between data collected in Brazil and in other
developing countries and/or developed countries.
Methodologically, we suggest the use of other statistical techniques such as MANOVA,
Discriminant Analysis and Logistic Regression. Thus, one can understand what led to
rejection of some the hypotheses in this study. Complementarily, one can also incorporate
moderating and mediating variables into the model, such as culture, activity sector, company
size and time length in the market.
In terms of management, the findings of this research may guide managers to base their
decisions. The managerial practice shows that the Canvas tool, conceptual basis of the
business model used in this article, is used without proper knowledge of its elements and the
impact it causes the Value Proposition.
Under the academic aspect, this work contributes by empirically proving that there is a
relationship between some elements of Strategic Antecedents with the Value Proposition, as
BBR, Braz. Bus. Rev. (Engl. ed., Online),
Vitória, v.14, n.1, Art. 4, p. 59-85, jan.-feb. 2017 www.bbronline.com.br validated, and at last, the study’s main contribution, which is, the Value Proposition
influences the performance of e-business companies.
CONTRIBUTIONS BY THE AUTHORS
Elnivan Moreira de Souza: the article and result of the research that realized as part of
his dissertative work.
Paulo César de Sousa Batista contributed to the construction of the model and the
development of the work, as part of the orientation of the first author in his dissertative work.
REFERENCES
ALMEIDA, F. E. B. et al. Organizational capabilities, strategic orientation, strategy formulation quality, strategy implementation and organizational performance in Brazilian textile industries. In: ENCONTRO DA ASSOCIAÇÃO NACIONAL DOS PROGRAMAS DE PÓS-GRADUAÇÃO EM ADMINISTRAÇÃO (ENANPAD), 37., 2013, Rio de Janeiro (RJ). Anais... Rio de Janeiro: ANPAD, 2013.
ARAÚJO, J. B.; ZILBER, S. N. Adoção de E-business e mudanças no modelo de negócios: inovação organizacional em pequenas empresas dos setores de comércio e serviços. Gestão &
Produção, v. 20, n. 1, p. 147-163, 2013.
BABBIE, E. Métodos de pesquisas de survey. Belo Horizonte: Ed. UFMG, 2001.
BARNEY, J. B. Firm resources and sustained competitive advantage. Journal of
Management, v. 17, n. 1, p. 99-120, 1991.
BORDONABA-JUSTE, V.; LUCIA-PALACIOS, L.; POLO-REDONDO, Y. Antecedents and consequences of e-business adoption for European retailers. Internet Research, v. 22, n. 5, p. 532-550, 2012.
BRITO, L. A. L.; VASCONCELOS, F. C. A heterogeneidade do desempenho, suas causas e o conceito de vantagem competitiva: proposta de uma métrica. Revista de Administração
Contemporânea, Ed. Especial, p. 107-129, 2004.
BYRNE, B. M. Structural equation modeling with AMOS: basic concepts, applications and programming. 2. ed. New York: Taylor & Francis Group, 2010.
CHAKRAVARTY, A.; KUMAR, A.; GREWAL, R. Customer orientation structure for internet-based business-to-business platform firms. Journal of Marketing, v. 78, p. 1-23, sep. 2014.
CHASTON, I; MANGLES, T. E-commerce in small US manufacturing firms: a pilot study on internal competencies. Journal of Marketing Management, v. 18, p 341-360, 2002.