5
RBGN
Received on 07/10/2013 Approved on 04/15/2016
Responsible editor: Prof. Dr. Guilherme Farias Shiraishi
Evaluation process: Double Blind Review
Review of Business Management
DOI: 10.7819/rbgn.v18i59.1701
Influence of customer value orientation,
brand value, and business ethics level on
organizational performance
Leslier Maureen Valenzuela Fernández
University of Chile, Faculty of Economics and Business, Department of Business Administration, Santiago, Chile
Francisco Javier Villegas Pinuer
University of Chile, Management Development Unit, Santiago, Chile
Abstract
Purpose – Customer value orientation, brand value and business ethics are critical variables to developing long-term relationships with customers and achieve sustainable sales growth over time. his research shows how the degree of orientation to customer value by the sales forces, brand value and business ethical standards could signiicantly inluence organizational performance.
Design/methodology/approach – The study contributes to an
explanatory model through a structural equation model (SEM) and empirical evidence of research applied to 327 executives – occupying medium and high positions in several companies in Chile – who manage their business globally.
Findings – he results support the hypothesis that customer value
orientation, brand value and business ethics inluence organizational performance.
Originality/value – his research shows how the degree of orientation to customer value by the sales forces, brand value and business ethical standards could signiicantly inluence organizational performance in a country like Chile.
1
Introduction
Studies support that Market Orientation and Customer Value help companies achieve sustainable sales growth over time (Álvarez, Santos, & Vásquez, 2005; Jaramillo & Grisafe, 2009; Kirca, Jayachandran, & Bearden, 2005; Kumar & Petersen, 2005; Macintosh, 2007). his could be true, since companies establish policies and practices to discover the needs of customers and anticipate their requirements, further assisting them in their purchasing decisions so that they perceive greater value in the exchange. herefore, companies should direct their marketing and sales eforts to increase the perceived value of their products, services and brands. It is crucial for the survival and growth of their businesses to provide consumers with solutions that ofer them greater beneits (Saxe & Weitz, 1982), often waiving results in the short term in exchange for ensuring long-term rewards such as customer loyalty (Kelly, 1992).
hanks to the constant contact that sales forces maintain with consumers, many believe that they can inluence a company’s performance (Cross, Brashear, Rigdon, & Bellenger, 2007), not only obtaining monetary beneits, but also increased customer satisfaction, loyalty, retention and positive word of mouth (Hennig-hurau, 2004; Huang, 2008). herefore, it is impossible to ignore the strong potential of an interpersonal level relationship obtained within a company (Macintosh, 2007). In many cases, the sales force is the company’s “public face”, responsible for communicating its philosophy and orientation (Schwepker & Good, 2004), enhancing its ability to respond and generate information, essential aspects to increase the degree of orientation to customer value by the sales force (Miralles, 2002).
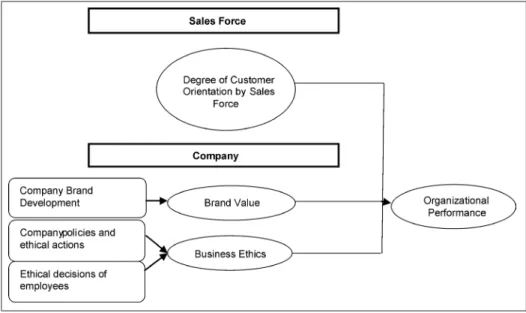
The objectives of this research are as follows: to provide a comprehensive review of literature; to design a descriptive model that connects the series of reliable latent variables (1) Degree of Customer Value Orientation by the Sales Force DCVOSF (2) Brand Value (BV) and (3) Business Ethics (BE) with Organizational
Performance (OP) (See in Appendix A Figure 1: Proposed Model). Moreover, to ofer empirical evidence based on a questionnaire answered by 327 executives – occupying medium to high responsibility positions in various companies in Chile – who manage their businesses globally. Mostly, these executives belong to companies which have a large impact on the country’s economic and social development.
2
heoretical background
From the perspective of the consumer or customer, value represents compensation (trade-of) of relevant components that are given and received. Both components, giving and receiving, respectively imply sacriices and beneits and include a range of diferent attributes that are both monetary and non-monetary (Zeithaml, 1988); therefore, value is an important antecedent to satisfaction, to repeat purchases, and to positive word of mouth references (Palmatier, Scheer, Houston, Evans, & Gopalakrishna, 2007).
From the point of view of the company, customer value is understood as the real value a customer gives a company in terms of revenue (low) and the time during which the client is associated with the company (Reichheld & Teal, 1996). To measure customer value in a concrete way, both individually and globally from the customer base, two types of essential metric studies have been used: Customer Lifetime Value (CLV) and Customer Equity (CE) (Gupta et al., 2006; Hogan, Lemon & Rust, 2002; Reinartz & Kumar, 2003; Rust, Lemon, & Zeithaml, 2004; Venkatesan & Kumar, 2004).
Management based on customer value can be enhanced by the role of the salesperson, and is able to identify potential customers with greater value and appropriately allocate resources (Kumar & Reinartz, 2006), developing growth strategies (cross selling and up selling) (Gupta & Lehmann, 2003; Kumar, Venkatesan, & Reinartz, 2008) and maintaining long-term relationships (Jaworski & Kohli, 1993).
Some studies have shown how the degree of customer value orientation positively inluences the performance of companies (Vilaginés, 1994; Cross et al., 2007; Harris, Mowen, & Brown, 2005; Jaramillo & Grisaffe, 2009; Kumar, Venkatesan, & Reinartz, 2008). The term Organizational Performance is understood as the efectiveness or degree to which organizational objectives have been achieved (Fuentes, Fuentes & Hurtado Torres, 2002), understanding that organizational effectiveness covers financial and operational performance and objectives of different interest groups (Venkatraman & Ramanujam, 1986).
he degree of orientation that a company has towards its client could depend on its socio-cultural strategic proile concerning performance. Moreover, it can depend on the level of adaptation and proposition of the commercial team in ofering customers innovative solutions, on the degree to which the sales force eiciently manages
resources available to the company in order to ensure proper customer interaction, and on the ability to collect, store and distribute information (Álvarez et al., 2005; Martínez-Villavicencio, 2011; Miralles, 2002). It is crucial to have a team to accompany clients, advise them, listen to their concerns, formulate solutions and seek alternatives for proit in order to increase sales (Hernández, 2009).
herefore, the proposed model highlights the fundamental role of the sales team in managing customer relationships based on value and on good services (see Figure 1). he model is seen from the point of view of the company’s brand value and is a latent variable measured by the brand development of the company. On the other hand, the measurement of business ethics involves two important factors: a) actions and policies of the company for the development of this construct; and b) the internal actions relected in the actions of employees.
From the perspective of salespeople, they must be oriented to the customer as a key element; Siguaw, Brown and Widing (1994) point to a positive relationship between the degree of customer orientation and sales forces’ attitudes towards work. According to Kumar, Jones, Venkatesan and Leone (2011), organizational results (sales, proitability) depend on the degree of customer orientation.
hus, the hypothesis of the study are as follows:
H1: he Degree of Customer Orientation Value by the Sales Force (DCOVSF) signiicantly inluences Organizational Performance (OP).
he second variable of the proposed model is Brand Value (BV), deined as “a name, symbol or design used to identify products or services of one salesperson or group of salespeople and to diferentiate them from competitors’ products” (Fischer & Espejo, 2004, p. 243). he brand is the most valuable asset a company can have, which is why companies make great eforts to add value to their brands, and this can only be achieved if they build a long-term relationship with customers. So, one wonders: what creates a company’s real value?he answer is: its intangible assets, represented by knowledge, experience and expertise. All company intangibles are grouped, and, for the market, brand and value relect how they attach themselves to consumers. According to Ramirez (2004), the value of a brand is related to the prestige the company has created over time, and to what consumers expect from the product or service, where creating a valuable brand is not in advertising too much but making a promise to customers and fulilling it. herefore, a brand is the only protected asset a company has, since the management team can leave it at any time. he company may have facilities everywhere and state of the art technology that can last a very long time. Keller (2008) sets the value of Brand Equity based on the client as the diferential efect that the popularity of the brand generates in customer response to marketing.
Companies understand that incorporating brands as intangible assets in their financial statements strengthens their financial status (García Rodríguez, 1998) – especially when considering acquisitions of companies or transfer of ownership of the brands. Even from an administrative point of view, understanding
and quantifying the value of brands provides a positive impact on the company, estimating the individual value of each of the brands it manages and helping to formulate business strategies. In this sense, the fact that Brand Equity is likely to create value for the company and for clients is somewhat justified by several studies that show the relationship between the dimensions of value and its contribution to the creation of sustainable competitive advantage for the company (Bharadwaj, Varadarajan, & Fahy, 1993). hus, the value of a company’s brand inluences how customers and consumers see it, and, in turn, could inluence organizational performance through positive customer attitudes towards the brand in purchasing situations. he following hypothesis is derived from the study:
H2: The Brand Value (BV) that the company has significantly influences Organizational Performance (OP).
he third relevant variable for managing customer value is Business Ethics (BE). One of the main factors contributing to a culture of business ethics refers to the behavior of the directors and senior executives. In companies where there is an atmosphere of respect for ethical values – achieving objectives without using ethically objectionable means –, greater importance is given to maintaining a culture that pays attention to the “socially correct”. Indeed, Business Ethics is understood as “a relection on business practices which involve the norms and values of individuals, companies and society” (Guillen, 1996, p. 12).
the latter feel that they operate in an extremely ethical way.
Leonidou, Kvasova, Leonidou and Chari (2013) say that the higher customers’ perception of unethical corporate behavior, the lower the consumer conidence, which afects satisfaction and inluences loyalty. herefore, according to Svensson and Wood (2011), the strategies and tactics of an organization could lead to diferent perceptions and beliefs as to their corporate ethical behavior in their market. In addition, Vitell and Paolillo (2004) establish a positive relationship between corporate ethical values, the importance of ethics and social responsibility in achieving organizational goals. Thus, the following hypothesis is proposed:
H3: the level of Business Ethics (BE) a particular organization possesses signiicantly inluences its Organizational Performance (OP).
3
Methodology
3.1
Sample and procedures
The method used for data collection was non-probabilistic by judgment, because the questionnaires were answered by salespeople, sales supervisors, marketing executives and business executives who currently hold positions of medium to high responsibility in companies from Chile. (Companies are mainly from the services ield: inancial, retail and consulting.)
Accordingly, we tested our hypothesis in this sample taking into account that respondents were business executives, sales supervisors and salespeople who know about commercial and human resources managerial practices, as well as service and sales policies and procedures. To obtain this data, the questionnaire was self-administered and of a simple transverse design, using a multichannel strategy: online (262 = 80%) and face to face (65 = 20%). We used the Qualtrics Surveys application to gather online answers from respondents; in previous access to the questionnaire, they were informed about the conidentiality of answers and their academic use. Data was collected between November and December 2011. Statistical analyses were carried out with SPSS and AMOS software version 19.0 for Windows.
Table 1
Research design and sample description
Universe People over 18: Salespeople, sales supervisors, marketing executives and business executives who currently hold positions of medium to high and high responsibility in companies in Chile. (Mainly from the services ield: inancial, retail and consulting)
Geographic Scope Chile
Investigation Design Conclusive - quantitative transversal simple design
Method Self-administered questionnaires, using a multichannel strategy: online (262 = 80%) and face to face (65 = 20%)
Unit Analysis and Sample Characteristics Answers of executives with medium to high positions 79% men and 21% women
Range in age from 25-34 (34.6%) and 35-44 (48.9%) 98% have a college education
50% have occupied their current position for ive or more years Type of Sample Non-probability sampling by judgment
Content Validity of the Scale Based on scales from the literature review, and we applied a pre-test and used a panel of experts to evaluate scale items
Number of Surveys 327 valid surveys
Measurement Date During November and December 2011
3.2
Method for testing hypotheses and
scales
All constructs were measured on a seven-point Likert-type scale ranging from ‘1 = strongly disagree’ to ‘7 = strongly agree’. We used this type of scale because interval scales are suitable for measuring attitudes and perceptions of individuals, and the number 7 is used as the optimum grade. his improves the quality of the gathered information, and reduces respondents’ mental errors. It is also advisable to use scales that include a neutral midpoint versus those which do not. Moreover, the scale used is similar to all concepts in order to facilitate the answers of respondents and avoid errors that lessen the reliability of information – and especially because they work better in obtaining questionnaire information through the website (Mathieson & Doane, 2005).
Content validity was conirmed, since the scales use variables that have been validated by previous empirical research. Moreover, we carried out a depuration process by applying an expert panel made up of well-known business executives and researchers who work closely with the study topic.
Scale unidimensionality was analyzed by Kayser-Meyer-Olkin as greater than 0.6; Bartlett
Sphericity test was less than 0.5; Factor loadings were greater than 0.7; and Alpha Cronbach was greater than 0.7 (Hair, Black, Babin, Anderson, & Tatham, 2006). In order to confirm the deinitive reliability of each measurement scale, we applied the Compound Reliability of Construct. Furthermore, convergent validity was evaluated through standardized lambda coefficients for each latent variable. All the variables obtained a standardized regression coeicient greater than 0.50, with a signiicance level of 95% to guarantee the convergence of the measurement model (Hair et al., 2006) (see Appendix A). For discriminating validity, the average variance extracted (AVE) test was used as a good way to measure that the dimensions have their own entity and that their contents do not overlap the contents of the remaining dimensions (Fornell & Larcker, 1981).
conirm the existence of the efects posed on a theoretical level. For this technique, data is used and the responses to the questionnaire are developed to measure the variables raised; through the iteration of regressions, the quantiication of different relationships among variables is obtained.
Next, the Model Structural Equation (SEM) – deined as a set of multiple regression and factor analysis models for estimating direct and indirect efects between factors (Cupani, 2012) – is performed. Its use in this study it is
to determine the signiicance of the relationship between the variables, thus raising the hypotheses. he measurement of diferent variables based on a model that was robust in its level content and parsimonious in relation to the number of variables needed to explain the phenomenon was considered in the questionnaire. The questionnaire used in this study was made up of 29 questions measuring four constructs. he distribution of the structure of the questionnaire was as presented in Table 2.
Table 2
Questionnaire dimensions
Constructs Items
Degree of Customer Value Orientation by the Sales Force (DCVOSF) 8
Business Ethics (BE) 8
Brand Value (BV) 6
Organizational Performance (OP) 7
While the values of GFI, NFI, TLI, IFI and CFI rates are lower than 0.9 (See Appendix B) for the proposed sales management model – below ideal –, the values obtained are acceptable according to Hair et al. (2006). his occurred because this model is as yet in an exploratory stage in which we seek to prove the existence of relationships, i.e. this proposal is a spurious model. Moreover, the sample size is small when compared to the amount of variables and parameters. On the other hand, the sample used in the model was gathered across the industry – and, therefore, since it does not belong to a speciic sector, also does not hinder generalizing conclusions regarding results.
4
Analysis of results and discussion
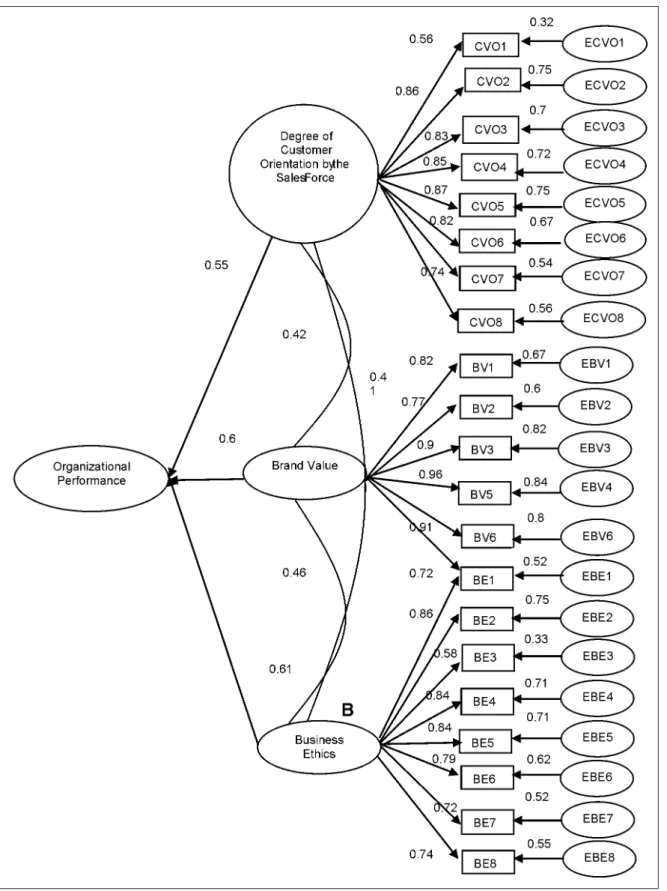
he construct corresponding to Degree of Customer Value Orientation by Sales Force
Figure 2. Degree of Customer Orientation by the Sales Force
In the igure above, the loadings of each item in the variable are measured through CFA. Items selected from the scrubbing process with Exploratory Factor Analysis (EFA) and positively loaded over 0.5 in the respective variable are observed; the latent variable degree of customer focus by the sales force has an impact greater than 0.4 on organizational outcomes, which is important for measurements.
As to Brand Value, a uniied construct is presented with factor loadings that are above 0.8.
Figure 3. Brand Value.
In the figure above, the loadings of each item in the variable are measured through CFA. Items selected from the scrubbing process with EFA and positively loaded over 0.5 in the respective variable, plus the latent variable degree of customer focus by the sales force, have an impact greater than 0.4 on organizational outcomes, which is important for measurements.
Regarding Business Ethics, factor loadings are over 0.6. he construct measures how the organization is in ethical terms, as well as its
policies and actions. In the analysis of each item, the item regarding whether the employee is involved in ethical problems has a lower load factor, which can be explained, and points to an organizational issue concerning staff. Statistically, the construct has a high level of reliability (0.909) and, on the other hand, a high inluence on organizational performance (0.63); thus, it is relevant for measuring organizational performance (see Appendix A and Figure 4)
In the igure above, the loadings of each item in the variable are measured through CFA. Items selected from the scrubbing process with Exploratory Factor Analysis (EFA) are positively loaded over 0.5 in the respective variable; the latent variable degree of customer focus by the sales force has an impact greater than 0.4 on organizational outcomes, which is important for measurements.
Given the above, after analyzing each variable individually and its impact on organizational performance, there is a positive measurement (about 0.6), denoting signiicant measurement variable.
Analyzing the pattern as a whole, the impact of the variables is still highly positive (over 0.5) and shows slight modiications due to the impact where the most important variable is the decrease in DCVOSF (0.55). he relationships between variables shows that the covariance between variables is over 0.4, with existing variances between variables (see Figure 5).
In the igure above, the loadings of each item in the variable are measured through CF; the level variables Degree of Customer Orientation by the Sales Force, Brand Value and Business Ethics present loads of over 0.5 due to Organizational Performance, showing the influence of these variables on measuring OP.
AFC results are satisfactory, since the standardized normalization factor of all loads was greater than 0.7 and signiicant in α = 0.01. In addition, absolute it rates, incremental and parsimony are satisfactory for all constructs and sub models used in the proposed model (Appendix B). his allowed us to determine the association between the model variables, conirming all the hypotheses of the study – considering that this proposal model is an exploratory and initial model for the measurement of these variables in the Chilean market, and is relevant with adjustment measures for strengthening and improving relationships.
his study corroborates the relationships proposed in the model. Regarding the variable “Degree of Customer Value Orientation by the
Sales Force,” the results state that it could improve organizational performance; thus, H1 is veriied. herefore, it is crucial to increase the value of the customer base, working at a strategic and tactical level to improve the level of job satisfaction, since, thus, customers’ commitment to the organization tends to be higher. his is relected in employees as better disposition, better sales management and better quality of services delivered to customers, inluencing organizational outcomes positively and signiicantly. he permanent contact the sales team has with customers could improve loyalty and customer satisfaction, providing a positive word of mouth (Hennig-Thurau, 2004, Huang, 2008), as well as develop growth strategies for customers in a more efective manner (Gupta & Lehmann, 2003), with a positive impact on the organizational performance of a company (Cross et al., 2007, Kumar et al., 2008). Thus, it is increasingly necessary to change the paradigm roles that a sales team should perform, and to stop ignoring the strong potential Salesperson-consumer relationship for a company (Macintosh, 2007).
(negative word of mouth discredits the brand), opting for competition. As a result, companies must manage their brand well and generate customer-centered strategies to increase their
brand value (Karadeniz, 2010). In this regard, it is pertinent to ask about what matters most to a company: its proits or developing its brand?
Whatever the answer, one thing is certain: if a company does not value its brand, it runs the risk of depreciating its value, and its sales could fall dramatically in this highly competitive environment; in this way, its balance igures could drop (Sicard, 2012). he brand is sometimes considered the company’s irst asset by inancial analysts and auditors, but, since it is a complex and fragile asset that is permanently evolving, it can likewise drop. Therefore, the brand is a heritage that must give value and must be taken into account, because without this vision the consequences are also quantifiable. They are measured in loss of consumer interest, but especially in lost revenues for the company. In the end, the brand itself is destined to disappear if it is not taken care of. Brand loyalty awakens the consumer to a subjective universe, created from a concept that relects values.
5
Conclusions
Attracting, capturing, satisfying, maintaining, developing, retaining and capitalizing customers is an increasingly complex task in a dynamic global context where technological development has made the life cycle of products shorter and has intensiied competition; moreover, customers demand more information through various available media (Internet, blogs, social networks, etc.). Consequently, the sales team is critical in achieving these objectives, since it has the most contact and interaction with customers. his research is a pioneering contribution, since it studies the inluence of relevant variables such as the degree of customer value orientation by the sales force, brand value and business ethics on organizational performance. hus, the study contributes to the theory of marketing and sales, and provides empirical evidence for business services, which have a high impact on the economic and social development of society, especially in developing countries such as Chile.
Similarly, business ethics generates positive or negative perceptions among customers. he actions taken by the company will also have an efect on competitors, suppliers and customers
directly. he Case of La Polar, a company in the retail sector in Chile, is a recent example of trust being broken; it experienced a drop in sales levels and generated a halo efect on other commercial institutions (Polizzi, 2011).
In business terms, facing a vast range of products and services, customers seem to be in control – especially considering that most of the data collected for this research was from companies dedicated to the service sector. hus, it is relevant not only to establish relationships with customers, but also to monitor their maintenance and capitalization over time in order to achieve better organizational performance. Anticipating market conditions is also related to the degree of customer orientation by the sales force, since the sales team has a level of training and policy incentives and will have better working conditions to keep track of customers and be able to ofer a higher value than competitors. Finally, the thoroughness and the proper handling of information can be related to business ethics at the time of collecting and using the information, and if the projected image by the organization is remembered and recognized as positive for consumers, brand value will be enhanced.
Another aspect not considered is the influence of time on the results of simple crosscutting. hus, one cannot see the efects of the implementation of the model over time, nor include changes caused by the external and internal environment. While this study has been applied to various economic sectors of services, the model does not consider the diferences in size, sales methodology, nor the number of employees or hierarchical development across companies. In addition, the differences in the products ofered by companies are not considered, so the challenge is to consider the efect of this model in various industries, for comparative analysis. Moreover, to study how relationships inluence models with greater relevance in organizational performance as well as explore other possible positive relationships such as entrepreneurial orientation and organizational performance level (Etchebarne, Geldres, & Garcia-Cruz, 2010).
Finally, the scope of the study is national; research identifying situations or conditions similar to the ones in Chile would help increase the validity of the model and appropriate adjustments to be made according to new considerations arising from its application.
References
Aaker, J. L. (1997). Dimensions of brand personality. Journal of marketing research, 43(3), 347-356.
Álvarez, G., Santos, V., & Vásquez, C. (2005). Escalas de medida del concepto de orientación al mercado: Revisión crítica de su contenido y de sus propiedades psicométricas. ESIC Market, (120), 121-202.
Bharadwaj, S. G., Varadarajan, P. R., & Fahy, J. (1993). Sustainable competitive advantage in service industries: A conceptual model and research propositions. he Journal of Marketing, 57(4), 83-99.
Blattberg, R. C., Getz, G., & Thomas, J. S. (2001). Customer equity: Building and managing
relationships as valuable assets. Boston: Harvard Business Press.
Brakus, J. J., Schmitt, B. H., & Zarantonello, L. (2009). Brand experience: What is it? How is it measured? Does it afect loyalty? Journal of marketing, 73(3), 52-68.
Brislin, R. W. (1986). he wording and translation of research instruments. In W. J. Lonner, & J. W. Berry (Eds.), Field methods in cross-cultural research (Chap. 5, pp. 137-164). Beverly Hills: Sage.
Cross, M. E., Brashear, T. G., Rigdon, E. E., & Bellenger, D. N. (2007). Customer orientation and salesperson performance. European Journal of Marketing, 41(7/8), 821-835.
Cupani, M. (2012). Análisis de ecuaciones estructurales: Conceptos, etapas de desarrollo y un ejemplo de aplicación. REVISTA TESIS Facultad de Psicología, 2(1), 186-199.
Etchebarne, M. S., Geldres, V. V., & García-Cruz, R. (2010). El impacto de la orientación emprendedora en el desempeño exportador de la irma. ESIC Market Economic and Business Journal, 137, 165-220.
Fischer, L., & Espejo, J. (2004). Mercadotecnia. Mexico: Mc Graw Hill.
Fornell, C., & Larcker, D. F. (1981). Evaluating structural equation models with unobservable variables and measurement error. Journal of Marketing Research, 18(1), 39-50.
Fuentes, M. D. M. F., & Torres, N. E. H. (2002). Variables críticas en la medición del desempeño en empresas con implantación de la gestión de la calidad total. Investigaciones Europeas de Dirección y Economía de la Empresa, 8(2), 87-102.
Guillén, M. (1996). La ética empresarial: Una aproximación al fenómeno. Cuadernos de Empresa y Humanismo, 58, 3-39.
Gupta, S., & Lehman, D. R. (2003). Customer as assets. Journal of Interactive Marketing,17(1), 9-24.
Gupta, S., Hanssens, D., Hardie, B., Kahn, W., Kumar, V., Lin, . . . & Sriram, S. (2006). Modeling customer lifetime value. Journal or Service Research, 9(2), 139-155.
Hair, J., Black, B. Babin, B., Anderson, R., & Tatham, R. (2006) Multivariate data analysis (6th ed.). Upper Saddle River, NJ: Prentice-Hall.
Harris, E., Mowen, J., & Brown, T. (2005). Re-examining salesperson goal orientations: Personality inluencers, customer orientation, and work satisfaction. Journal of the Academy of Marketing Science, 33(1), 19-35.
Hennig-Thurau, T. (2004). Customer orientation of service employees: Its impact on customer satisfaction, commitment, and retention. International Journal of Service Industry Management, 15(5), 460-478.
Hernández, R. (2009). Marketing viral y construcción de marca. Marketing y Ventas, 242, 58-65.
Hogan, J. E., Lemon, K., & Libai, B. (2003). What is the true value of a lost customer? Journal of Service Research, 5(3), 196-208.
Hogan, J., Lemon, K., & Rust, R. (2002). Customer equity management: Charting new directions for the future of marketing. Journal of Service Research, 5(1), 4-12.
Howe, V., Hofman, K. D., & Hardigree, D. W. (1994). he relationship between ethical and customer-oriented service provider behavior. Journal of Business Ethics, 13(7), 497-506.
Huang, M. (2008). The influence of selling behaviors on customer relationship in inancial
services. International Journal of Service Industry Management, 19(4), 458-173.
Jaramillo, F., & Grissafe, D. B. (2009). Examining the impact of servant leadership on salesperson’s turnover intention. Journal of Personal Selling and Sales Management, 29(4), 351-365.
Jaworski, B. J., & Kohli, A. K. Market orientation: Antecedents and consequences”, Journal of Marketing,57(3), 53-70.
Karadeniz, M. (2002). The importance of customer based strategic brand equity management for enterprises. Journal of Naval Science and Engineering, 6(2), 117-132.
Keller, K. L. (2008). Administración estratégica de marca branding. Mexico: Pearson Educación.
Kelly, S. W. (1992). Developing customer orientation among service employees. Journal of Academy of Marketing Service, 20(1), 27-36.
Kirca, A. H., Jayachandran, S., & Bearden, W. O. (2005). Market orientation: A meta-analytic review and assessment of its antecedents and impact on performance. Journal of Marketing, 69(2), 24-41.
Kumar, V., & George, M. (2007). Measuring and maximizing customer equity: A critical analysis. Journal of the Academy of Marketing Science, 35(2), 157-171.
Kumar, V., Jones, E., Venkatesan, R., & Leone, R. P. (2011). Is market orientation a source of sustainable competitive advantage or simply the cost of competing? Journal of Marketing, 75(1), 16-30.
Kumar, V., Lemon, K. N., & Parasuraman, A. (2006). Managing customers for value an overview and research agenda. Journal of Service Research, 9(2), 87-94.
empirical evidence. Journal of the Academy of Marketing Science, 33(4), 504-519.
Kumar, V., & Reinartz, J. (2006). Customer relationship management: A Databased approach. Hoboken, NJ: John Wiley & Sons.
Kumar, V., Venkatesan, R., & Reinartz, W. (2008). Performance implications of adopting a customer-focused sales campaign. Journal of Marketing, 72(5), 50-68.
Leonidou, L. C., Kvasova, O., Leonidou, C. N., & Chari, S. (2013). Business unethicality as an impediment to consumer trust: The moderating role of demographic and cultural characteristics. Journal of Business Ethics, 112(3), 397-415.
Macintosh, G. (2007). Customer orientation, relationship quality, and relational beneits to the irm. Journal of Services Marketing, 21(3), 150-159.
Martinez-Villavicencio, J. (2011). Factores que inciden en el desempeño exportador de las Pymes: Una aplicación empírica. ESIC Market Economics and Business Journal, 140, 211-233.
Mathieson, K., & Doane, D. (2005). Using ine-grained likert scales in web surveys. Alliance Journal of Business Research, 1(1), 27-34.
Miralles, L. (2002). ¿Está su empresa realmente orientada al cliente? Harvard Deusto Márketing y Ventas, 52, 14-23.
Niraj, R., Gupta, M., & Narasimhan, C. (2001). Customer proitability in a supply chain. Journal of Marketing, 65(3), 1-16.
Palmatier, R. W., Scheer, L. K., Houston, M. B., Evans, K. R., & Gopalakrishna, S. (2007). Use of relationship marketing programs in building customer–salesperson and customer– firm relationships: Differential influences on financial outcomes. International Journal of Research in Marketing, 24(3), 210-223.
Polizzi, P. (Ed.) (2011). Chilescopio 2011: Hacia dónde van los consumidores Chilenos. Chile: Visión Humana. Retrieved from http://pt.slideshare.net/ visionhumana/presentacin-evento-chilescopio-2011-visin-humana
Ramirez, K. (2004). Ganan empresas con valor de marca. Retrieved from http://www.es.catholic. net/op/articulos/46765/cat/417/ganan-empresas-con-valor-de-marca.html.
Reichheld, F. F., & Teal, T. (1996). he loyalty efect: he hidden force behind growth, proits, and lasting value. Boston: Harvard Business School Press.
Reinartz, W. J., & Kumar, V. (2003). The impact of customer relationship characteristics on profitable lifetime duration. Journal of Marketing, 67(1), 77-99.
Rust, R. T., Lemon, K. N., & Zeithaml, V. A. (2004). Return on marketing: Using customer equity to focus marketing strategy. Journal of Marketing, 68(1), 109-127.
Saxe, R., & Weitz, B. A. (1982). he SOCO scale: A measure of the customer orientation of salespeople. Journal of Marketing Research, 19(3), 343-351.
Schwepker, C. H., & Good, D. J. (2004). Marketing control and sales force customer orientation. Journal of Personal Selling & Sales Management, 24(3), 167-179.
Sicard, J. (2012). Protección de marca: Cómo defenderla ante las falsiicaciones. MK: Marketing+ ventas, 280, 18.
Siguaw, J. A., Brown, G., & Widing, R. E. (1994). he inluence of the market orientation of the irm on sales force behavior and attitudes. Journal of Marketing Research, 31(1), 106-116.
Svensson, G., & Wood, G. (2010). ́tica empresarial teleológica: Formativa, racionalista y transformativa–ilustraciones y analogías. ESIC Market, 138, 63-90.
Valenzuela, L. M., Mulki, J. P., & Jaramillo, J. F. (2010). Impact of customer orientation, inducements and ethics on loyalty to the irm: Customers’ perspective. Journal of Business Ethics, 93(2), 277-291.
Valenzuela, L., Torres, E., Hidalgo, P., & Farías, P. (2014). Salesperson CLV orientation’s efect on performance. Journal of Business Research, 67(4), 550-557.
Venkatraman, N., & Ramanujam, V. (1986). Measurement of business performance in strategy research: A comparison of approaches. Academy of Management Review, 11(4), 801-814.
Venkatesan, R., & Kumar, V. (2004). A customer lifetime value framework for customer selection and resource allocation strategy. Journal of Marketing, 68(4), 106-125.
Vilaginés, J. A. (1994). Marketing relacional: Cómo obtener clientes leales y rentables. Barcelona: Gestión 2000.
Vitell, S. J., & Paolillo, J. G. (2004). A cross‐
cultural study of the antecedents of the perceived role of ethics and social responsibility. Business Ethics: A European Review, 13(2‐3), 185-199.
Appendix A – Scale unidimensionality, validity and reliability
Latent Variables Item Description Load Cronbach
Coeicient KMO R R2
CUSTOMER VALUE ORIENTATION Based on Santos, Vásquez and Álvarez, 2002: Valenzuela, 2005; Reinartz, 2004; Valenzuela ,2007; Valenzuela ,2010; Kohli and Jaworski, 1990.
CVO15: includes after-sales services to meet customers’ needs.
CVO16: frequently communicates with customers. CVO17: takes cares of generating long-term relationships with customers.
CVO18: allows customers to make suggestions regarding products and / or services delivered. CVO19: systematically analyses product or service attributes that customers value most.
CVO20: constantly analyses information it collects about customers (satisfaction, preference, loyalty). CVO21: reaches its goals when customers achieve theirs.
CVO22: constantly collects information on consumer tastes. .718 .861 .823 .816 .855 .823 .730 .767 .918 .906 0.58 0.86 0.8 0.81 0.86 0.81 0.71 0.79 0.34 0.74 0.64 0.66 0.74 0.66 0.5 0.62 BUSINESS ETHICS Based on Rizzo, House and Litzman, 1970; Grisafe and Jaramillo, 2007; Sullivan, 2009; Jaramillo, Mulki and Valenzuela, 2009.
BE23: the company is a highly ethical organization. BE24: employees do not engage in anti-ethical behavior.
BE25: employees make decisions based on a set of shared values.
BE26: senior oicials of the company perform actions in pursuit of the common good and not personal gain.
BE27: employees perform actions in pursuit of the common good and not personal gain.
BE28: the company has incentive policies that respect ethical values.
BE29: he company has promotion policies (discounts, gifts, etc.) that respect ethical values. BE30: the ethics of my company generates better organizational results. .861 .596 .846 .837 .776 .742 .756 .830 .908 .910 0.85 0.6 0.83 0.83 0.77 0.68 0.7 0.75 0.72 0.36 0.69 0.69 0.59 0.46 0.49 0.55 BRAND VALUE Based on Olavarrieta, 2002; Brakus, Schmitt and Zarantonello, 2009; Aaker, 1997.
BV31: the brand is a sign of top quality product or service.
BV32: the brand allows it to increase price levels. BV33: brand elements (name, logo, slogan, character) facilitate the sales process.
BV34: improving brand predisposition to purchase products or services.
BV35: the brand increases repeat purchases. BV36: the brand can deliver better organizational results. .812 .822 .900 .943 .920 .899 .942 .905 0.71 0.76 0.89 0.95 0.91 0.88 0.5 0.58 0.79 0.9 0.83 0.77 ORGANIZATIONAL PERFORMANCE Niraj, Gupta and
Narasimhan, 2001; Hogan, Lemonand Libai, 2003; Sullivan, 2009, Olavarrieta, 2002; Kumar and George, 2007;
Valenzuela, Torres, Hidalgo and Farias, 2014.
OP66: the company provides incentives to collaborate with improved organizational performance
OP67: training allow an improved organizational performance
OP68: the ethics of the business generates improved organizational performance
OP69: the brand enables better organizational performance
OP70: motivated employees achieve better organizational results.
OP71: employees know that their work has a direct inluence on the results of the company.
OP72: employees with more experience in sales help better organizational results to be achieved.
Appendix B – Conirmatory factor analysis
Sales management model
Type of Adjustment Adjustment Measurement Results
Absolute Adjustment X2 (sig.) GFI
922,3 (9) sig. *** 0.797
Incremental Adjustment NFI /TLI IFI / CFI
0.831/0.865 0.865/0.864
Parsimony PNFI 0.692
Construct Reliability Composite Reliability Rates 0.71
Degree of customer orientation value by the sales force
Type of Adjustment Adjustment Measurement Results of CFA
Absolute Adjustment XGFI 2 (sig.) 526.378 (9) sig. ***0.813
Incremental Adjustment NFI /TLIIFI / CFI 0.854/0.8630.838/0.876
Parsimony PNFI 0.772
Construct Reliability Composite Reliability Rates 0.72
Business Ethics Level
Type of Adjustment Adjustment Measurement Results of CFA
Absolute Adjustment XGFI 2 (sig.) 222,666 (2) sig. ,1710.865
Incremental Adjustment NFI /TLIIFI / CFI 0.877/0.8640,891/0.891
Parsimony PNFI 0.706
Construct Reliability Composite Reliability Rates 0,73
Brand Value
Type of Adjustment Adjustment Measurement Results of CFA
Absolute Adjustment XGFI 2 (sig.) 129,341 (18) sig. ,000.905
Incremental Adjustment NFI /TLIIFI / CFI 0.932/0.9140.937/0.937
Parsimony PNFI 0.683
Supporting Agencies:
Project FONDECYT Nº 11100163 Year 2010-2012.
About the authors:
1. Leslier Maureen Valenzuela Fernández, PhD in Marketing, Complutense University of Madrid, Spain. E-mail: [email protected]
Contribution of each authors:
Contribution Leslier Valenzuela Francisco Villegas
1. Deinition of research problem √ √
2. Development of hypotheses or research questions (empirical studies) √
3. Development of theoretical propositions (theoretical Work)
4. heoretical foundation/Literature review √ √
5. Deinition of methodological procedures √ √
6. Data collection √ √
7. Statistical analysis √
8. Analysis and interpretation of data √ √
9. Critical revision of the manuscript √ √
10. Manuscript Writing √ √