Received on 06/29/2015; Reviewed on 09/22/2015; Accepted on 11/30/2015; Divulgued on 11/01/2016.
*Author for correspondence:
†. Master.
Vínculo: Universidade
Federal de Minas Gerais .
Endereço: Av. Antônio Carlos, 6627, Pampulha, Belo Horizonte – MG - Brazil. Cep. 31270-901.
E-mail:
joaoestevaobarbosaneto@gm ail.com
Doctor.
Vínculo: Universidade Federal
de Minas Gerais. Endereço: Antônio Carlos Avenue, 6627, Pampulha, Belo Horizonte – MG - Brazil. Cep. 31270-901.
E-mail: [email protected]
¥ Doctor.
Vínculo: Universidade Federal de Minas Gerais.
Endereço: Antônio Carlos Avenue, 6627, Pampulha, Belo Horizonte – MG - Brazil. Cep. 31270-901.
E-mail: [email protected]
± Doctor.
Vínculo: Universidade Federal de Alfenas.
Endereço: Rua Gabriel Monteiro da Silva, 700
Centro - Alfenas/MG. CEP: 37130-000.
E-mail: [email protected]
Note from the Editor: This paper was accepted by Bruno Felix.
This article has a Creative Commons License - Attribution 3.0 Not Adapted.
231
Social Capital and Selectivity in Academic Co-Authorship Networks
: the
Case of Accounting Sciences in Brazil
João Estevão Barbosa Neto †
Federal University of Minas Gerais - UFMG
Silvio Segundo Salej HigginsΩ
Federal University of Minas Gerais - UFMG
Jacqueline Veneroso Alves da Cunha ¥
Federal University of Minas Gerais - UFMG
Antônio Carlos Ribeiro ±
Federal University of Alfenas - UNIFAL
ABSTRACT
Social capital has been mobilized as an explanatory variable in various empirical studies, but these studies have been unable to overcome the ambiguities inherent in a pre-scientific notion. The present study tests structural autonomy, one of the two established hypotheses on social capital, from the point of view of social network analysis. The test is applied in a case study of the academic co-authorship networks of accounting science programs in Brazil during the period from 2002-2010. The dynamics of selectivity present in this specific network, i.e., criteria of intertemporal choice, institutional endogamy and mutual choice by productivity,
were also analyzed. We observed that there were negative correlations between the authors’
constraints and their academic productivity indices, cascading intertemporal choices and endogamous choices according to institutional and productivity criteria.
BBR, Braz. Bus. Rev. (Engl. ed., Online),
Vitória, v. 13, n. 6, Art. 4, p. 231 - 259, nov-dec. 2016 www.bbronline.com.br
1 INTRODUCTION
he conceptual elaboration of social capital is undoubtedly the most important
export from sociology from the past thirty years. James Samuel Coleman
(1988, 1992, 1994) and Pierre Bourdieu (1980) contributed decisively to the
scientific dissemination of this concept, although they were attempting to
clarify different matters. Coleman (1988) was concerned with what he regarded
as the fundamental problem of contemporary asymmetric societies – the lack of
solidarity between individuals occupying pre-established positions in large
organizations designed by human will. He appealed to what he regarded as the
imperative of the rational reconstruction of society or to the discovery of looser forms of
social organization in which rational individuals would find incentives to forge lasting social
ties. Bourdieu (1980), for his part, undertook the critical task of preventing the expansion of
the concept of capital to non-economic spheres of social life. He argued that sociology would
be able to identify mechanisms in which inequality was socially reproduced that were
invisible when economists focused on the academic world, armed with the concept of human
capital. For Bourdieu (1980), there are other forms of capital – cultural, symbolic and social –
that feed into each another and thus contribute to the reproduction of social domination.
The representation of social capital has remained, for many years, with an ambiguous
notion that is commonly used, despite the theoretical and methodological efforts of Coleman
(1988, 1992, 1994) and Bourdieu (1980). Empirical studies in various fields illustrate many
situations in which social capital is mobilized as an explanatory variable, but these studies
have been unable to overcome the ambiguities inherent in a pre-scientific notion. For
example, Coleman (1988) studied the problem of school dropout and operationalized social
capital in terms of family cohesion, identifying it empirically in the dense interactions
between parents and children for the purpose of school learning. In this pioneering study, the
central hypothesis was that a high level of social capital, both intra- and inter-family, would
have a positive impact on children remaining in school. However, certain ambiguities remain
in Coleman (1988)'s study and are embodied in the following questions: Can the collective
and relational resource called social capital be appropriated by individuals? How can we
discern what corresponds to the agent and what corresponds to the structure? In the twentieth
chapter of Foundations of Social Theory (1994), Coleman posits that social capital may be
taken as a public good that may be built or destroyed by the by-products of an individual's
BBR, Braz. Bus. Rev. (Engl. ed., Online),
Vitória, v. 13, n. 6, Art. 4, p. 231 - 259, nov-dec. 2016 www.bbronline.com.br Instead, he simply hypothesizes that a dense structure of relationships among adults would be
the source of a social capital that would have a positive impact on the academic performance
of children (Coleman, 1988). This line of thinking requires a more rigorous analysis to
differentiate the social problems to which the concept of social capital is applied from the
theoretical and methodological perspectives with which social capital becomes operative.
2 ANALYTICAL FRAMEWORK FOR DIFFERENTIATING STUDIES ON SOCIAL CAPITAL
Much of the ambiguity and confusion in the implementation and operationalization of
social capital results from a failure to distinguish between minimalist and maximalist social
actions (OSTROM; AHN, 2003). While the former focuses on the strategic investment that is
undertaken by individuals in the construction of social relationships, the latter focuses on the
social mechanisms that enable dilemmas of collective action to be resolved (OLSON, 1989).
The table below shows several pure types of social capital and summarizes the
methodological strategies used to study them:
Regression models are used to measure the impact of associative participation of individuals on their income level (NEVES; HELAL, 2007) or to measure the impact of
parent-child relationships on academic
performance (COLEMAN, 1988).
Investigations regarding either the structural autonomy of actors, structural holes and brokers (BURT, 2005) or regarding the mobilization of resources and emotional support by individuals embedded in social networks (LIN, 2005).
World Values Survey (INGLEHART 2008). Correlations between variables of civic community (PUTNAM, 1996). Barometers of social capital (SUDARSKY 2001).
The call by Ostrom and Ahn (2003) to
construct theories of second-generation
rationality and collective action. Studies on conversion of the relational capital of actors in
lateral social control in collegiate
organizations (LAZEGA, 2001, 2003). Table 1 - Methodological typologies of social capital
Source: Salej Higgins (2012).
Coleman (1988)’s work on intra-family social capital are placed in the upper left quadrant because parents are making an investment in dense social relationships for the
academic success of their children. To test his hypothesis, Coleman (1988) used logistic
regression models. The reference studies on civic associations conducted by Putnam (1996)
and his followers (SUDARSKY, 2001) are placed in the lower left quadrant because their
studies sought to explain the engagement of citizens in solving common problems and to
unravel the horizontal mechanisms of overcoming dilemmas of collective action. We place
methodological advances in understanding the operation of horizontal participation Sociometric studies
BBR, Braz. Bus. Rev. (Engl. ed., Online),
Vitória, v. 13, n. 6, Art. 4, p. 231 - 259, nov-dec. 2016 www.bbronline.com.br mechanisms in the lower right quadrant; these studies include those of Lazega (1998, 2001)
that applied social network analysis to the domain of knowledge-intensive collegiate
organizations to unravel the interaction processes that are important to organizational
cohesion and efficiency.
The issue being analyzed in the present study is located in the upper right quadrant of
this table. Several studies have been made that may be included in this quadrant. Lin (2005)
researched how individuals can mobilize advantages, resources and emotional support from
their networks of relationships. Ronald Burt (1995, 2000, 2005) went further in his research
and identified the types of relational structures that facilitate an individual’s undertaking of
strategic action to gain some benefit – in particular, access to useful information. Burt
developed the following three operational concepts: (a) structural autonomy, or the degree of
pressure and limitation sustained by an actor with respect to his peers within a network of
relationships; (b) the structural hole, or the low-density relational sector in which an actor is
in the position of obtaining non-redundant information; and (c) the position occupied by a
broker or actor that is a bridge between two denser sectors within a social network that
enables the actor to obtain richer and more privileged information in advance or to stop
information flows that are not convenient for him/her.
3 THE TWO HYPOTHESES OF SOCIAL CAPITAL
From the standpoint of neo-structural sociology (LAZEGA, 1998) – better known as
network analysis – the fundamental insights of Bourdieu (1980) and Coleman (1988) were
operationalized in the form of two well-established hypotheses (BURT, 1999; GODECHOT;
MARIOT, 2004). First hypothesis: closed, stable and dense relational structures operate as a
resource that facilitates the creation of social norms and interpersonal trust and the circulation
of information, which is consistent with the hypothesis of density or closure postulated by
Coleman (1988). A cohesive group will perform better in intergroup competition.
BBR, Braz. Bus. Rev. (Engl. ed., Online),
Vitória, v. 13, n. 6, Art. 4, p. 231 - 259, nov-dec. 2016 www.bbronline.com.br Suppose the graph above represents the exchange system of a popular market. Network
density means that any opportunistic action in node 1, such as paying with a bad check, is
quickly known by node 7. The diversity of relational paths from 1 through 2, 4 and 3
facilitates social control of opportunism.
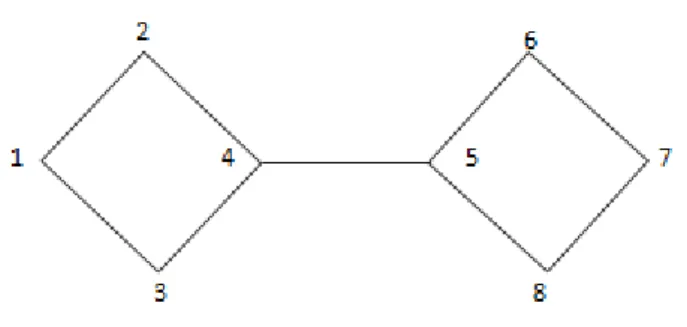
Second hypothesis: open, diverse and porous structural relationships facilitate
individual gain, according to the structural hole hypothesis postulated by Burt (1999). This
hypothesis works based on the axiom that dense networks with redundant and strong ties
degenerate information (GRANOVETTER, 1973).
Figure 2 - Structural hole hypothesis Source: Klovdahl's graph (1992).
Suppose the graph above represents the type of situation studied by Burt (1999), i.e., the
complete network of friendship between managers of a large company. Node 5 (or broker 5)
will be in a position to keep non-redundant information to himself/herself if useful
information leaves the left sector of the network. Burt's analyses complement the fundamental
finding of Granovetter (1973) regarding the strength of social ties. Weak ties are bridges,
inter-network through which circulate not degenerate information. While Burt analyzes the
lead within the structure, Granovetter (1973) describes the type of relationship.
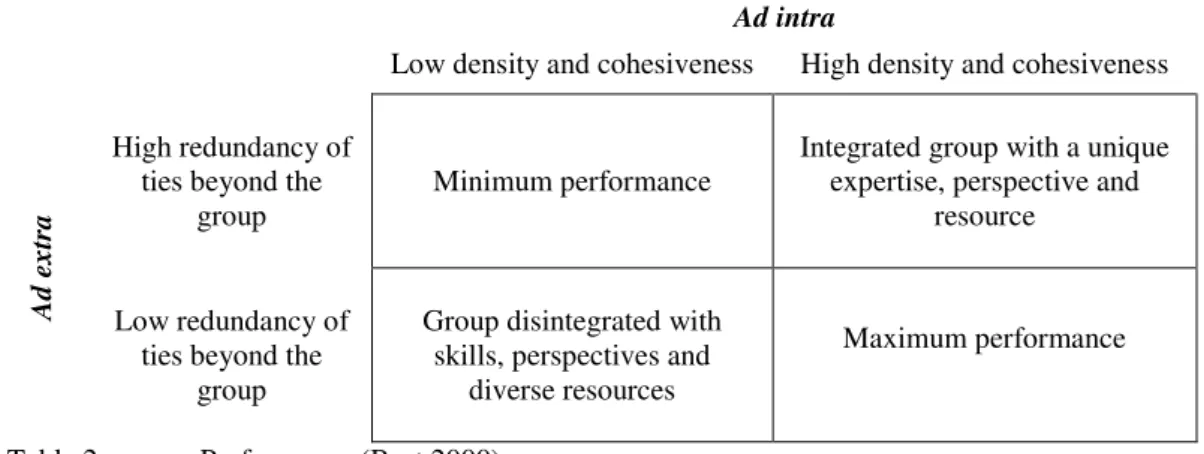
The two types of network structures, corresponding to each hypothesis, are not
necessarily mutually exclusive. They can work both ad intra and ad extra of a group structure.
BBR, Braz. Bus. Rev. (Engl. ed., Online),
Vitória, v. 13, n. 6, Art. 4, p. 231 - 259, nov-dec. 2016 www.bbronline.com.br Ad intra
Low density and cohesiveness High density and cohesiveness
A
d
ex
tra
High redundancy of ties beyond the
group
Minimum performance
Integrated group with a unique expertise, perspective and
resource
Low redundancy of ties beyond the
group
Group disintegrated with skills, perspectives and
diverse resources
Maximum performance
Table 2 - group Performance (Burt 2000).
4 METHODOLOGY
4.1 SOCIAL CAPITAL AND RELATIONAL STRUCTURES IN ACADEMIC LIFE
Godechot and Mariot (2004) reconstructed relational structures in doctoral education in
French political science between 1990 and 2001. They analyzed the academic collaboration
network between supervisors for the entire period of their study using the structure of the
examination panel of the thesis. Their relational data is evidence of the effect of collegiate
decision-making structures on academic careers. Godechot and Mariot (2004) tested the
following general hypothesis with a relational universe of 741 doctoral dissertations:
The probability of the PhD student getting a job (y) is a function of the position of the
director and committee members in the relational structure (x).
For the empirical test, Godechot and Mariot (2004) modeled the causal relationship
through a logistic regression. In addition to the definitions of the descriptive variables that
their data enabled (gender, nationality, degree-granting institution, sub-discipline of political
science, etc.), we are interested in the explanatory variables of the relational structure. In the
logistic model, the directors' and guests' network volumes (average number of contacts) and
the C factor (or Burt's (2001) constraint) are disaggregated.
The calculation of C is performed in three stages. The number of contacts of i related to
j is represented by . Burt initially measures the proportion ( ) of relationships that i
invests in contact q:
The constraint of j on i is then calculated, i.e., the sum of his/her direct and indirect
BBR, Braz. Bus. Rev. (Engl. ed., Online),
Vitória, v. 13, n. 6, Art. 4, p. 231 - 259, nov-dec. 2016 www.bbronline.com.br Finally, the constraint Cthat the network exerts on i is the sum of all c from each of
his/her contacts:
equals 1 when i has a single contact and approaches 0 when i's contacts are numerous
and not very interconnected. However, the C index is much more complex because it
condenses three dimensions of a network structure – density, size and hierarchy. Burt (1995)
believes that the constraint is a function of the following three dimensions:
From the empirical analysis of Burt (1995), may be typified in terms of correlation, how
the dimensions affect the index:
Constraint
Size
Big Small (-)
Small Big (-)
Density Big Big (+)
Small Small (+)
Hierarchy Muita Big (+)
Pouca Small (+)
Table 3 - Correlation between C and its components (Burt 1995).
In sociological terms, a major constraint reduces the alternative contacts through which
an ego may get new and useful information. Thus, highly dense and hierarchical networks
reduce alternativity ties and increase the redundancy of the same.
The present study followed the work of Godechot and Mariot (2004); it used
information from the accounting sciences discipline in Brazil at the post-graduate level. A
network of academic collaboration was constructed from relational co-authorship data. In our
case, we tested the correlation between scientific co-authorship and productivity of faculty
members and also sought to assess the presence of a mechanism acting on the network's
functioning, unlike the French researchers. We took a minimalist approach in the present
study because we were interested in learning how individuals gained advantages in the
BBR, Braz. Bus. Rev. (Engl. ed., Online),
Vitória, v. 13, n. 6, Art. 4, p. 231 - 259, nov-dec. 2016 www.bbronline.com.br 4.2 DATA COLLECTION
The resumes found on the Lattes platform of the National Counsel of Technological and
Scientific Development (Conselho Nacional de Desenvolvimento Científico e Tecnológico -
CNPq) for all faculty members of stricto sensu postgraduate programs in the accounting
sciences in Brazil were analyzed. We decided to use the entire population because it made the
analysis of complete networks possible. However, it is noteworthy that one of the limitations
of the data collection using the Lattes platform is that the platform relies on the researchers
themselves to keep the information current. Thus, to minimize problems with updates, all
resumes were downloaded on the same date: 12/30/2010. In addition, only resumes that had
been updated up to 12/31/2009 were included in the present study; professors who had not
changed their data by that date were not included in the database.
Another factor that must be considered when using a Lattes resume is the accuracy of its
information because such information is the sole responsibility of the person who entered it.
This may encourage the reliability of the data because the Lattes resume represents the
professional, academic and scientific profile of the faculty member, and it is therefore in that
person’s interest that the information is reliable and well evidenced. The time span covered by our study was nine years (2002-2010). We constructed a database of articles published in
scientific journals in the field of accounting sciences.
A description of the data collection and processing stages is shown in Table 4.
Data sources Procedures
Stage 1 Survey of the faculty body.
Analysis of the number and affiliations of faculty members connected with the studied programs.
Stage 2
Compilation of data extracted from the faculty members' resumes contained in the
CNPq Lattes database.
Organization of the positional elements of individuals whose characteristics were analyzed.
Stage 3 Profile of programs and faculty body.
Analysis of characteristics collected in the previous stage to define academic and scientific profiles of both the programs and the faculty members who were the objects of the analysis.
Stage 4 Cooperation networks between faculty
members of the programs. Analysis of network morphology .
Stage 5
Analysis of the dynamics of the construction of scientific knowledge in the field of accounting sciences.
Interpretation of the information collected in the previous stages.
Table 4 - Data collection and processing stages
We used Microsoft Excel ® 2007, Ucinet 6.0 (BORGATTI; EVERETT; FREEMAN, 2005) and Pajek (DE NOOY; MRVAR; BATAGELJ, 2011) for data analysis. Microsoft
BBR, Braz. Bus. Rev. (Engl. ed., Online),
Vitória, v. 13, n. 6, Art. 4, p. 231 - 259, nov-dec. 2016 www.bbronline.com.br into Ucinet 6.0. The latter was used in the assembly and calculation of the structure of social
networks formed by faculty members of stricto sensu post-graduate programs in accounting
sciences. Pajek was used in the preparation of sociograms.
4.3.1 Data obtained - the faculty body
Initially, we collected the number and names of members who comprise the faculty
bodies of all the stricto sensu post-graduate programs in accounting sciences in Brazil by
visiting the websites of such programs. At this stage, 253 faculty members were identified
with three belonging to two programs. In those three cases, the faculty members were deemed
affiliated with the programs in which they were part of the permanent faculty body. Thus, 250
faculty members were considered from 18 stricto sensu post-graduate programs in accounting
sciences in Brazil.
Next, we conducted a search for the resumes of these faculty members on the CNPq
website. Information was found for all 250 faculty members, but the analysis was performed
with information from only 241 of those faculty members because nine faculty members had
not updated their resumes by the established cutoff date.
4.3.2 Co-authorship
Certain problems regarding the dates of the articles were considered. The first issue
concerned the year of inception of the program to which the faculty member belonged; only
articles that were published after the creation of the master or doctoral program in the
applicable institution were collected.
The second issue referred to the individual's inclusion in the faculty body of the program
(or programs) to which he/she was affiliated during the study period. Thus, data collection
initiated at this stage of the study considered only the scientific and academic output of the
faculty member after his/her entry onto a stricto sensu postgraduate program in accounting
sciences.
In certain cases, faculty members migrated from one program to another in the three
sub-periods analyzed (2002-2004, 2005-2007 and 2008-2010). When this occurred, the faculty
member was considered to belong to the program in which he/she was included in the
sub-period analyzed. When a faculty member changed programs in the middle of a three-year
period (for example, if a faculty member migrated between 2002 and 2004), he/she was
sub-BBR, Braz. Bus. Rev. (Engl. ed., Online),
Vitória, v. 13, n. 6, Art. 4, p. 231 - 259, nov-dec. 2016 www.bbronline.com.br period. Table 5 shows an example of how were tabulated articles according to the date of
emergence program and the teaching of the binding date to this course of master's or doctorate.
Teacher 2002-2004 2005-2007 2008-2010
MATINEZ, A. L. It was not linked to any
program.
2006-2007: Linked to Master UFBA
2008-2010: Linked
to the master's and
doctorate from
FUCAPE
In this case, the scientific and academic activities that teachers were considered the UFBA program in 2006 and 2007; and from 2008 to 2010 FUCAPE.
Table 5 - Example article that entered the study according to the date of emergence program and teaching of the binding date.
From these assumptions were collected via Lattes platform of the National Council for
Scientific and Technological Development (CNPq), all articles published by faculty. repeated
studies were excluded. It is noteworthy that in some cases there were discrepancies regarding
the authors of the articles, that is, not a teaching curriculum were certain authors and other
curriculum contained different teachers, for the same item. In this case, we tried to the article
via the Internet and proceeded to the verification of the authors in their work.
From that moment it was found that there were still items that contained teachers who
might not be in the search. As an example, an article coauthored between Geez, V. and
Dalmácio, FZ, 2002, in which the second author only began to participate in a strict graduate
program sensu in Accounting in 2009. In this case, Dalmácio, FZ it was removed from the
article.
As the study aims to analyze the relationship between programs, only items with two or
more teaching programs as co-authors were part of the sample. For example, an article that
has three authors, and only one of them is teaching some stricto graduate program sensu in
Accounting, was not included in the survey. The example explained above serves as a basis to
explain this Question choice of items entered in the search. After removal of Dalmatius, F. Z.,
the article was written only with the Our V. and therefore, it was removed from the analysis.
After all the steps and composition of the sample articles criteria, came to the total of
455 that would be part of Social Network Analysis formed by the stricto sensu graduate
programs in accounting between 2002 and 2010. Table 6 summarizes the stages of collection
BBR, Braz. Bus. Rev. (Engl. ed., Online),
Vitória, v. 13, n. 6, Art. 4, p. 231 - 259, nov-dec. 2016 www.bbronline.com.br
Stage Description Final number of
articles
1st Collection of all articles, including repeated articles. 3442
2nd Elimination of duplicate articles. 2890
3rd Elimination of articles according to the criteria program inception
date and entry of faculty members. 2132
4th Elimination of articles that were not authored by two or more
faculty members. 455
Table 6 - Description of co-authorship collection stages
4.3.3 Measuring productivity
After developing the co-authorship database, individual productivity was calculated for
each faculty member. For this purpose, the qualis system of the Coordination of Improvement
of Higher Education Personnel (Coordenação de Aperfeiçoamento de Pessoal de Nível
Superior - CAPES-BRAZIL) was used. CAPES is the body of the Brazilian Ministry of
Education (Ministério da Educação) that regulates postgraduate programs. For each area of
knowledge, the CAPES system classifies and assigns a category to the different scientific
journals in which Brazilian researchers are published. Table 7 summarizes the scientific
journals classification.
Table 7 - Qualis Classification of Journals in the Field of Accounting Sciences CAPES - Brazil -2010
Qualis journal Score Weighting factor (%)
A1 100 28.57
A2 80 22.86
B1 60 17.14
B2 50 14.29
B3 30 8.57
B4 20 5.71
B5 10 2.86
C 0 0
A standardized total productivity score was generated using the abovementioned
criteria1.
1
BBR, Braz. Bus. Rev. (Engl. ed., Online),
Vitória, v. 13, n. 6, Art. 4, p. 231 - 259, nov-dec. 2016 www.bbronline.com.br
5 OVERVIEW OF ACCOUNTING SCIENCES IN BRAZIL
In Brazil, the scientific field of accounting is at an early stage, but we have observed a
significant evolution of programs in accounting education and research that has contributed to
the development of scientific knowledge and increased information exchanges between
researchers. According to Leite Filho (2008), this development is because of a significant
increase in the number of stricto sensu postgraduate programs (masters and doctorate) in
accounting with a consequent growth in accounting science output.
Peleias et al. (2007) note that the emergence of these stricto sensu programs has
contributed to an increase in research and scientific output in accounting sciences in Brazil
and has consequently enhanced the presence of accounting studies at important Brazilian and
international scientific events. Another advantage of the development of postgraduate
programs in accounting has been the creation of specific events, such as the USP Conference
on Controllership and Accounting (2000), the increased number of accounting studies
published in journals and the creation of the National Association of Postgraduate Programs
in Accounting (Associação Nacional dos Programas de Pós-Graduação em Contabilidade -
ANPCONT) in 2006. All these factors contribute to the scientific development of accounting
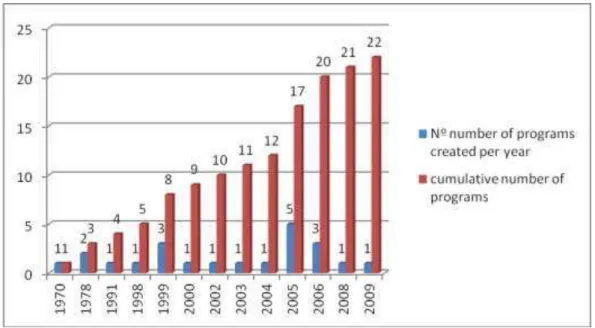
sciences. Figure 3 shows the evolution of the number of stricto sensu programs in Brazil.
Figure 3 - Progression of the number of stricto sensu programs in Brazil
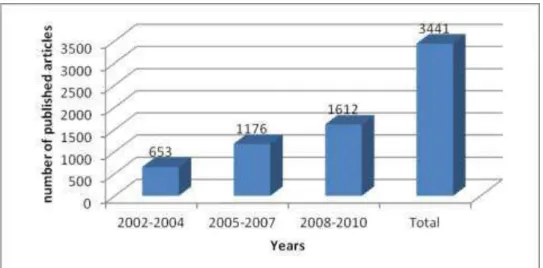
With respect to the scientific output – specifically, the publication of articles in journals
– by the faculty of accounting sciences programs, it was found that faculty members' participation in this type of work grew significantly in Brazil over the period analyzed, as
shown in Figure 4. It should be emphasized that all articles published by faculty members
BBR, Braz. Bus. Rev. (Engl. ed., Online),
Vitória, v. 13, n. 6, Art. 4, p. 231 - 259, nov-dec. 2016 www.bbronline.com.br the year in which they were published (with 2002 as the first year) or whether the work was
co-authored with another faculty member.
Figure 4 - Publication of articles by faculty members of stricto sensu postgraduate programs in
accounting sciences in Brazil
From the first three-year period to the second three-year period, faculty members’
participation in scientific articles increased by 80%, which coincided with the period of
creation of seven Masters programs of accounting sciences in Brazil. Thus, it appears that the
creation of the postgraduate programs stimulated scientific output in accounting and increased
scientific cooperation through increased collaborations between faculty members, students
and other researchers affiliated with the postgraduate programs. We evaluated the evolution of
the number of authors per article from 2002 to 2010 (Figure 5).
Figure 5 - Progression of the number of authors per article from 2002 to 2010
The number of articles with only one author decreased over the years. In the first period,
31% of the articles were produced by a single author. In the third period, between 2008 and
2010, only 7% of the articles had single authorship. Articles with two authors predominated in
BBR, Braz. Bus. Rev. (Engl. ed., Online),
Vitória, v. 13, n. 6, Art. 4, p. 231 - 259, nov-dec. 2016 www.bbronline.com.br period of the years analyzed, i.e., studies with two or more researchers increased, indicating
that scientific collaboration is increasingly preferred by researchers over time.
These findings contrast with those of Cardoso et al. (2005), who analyzed the articles in
the field of accounting sciences between 1990 and 2003 and found that only 41.66% of the
articles were written by two researchers; most articles were written by one author (46.67%)
during that period. Taken with the sample in this study, it appears that throughout the years,
researchers in the field have become increasingly willing to collaborate when conducting
scientific studies. Furthermore, the findings in our study corroborate the results of Cruz
(2010), who aimed to identify the attributes of scientific output in the research field of
management accounting in the triennium period from 2007-2009. Cruz (2010) research found
that 92% of studies were prepared using a collaborative approach by analyzing 90 articles in
the management field. The data show that co-authorship has become an important strategy in
Brazilian accounting sciences. This finding reinforces the importance of understanding the
mode of operation of the social network formed from this type of academic relationship.
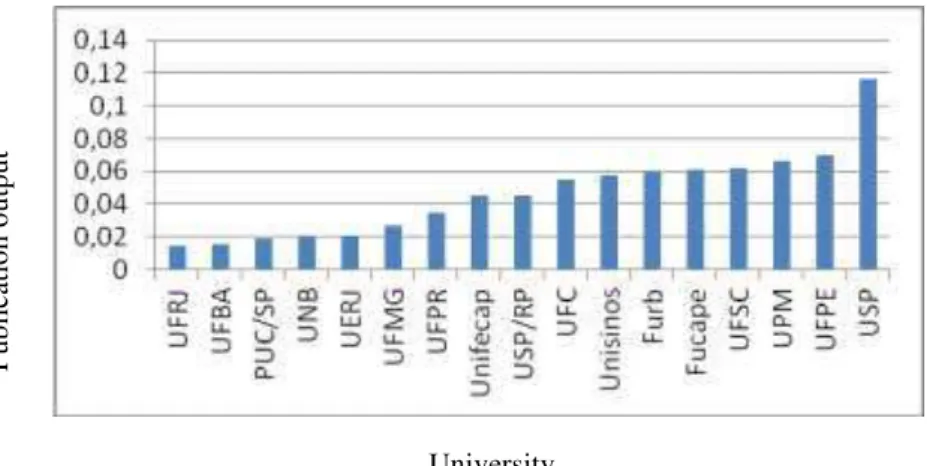
Figure 6 - Output in co-authorship by university in the period 2002-2010
6 STUDY HYPOTHESIS
The data show an academic context favorable to scientific output in the field of
accounting in Brazil. However, despite the favorable scenario, it may yet be observed that
certain actors perform better than others when the output of faculty members of postgraduate
programs in accounting sciences is compared. How is this difference explained?
From a minimalist point of view, social capital is an essential explanatory factor. More
productive individuals exploit their position – specifically, their structural autonomy – within
the relational universe (BURT, 2000). This morphological property of the network constitutes
an advantage that permits greater ownership of the resources in circulation. Thus, we might
expect that the most productive authors in the field of Brazilian accounting sciences would University
Pu
b
licatio
n
o
u
tp
u
BBR, Braz. Bus. Rev. (Engl. ed., Online),
Vitória, v. 13, n. 6, Art. 4, p. 231 - 259, nov-dec. 2016 www.bbronline.com.br have a directly proportional relationship to their degree of structural autonomy within the
network; the more productive authors will have lower C constraint factors within the network.
Concretely, this means that the author at the edge of a structural hole may access more and
better information that will encourage greater scientific productivity.
In the next section, we will analyze the structure of co-authorship relationships that has
developed in the field of accounting sciences in Brazil.
7 THE SCIENTIFIC CO-AUTHORSHIP NETWORK IN ACCOUNTING SCIENCES IN BRAZIL
Table 8 shows descriptive statistics for the structures of relationships among the authors
of articles published in co-authorship and their evolution during the analyzed period. Such
information provides a better understanding of the development of the field and its
relationships.
Table 8 - Descriptive Statistics of the Relational Structure of Co-Authored Articles
2002-2010
Number of authors 176
Ties observed 311
Average number of ties per author 3.56
Degree of concentration of centrality (Degree) 6.04
Density 2.02%
Mean distance 5.18
Maximum distance (Diameter) 15
Clustering coefficient 0.39
Source: Study results
Table 5 shows that the analyzed network comprises 176 faculty members. Among these
faculty members, 311 authorship ties were observed out of a potential total of 15,400
authorship ties. The ties indicate that two authors published at least one article in
co-authorship – our study did not assign values to such relationships. Instead, we considered
them as binary, i.e., as publishing in partnership or not, disregarding the number of repeated
collaborations. On average, actors in the network exhibit 3.56 ties, which indicates good
cohesion in the network and confirms that collaboration as a strategy in the production of an
article is a characteristic of the studied field. The degree of concentration of centrality is
6.04%, which indicates that the structure of the network is not strongly hierarchical and that
no author stands out as being central. The centrality of authors in the network varies between
1 and 14 collaborative ties. Of the 176 faculty members identified, 48 faculty members
BBR, Braz. Bus. Rev. (Engl. ed., Online),
Vitória, v. 13, n. 6, Art. 4, p. 231 - 259, nov-dec. 2016 www.bbronline.com.br contribute to the balance of power in the mapped universe. Figure 7 shows the structure of the
Co-authorship Network mapped for publications in accounting sciences in Brazil from 2002
to 2010.
Figure 7 - Graph of co-authorship among faculty members of stricto sensu postgraduate programs in accounting
sciences from 2002-2010 (Brazil) Source: Study results
8 RESULTS OF THE ANALYSIS OF STRUCTURAL AUTONOMY
After calculating the scientific output for the entire 2002-2010 period, the structural
autonomy (C factor) of each author in the co-authorship network was calculated2. The
distribution of the two variables may be observed in the respective histograms. The opposite
trend is suggested in the data distribution.
2
C factor analysis for the study case showed that the indicator displayed the expected behavior when correlated with other network dimensions that influenced it. The correlation between network size and constraint was
negative (R2 = 0.78). As for the density and hierarchy variables, these were found to be positively correlated with
BBR, Braz. Bus. Rev. (Engl. ed., Online),
Vitória, v. 13, n. 6, Art. 4, p. 231 - 259, nov-dec. 2016 www.bbronline.com.br Figure 8 - Distribution of output in qualis scores
Figure 9 - Distribution of structural autonomy or C constraint scores
Actors with a low-weighted score obtained the highest output frequencies (Figure 8),
with more than 80% attaining a score that did not exceed a standardized value of 5%.
Conversely, the opposite trend occurs for the structural autonomy index (Figure 9), i.e.,
almost 50% of the members display a value of 1, which is the maximum value possible. High
C index values indicate low structural autonomy. The authors refer to nodes in positions that
offer little chance to exploit the circulation of resources or information.
The data were found to support Burt's hypothesis when testing the correlation between
output and constraint. The nodes with higher structural autonomy, i.e., those with lower C
values, display higher output values. Figure 10 shows inverse function between the two
variables. A constant (-0.009) and Beta coefficient (0.026) at a 99% significance level was
BBR, Braz. Bus. Rev. (Engl. ed., Online),
Vitória, v. 13, n. 6, Art. 4, p. 231 - 259, nov-dec. 2016 www.bbronline.com.br Figure 10 - Scatterplot of inverse relation between constraint and output
Figure 11 shows a graph with structural autonomy scores represented by point size
(smaller points indicate greater autonomy). The three different time periods in which the
author might have joined the network are shown in different colors. Authors who were on the
network since 2002 and between 2002 and 2004 are indicated with darker points. Those who
joined between 2005 and 2008 are represented in medium gray. Those who entered the
network after 2008 are represented by the lighter points.
BBR, Braz. Bus. Rev. (Engl. ed., Online),
Vitória, v. 13, n. 6, Art. 4, p. 231 - 259, nov-dec. 2016 www.bbronline.com.br The sociogram shows the brokers in the network as smaller points, i.e., nodes with
higher structural autonomy. These faculty members occupy the best positions for taking
advantage of non-redundant information or resources circulating in the network. This
morphological advantage from the point of view of the network structure is associated with
higher productivity, as may be observed in the correlations presented in Figure 11 above. The
graph also suggests that the length of time in the network is a variable that may be associated
with productivity. To assess this trend, a new sociogram in which the size of the points
represents output was developed (Figure 12).
Figure 12 - Co-authorship network - Productivity x length of time in network
When the two representations of the co-authorship network were compared,
productivity appeared to correlate better with the C constraint than with length of time on the
network. It is noteworthy that actors joining after 2005 were as productive as authors who
were on the network since 2002. Thus, the effect of seniority in entering the network appears
smaller than might have been expected. The position of the actor in the network is an
important variable, which is consistent with the Structural Hole theory. For example, actors
156, 17 and 35 joined in 2005 and have low constraintand high productivity. Thus, length of
time in the network may be more relevant simply in explaining the poor performance of new
BBR, Braz. Bus. Rev. (Engl. ed., Online),
Vitória, v. 13, n. 6, Art. 4, p. 231 - 259, nov-dec. 2016 www.bbronline.com.br
9 LONGITUDINAL SELECTIVITY
Although length of time in the network does not appear to be directly correlated with
productivity, the data suggest that seniority may be helpful in explaining the relational
position of authors who only recently joined the network. The entry of such faculty members
into the co-authorship network seems to show a selectivity bias that precludes them from
developing a stock of social capital that they can use to gain structural autonomy in the
mapped universe. Figure 13 shows how the relational patterns in the study case are affected
by length of time in the network.
Figure 13 - Co-authorship network – Co-authorship relationships x length of time in the network
It may be observed that older members sought partnerships primarily with those who
became faculty members between 2005 and 2007. In turn, more recent faculty members –
those who joined the network since 2008 – have developed more relationships with faculty
members who joined since 2005. Based on this hypothesis, we suggest that the network seems
to operate under the pressure of a selectivity mechanism involved in the formation of
partnerships. The length of time in the network seems to generate a relational pattern in which
authors who recently joined the faculty ranks are received by the intermediate group, whereas
the more senior faculty authors prefer to establish relationships with the intermediate group
and, in some cases, select certain new faculty members as partners. Under this logic, faculty
BBR, Braz. Bus. Rev. (Engl. ed., Online),
Vitória, v. 13, n. 6, Art. 4, p. 231 - 259, nov-dec. 2016 www.bbronline.com.br position in the network to select the best partners for achieving high-quality output and to
access non-redundant information.
Considering the findings presented herein, we must determine whether the network's
selectivity bias operates only in relation to length of time in the network or whether there are
other manifestations of the selection mechanism. We must investigate whether there is any
tendency for co-authors to privilege certain relationships within the various programs, and a
homophily analysis was therefore conducted for the study case. The results are presented in
the next section.
10 HOMOPHILIC SELECTIVITY
The analysis of homophily helps to determine whether there was endogamy in the
coauthors' publications, i.e., whether members of the same programs published in partnership.
In general, strong endogamy is seen as a weakness because, on the one hand, it would indicate
homogenized research interests; on the other hand, it would reveal the influence of somewhat
biased and non-meritocratic selection criteria. The analysis of homophily reveals whether
there is a tendency to build authoring ties with nodes that share the same affiliation because
homophily is a criterion that makes relational choices selectively in the co-authorship
network.
We analyzed the selectivity bias that operates in the network through an analysis of
homophily that was based on the length of time in the network and the institutional affiliation
of faculty members. We conducted a specific test, the Relational Contingency Table Analysis
- Directed Networks/Undirected Model, to determine whether faculty members that were
grouped according to length of time in the network tended to develop relationships between
themselves or with members who joined at other times. Furthermore, we sought to determine
whether the relationships among program faculty members have a tendency towards
endogamy or not. The tables below show the test results, which were statistically significant
in both areas. The tendency towards inter- or intra-group relationships is established by values
greater than 1. These values indicate that the relationships observed in the network exceed the
expected number. The diagonal of the table shows the tendency towards intra-group
relationships, whereas an analysis of the rows reveals the relationships between one group and
the others.
The first test in the studied network showed that there is a trend towards homophily
among faculty members who were in the group that dated from the beginning of the period
BBR, Braz. Bus. Rev. (Engl. ed., Online),
Vitória, v. 13, n. 6, Art. 4, p. 231 - 259, nov-dec. 2016 www.bbronline.com.br intermediate group (the 2005 group) was also identified. As expected, the 2002 faculty
members do not show a trend of maintaining relationships with the most recent group. Our
test shows that the 2008 group tends to produce in co-authorship with members of the same
group. With respect to authors who have joined the network since 2005, there is a tendency to
produce work in collaboration with faculty members within the same category, in addition to
a tendency to interact with the more senior faculty members. We believe that this test
reinforces the argument about the selective bias of length of time within the mapped network.
Table 9 - Trends in Relationships Between entry Groups (Year of Entry)
Year of entry
2002 2005 2008
2002 11,17 1,2 0,34
2005 1,2 2,28 0,41
2008 0,34 0,41 1,01
Observed Chi-squared value = 524.410 Significance = 0.000100
Number of iterations = 10000 Source: Study results
The second test performed showed that selectivity in the network also operates from the
dynamic endogamy of the programs. A specific test, the E-Index, was applied to detect
whether intra-institutional relationships were more common than inter-institutional ones in the
studied co-authorship network. The index counts the intra- and inter-group ties then subtracts
the total intra-group ties from the inter-group ones and divides by the total number of ties.
The results range from -1, perfect homophily, and +1, perfect heterophily. The nodes were
grouped into 17 different categories, corresponding to the 17 universities with which the
authors were affiliated.
Table 10 - E-I Index for adjudication of intra-institutional and inter-institutional the network co-authoring (2002-2010)
Obs Min Avg Max SD P ≥ ob P ≤ ob
Internal 0,601 0,019 0,061 0,119 0,013 0 1
External 0,399 0,881 0,939 0,981 0,013 1 0
E-I -0,203 0,762 0,878 0,961 0,027 1 0
Note: E-I Indexis significant p< 0,05 Source: Study results
Table 11 shows that the major co-authorship trends occur between faculty members of
the same program (diagonal vertices of the matrix). However, this trend is not followed by
BBR, Braz. Bus. Rev. (Engl. ed., Online),
Vitória, v. 13, n. 6, Art. 4, p. 231 - 259, nov-dec. 2016 www.bbronline.com.br Table 11 - Trends of Relationships Between Accounting Programs
Fucape Furb PUC/SP UERJ UFBA UFC UFMG UFPE UFPR UFRJ UFSC UNB Unifecap Unisinos UPM USP USP/RP
Fucape 14,99 0 0,37 0 0 0 0 0 0 0,43 0 0,17 0 0 0 1,16 0,47
Furb 0 8,72 0,34 0 0 0 1,19 0 0,53 0 0 0 0 0 0,26 0,48 0,22
PUC/SP 0,37 0,34 2,95 0 0 0 0 0 0 0 0 0,29 2,01 0,49 0,49 0,88 0
UERJ 0,32 0 0 0 0 0 0 1,05 0 0,64 0 0 0,7 0,86 0 0,39 0
UFBA 0 0 0 20,62 20,62 0 0 0 0 0 0 0 0,94 0 0 0,52 0
UFC 0 0 0 0 0 11,1 0,3 0 0 0 0,43 0 0 0,26 0 0,48 0,22
UFMG 0 1,19 0 0 0 0,3 11,04 0 0,86 0 0 0,26 0 0,43 0 0,39 1,41
UFPE 0 0 0 1,05 0 0 0 25,86 0,62 0 0 0 0 0 0 0,42 0
UFPR 0 0,53 0 0 0 0 0,86 0,62 18,9 0,57 0 0 0 0,38 0 0,17 0
UFRJ 0,43 0 0 0,64 0 0 0 0 0,57 8,25 0 0 0,47 0 0 0,52 0
UFSC 0 0 0 0 0 0,43 0 0 0 0 21,37 0,19 0 0 0 0 0
UNB 0,17 0 0,29 0 0 0 0,26 0 0 0 0,19 4,71 0,19 0 0,23 0,62 0,37
Unifecap 0 0 2,01 0,7 0 0 0 0 0 0,47 0 0,19 13,49 0,94 0,62 0,14 0,51
Unisinos 0 0 0,49 0,86 0,26 0,26 0,43 0 0,38 0 0 0 0,94 18,9 0 0,34 0
UPM 0 0,26 0,49 0 0 0 0 0 0 0 0 0,23 0,92 0 22,33 1,55 1,25
USP 1,16 0,48 0,88 0,39 0,48 0,48 0,39 0,42 0,17 0,52 0 0,62 0,14 0,34 1,55 9,44 1,12
USP/RP 0,47 0,22 0 0 0,22 0,22 1,41 0 0 0 0 0,37 0,51 0 1,25 1,12 5,62
Observed Chi-squared value = 5352.436 Significance = 0.000100
Number of iterations = 10000 Source: Study results
Figure 14 shows the trend towards endogamy in the mapped network. Those authors
linked to program 11 are easily distinguished in the top right corner, for example. The
subgroup of program 1 is also distinct on the right side of the figure, as are those of programs
8 and 14 in the lower right corner. Program 6 in the middle lower section and programs 2 and
7 (to the left of program 6) also stand out.
BBR, Braz. Bus. Rev. (Engl. ed., Online),
Vitória, v. 13, n. 6, Art. 4, p. 231 - 259, nov-dec. 2016 www.bbronline.com.br Although faculty members of program 16 have shown a tendency towards internal
relationships, the graph above also shows that they are more scattered over the network,
indicating that these faculty members establish relationships with faculty members from other
institutions. It is plausible that this strategy promotes the productivity of these faculty
members because they have more structural autonomy in the studied field.
11 PROGRAM SELECTIVITY FROM THE STANDPOINT OF COHESIVE SUBGROUPS
Network selectivity that is based on institutional affiliation criteria may be confirmed
from an analysis of the subgroups of cliques n-5 and n-4. Cliques are network subgroups with
densities equal to 100%; therefore, all members in these subgroups have relationships with
each other. A n-5 clique indicates a diameter d = 5, i.e., the maximum geodesic in the
subgroup is formed by five ties. The incorporation of this approach in the present paper aimed
to identify whether the network's more restricted subgroups are formed within programs or
whether they are open to external actors. Is institutional selectivity in its more rigid
manifestation present in the studied network? We expect to find n-4 and n-5 cliques formed
within the postgraduate programs if the response to this question is positive.
Three n-5 subgroups were found (Figure 12). Two of these subgroups were formed
within the same institution (light gray). The third n-5 subgroup displays the same endogamic
tendencies but incorporated an author from another institution. This third clique is within
institution 16 (dark gray), which may explain the incorporation of an external actor; it is most
likely the result of the relational pattern of faculty members in this institution because they
value external and internal ties.
A third attribute was incorporated in the analysis to assess whether output quality
constitutes a third selection bias in the network, in addition to temporal and institutional
selectivities. Good productivity was defined as an actor publishing at least one article in an
A2 journal or 3 articles in a B1 journal. For the representation of cliques, the square shape
was used to represent the highest quality and the circle represented the lowest quality.
Focusing on output quality, we note that the clique of institution 16 involves authors
with publications in high-quality journals. In the cliques of institution 8, publications were
made in journals with a maximum CAPES qualis level of B2. The clique n-5 approach
reinforces the notion of homophily and institutional selectivity in the network. It is notable
that the strongest cliques in the network were formed within two programs. In addition, there
BBR, Braz. Bus. Rev. (Engl. ed., Online),
Vitória, v. 13, n. 6, Art. 4, p. 231 - 259, nov-dec. 2016 www.bbronline.com.br
Figure 15 - Clique n-5 x postgraduate program and output quality
We identified 18 subgroups that met the requirements of n-4 cliques. The structure
shown in Figure 16 provides further evidence of institutional selectivity. As was the case in
the n-5 clique approach, the existence of cliques in certain programs is found. Authors from
institution 8 are highlighted in yellow, those from 11 are light green, those from 1 are dark
blue, those from 13 are purple and those from 15 are light blue. The data show that these
institutions have greater internal cohesion regarding the co-production of articles. Another
aspect that may be highlighted is the relational strategy of the authors of institution 16, which
are highlighted in red. These actors are not only involved in cliques within their program but
they have developed partnerships with faculty members at other institutions. The red actor no.
80 is the main communication gateway of the blue 4-clique with the other cliques. This actor
has high productivity, having co-authored 14 published articles. This privileged position
might be undercut with the emergence of another actor at institution 16 who began to operate
BBR, Braz. Bus. Rev. (Engl. ed., Online),
Vitória, v. 13, n. 6, Art. 4, p. 231 - 259, nov-dec. 2016 www.bbronline.com.br
Figure 16 - n-4 Clique x postgraduate program and output quality
Regarding output quality, the n-4 clique analysis reinforces evidence of the operation of
another selective mechanism in the network; Figure 16 shows that the cliques are composed
of members with similar output quality. The impact of this output selectivity may be observed
through Moran's autocorrelation. A highly significant moderate correlation of 0.548 was
found for the mapped network (Table 12). This finding shows a relatively moderate tendency
for adjacent members to display the same production, which may indicate the presence of a
third form of selectivity in the network – output selectivity.
Table 12 - Autocorrelation of Network Selectivity (2002-2010)
Method Moran
Permutations 1000
Random seed 695
Autocorrelation 0,548
Sgnificance 0
Permutation average -0,005
Standard error 0,057
Proportion as large 0
Proportion as small 1
Note: Larger values indicate positive Source: Study results
12 CONCLUSIONS
In the present study, we were able to confirm the hypothesis of structural autonomy.
The data we analyzed showed that the productivity of faculty members in the co-authorship
network of Brazilian accounting sciences is affected by the position they occupy in the
network. Faculty members with fewer constraints, i.e., at the edges of the structural holes of
BBR, Braz. Bus. Rev. (Engl. ed., Online),
Vitória, v. 13, n. 6, Art. 4, p. 231 - 259, nov-dec. 2016 www.bbronline.com.br In exploring the data, we found that there are several selective mechanisms behind the
relationships in the mapped network, in addition to the advantages of structural autonomy.
We show that there are at least three ways in which the formation of co-authorship
partnerships are affected. First, we identified temporal selectivity that is related to the length
of time that a faculty member has been in the network. We observed that this selective bias
hinders the formation of faculty members' partnerships at the start of their career, i.e., for
those who joined the network since 2008. A tendency to form cascading relationships was
observed in which the youngest members establish relationships with intermediate members
and the intermediate members establish relationships with older members.
Second, we found institutional selectivity. A tendency toward homophily was observed
in the network, which is confirmed by the negative E-index and by the analyses of n-4 and n-5
cliques in the network. We found that actors generally select colleagues in their programs for
co-authorship and that most cliques are formed within the same program.
Finally, output selectivity was identified as the third selective mechanism in the
network. We observed that actors with higher productivity scores tend to be adjacent in the
network, i.e., they tend to establish collaborations with each other.
There are several questions that remain open for further research, analysis and data
development. In particular, two questions stand out. First, how does the co-authorship
relational structure impact the scientific and professional recruitment of young teachers and
researchers? Second, is there correlation between co-authorship and collaborative networks at
the time of an MSc or PhD defense? These two questions require the extension of the
longitudinality of the available data and the development of specific hypotheses regarding the
accumulation of advantages and the building of strategies for scientific-academic career
development. More robust longitudinal data will make SIENA (simulation investigation for
empirical social analysis, SNIJDERS et al. 2007) analysis possible for a more precise
understanding of how selection criteria change in networks of scientific and academic
cooperation.
CONTRIBUTIONS BY THE AUTHORS
João Estevão Barbosa Neto contributed to the construction of the work as a whole, as
well as the literature review, for data collection and data analysis.
Silvio Segundo Salej Higgins contributed to the construction of the work as a whole,
BBR, Braz. Bus. Rev. (Engl. ed., Online),
Vitória, v. 13, n. 6, Art. 4, p. 231 - 259, nov-dec. 2016 www.bbronline.com.br
Jacqueline Veneroso Alves da Cunha contributed to the construction of the work as a
whole, the literature review and data analysis.
Antônio Carlos Ribeiro contributed to the construction of the work as a whole, the
literature review and data analysis.
REFERENCES
BOURDIEU, P. Le capital social: notes provisoires. Actes de la Recherche en Sciences Sociales, v. 31, n. 2-3, 1980.
BORGATTI, S. P.; EVERETT, M. G.; FREEMAN, L. C. Ucinet for Windows: software for social network analysis. Harvard, MA: Analytic Technologies, 2002. Disponível em:
http://www.analytictech.com/ucinet.htm.
BURT, R. Le capital social, les trous structuraux et l’entrepreneur. Revue Française de Sociologie, v. 36, p. 599-628, 1995.
______. The network structure of social capital. Research in Organizational Behaviour, v. 20, p. 345-423, 2000.
______. Structural holes versus network closure as social capital. In: Lin, N.; Cook, K.; Burt R. (Eds.). Social capital: theory and research. New Jersey, NJ: Transaction Publishers, 2005.
CARDOSO, R. L. et al. Pesquisa científica em contabilidade entre 1999 e 2003. Revista de Administração de Empresas – RAE, São Paulo, v. 45, p. 34-45, 2005.
COLEMAN, J. 1988. Social capital in the creation of human capital. American Journal of Sociology, v. 94 (Suplement), p. 95-120, 1988.
______. The rational reconstruction of society. Presidential Address. American Sociological Review, v. 58, p. 1-15, 1992.
______. Foundations of social theory. Harvard University Press, Cambridge, MA, 1994.
CRUZ, A. P. C. Perspectiva colaborativa no campo da contabilidade gerencial: uma análise institucional no triênio 2007-2009. 2010. 168 f. Dissertação (Mestrado em Contabilidade) – Universidade Federal do Paraná (UFPR), Curitiba (PR), 2010.
DE NOOY, W.; MRVAR, A.; BATAGELJ, V. Exploratory social network analysis with Pajek. New York, NY: Cambridge University Press, 2011.
GODECHOT, O.; MARIOT, N. Les deux forms du capital social. Structure relationnelle des jurys de theses et recrutement en science politique. Revue Française de Sociologie, v. 45, p. 243-282, 2004.
GRANOVETTER, M. The strength of weak ties. The American Journal of Sociology, v. 78, p. 1360-1380, 1973.
BBR, Braz. Bus. Rev. (Engl. ed., Online),
Vitória, v. 13, n. 6, Art. 4, p. 231 - 259, nov-dec. 2016 www.bbronline.com.br LAZEGA, E. Réseaux sociaux et structures relationnelles. Paris, PA: PUF, 1998.
______. The collegial phenomenon. The social mechanisms of cooperation among peers in a corporate law partnership. Oxford: University Press, 2001.
______. Rationalité, discipline sociale et structure. Revue Française de Sociologie, v. 44, p. 305-329, 2003.
LIN, N. Building a network theory of social capital. In: LIN, N.; COOK, K.; BURT, R. (Eds.). Social capital: theory and research. New Jersey, NJ: Transaction Publishers, 2005.
LEITE FILHO, G. A. Padrões de produtividade de autores em periódicos e congressos na área da contabilidade no Brasil: um estudo bibliométrico. Revista de Administração
Contemporânea, v. 12, p. 533-554, 2008.
NEVES, J.; HELAL, D. H. Associativismo, capital social e mercado de trabalho. In:
NEUMA, A. (Ed.). Desigualdades sociais, redes de sociabilidade e participação política. Belo Horizonte: Editora da Universidade Federal de Minas Gerais, 2007.
OLSON, M. A lógica da ação coletiva. São Paulo: EDUSP. 1989.
OSTROM, E.; AHN, T. K. Una perspectiva del capital social desde las ciencias sociales: capital social y acción colectiva. Revista Mexicana de Sociología, v. 65, p. 155-233, 2003.
PELEIAS, I. R. et al. Evolução do ensino da contabilidade no Brasil: uma análise histórica.
Revista de Contabilidade e Finanças, v. 18, p. 19-32, 2007.
PUTNAM, R. Comunidade e democracia. Rio de Janeiro, RJ: Editora Fundação Getúlio Vargas, 1996.
SNIJDERS, T. A. B.; STEGLICH, C. E. G.; SCHWEINBERGER, M. Modeling the co-evolution of networks and behavior', In: VAN MONTFORT, K.; OUD, H.; SATORRA, A. (Eds.). Longitudinal models in the behavioral and related sciences.Mahwah, NJ: Lawrence Erlbaum, 2007. p. 41-71.
SALEJ HIGGINS, S. A difícil construção do capital social: estruturas da ação coletiva numa organização camponesa colombiana. Latin American Research Review, v. 47, p. 83-108, 2012.