Received on 06/13/2016; Reviewed on 07/28/2016;Accepted on 08/26/2016; Divulgued on 11/01/2016. *Author for correspondence:
†. Master in Mathematics, PhD Student in Accounting and Business Administration.
Vínculo: Institute research foundation in accounting, economics and finance – FUCAPE Business School.
Endereço: Fernando Ferrari, Avenue, 1358, Boa Vista, Vitória – ES - Brazil. Cep. 29075-505.
E-mail:
Doctor in Accounting and Business Administration.
Vínculo: Institute research foundation in accounting, economics and finance – FUCAPE Business School.
Endereço: Fernando Ferrari Avenue, 1358, Boa Vista, Vitória – ES - Brazil. Cep. 29075-505.
E-mail:
¥ PhD in Economy.
Vínculo: University of British Columbia - UBC.
Endereço: 6000 Iona Dr, Vancouver, BC – Canada – V6T-2Z8.
E-mail: [email protected]
± PhD in Accounting.
Vínculo: University of British Columbia - UBC.
Endereço: 2053 Main Mall, Vancouver, BC – Canada – V6T-1Z4.
E-mail:
Note from the Editor: This paper was accepted by Bruno Felix.
This article has a Creative Commons License - Attribution 3.0 Not Adapted.
291
Conference Calls
: an Empirical Analysis of Information Content and the Type
of Disclosed News
Nadia Cardoso Moreira †
Institute Research Foundation In Accounting, Economics And Finance – FUCAPE
Felipe Ramos Ω
Institute Research Foundation In Accounting, Economics And Finance – FUCAPE
Juliana Kozak-Rogo ¥
University of British Columbia – UBC
Rafael Rogo ±
University of British Columbia – UBC
ABSTRACT
This article analyzes whether the type of news and the earnings persistence influence the amount of information that is voluntarily disclosed by the companies. As a proxy for voluntary disclosure we use the information content of the conference calls of the companies listed on the BM&F Bovespa from 2008 to 2015. The results indicate that the companies with bad news provide more information during the conference call (presentation section and questions & answers section) than the companies with good news. Moreover, were found evidence that the companies with less persistent positive earnings provide a larger amount of information than the companies with more persistent positive earnings. Regarding companies with negative earnings we did not find any relation between persistence and the informational content.
BBR, Braz. Bus. Rev. (Engl. ed., Online),
Vitória, v. 13, n. 6, Art. 6, p. 291 - 315, nov-dec. 2016 www.bbronline.com.br
1 INTRODUCTION
he objective of this study is to analyze whether the information content of
conference calls1 is influenced by the type of news being disclosed, as well as
by the firm’s earnings persistence. More specifically, we analyze whether good
or bad news have an impact on the amount of information disclosed by the firm
in the presentation of its quarterly results – first section of the conference, or
when it is challenged by analysts regarding the said results – second section of
the conference. For this purpose, we treat good news as positive earnings
(profit) and bad news as negative earnings (loss). Generally speaking, we
expect firms with bad news to disclose greater information content, when compared with
firms with bad news, possibly in order to provide explanation on low performance
(GRAHAM et al., 2005), as well as probable attitudes to reverse the unfavorable situation of
the company.
Literature suggests that voluntary disclosure practices such as conference calls reduce
information asymmetry between companies and the market (BROWN; HILLEGEIST; LO,
2004). In recent years, firms have used conference calls in order to ensure a better
understanding, by investor, of their disclosed earnings. For this reason, understanding the
effects of voluntary disclosure practices is a relevant issue for the market and its participants
(KIMBROUGH, 2005).
Research involving US companies suggest that conference calls are informative for the
participants of the capital market causing high levels of trading and reactions in stocks price
(FRANKEL; JOHNSON; SKINNER, 1999; BUSHEE; MATSUMOTO; MILLER, 2003;
KOHLBECK; MAGILKE, 2002; KIMBROUGH, 2005; MATSUMOTO; PRONK;
ROELOFSEN, 2011) causing analysts’ forecasts to become more precise (BOWEN; DAVIS;
MATSUMOTO, 2002).
Matsumoto et al. (2011) found evidence that conferences are more informative when
the manager cannot achieve analysts’ forecast, and that the questions and answers section is
more informative than the presentation section, suggesting that participants play an important
role in obtaining relevant information. Frankel et al. (2010) show that the effect of missing the
benchmark on the disclosed information content is even greater when it occurs due to a lack
of a few cents. Therefore, missing a benchmark would be one of the determinants to increase
1
For the purpose of this study the terms conference calls, conferences, audio conferences and teleconferences are treated as synonyms.
BBR, Braz. Bus. Rev. (Engl. ed., Online),
Vitória, v. 13, n. 6, Art. 6, p. 291 - 315, nov-dec. 2016 www.bbronline.com.br the average duration of conference calls (FRANKEL et al., 1999; MATSUMOTO et al.; 2011). However, these studies do not analyze the effect of the firm’s earnings persistence on the information content of the conference call. Li (2008) found evidence related to the
earnings persistence on the level of readability of the mandatory annual reports disclosed by
firms. More specifically, Li (2008) identified that companies with less persistent positive
earnings present annual reports (mandatory disclosure) that are more complex to read than
companies with more persistent positive earnings. Thus, our work is the first to associated the
type of news, as well as its persistence with a mechanism of voluntary disclosure, in the case
of conference calls. Therefore, our research bridges this gap in the literature.
Although the practice of conference calls as a voluntary disclosure has increased in the
Brazilian capital market, as far as we know, no research has been conducted in Brazil in order
to understand the determinants of the amount of information content for this kind of practice.
Therefore, this research bridges this gap in the national literature.
In order to meet the objectives of our study, we adopted the duration in minutes, as a
proxy for information content of conference calls, similar to Matsumoto et al. (2011). The
sample consisted of 3559 quarterly observations of companies listed on the BM&FBovespa.
Following the literature, we manually collected transcripts of the conference call from sites firm’s investors relations websites (IR) from 2008 to 2015. For the quarters where the transcription was not available we then collected the audio, where both were missing we
considered that there was no conference for the quarter. As a benchmark for defining good
and bad news we used the nature of earnings, positive earnings for good news, negative
earnings for bad news. Graham et al. (2005) show that presenting positive earnings is one of
the benchmarks pursued by managers. Burgstahler and Dichev (2001) found evidence that
firms manage their results in order to avoid presenting small losses.
Results suggest that firms’ conference calls with negative quarterly earnings have greater information content than those with positive earnings. More specifically, managers
disclose more information during the first section of the conference (presentation) when there
are negative earnings or bad news, and the second section (questions and answers) also
appears with greater information content when there are bad news.
With regards to the earnings persistence, evidence indicates that the information content for both sections of the conference is greater when the firm’s earnings is less persistent. Thus, when managers know that their quarterly profits will be less persistent (bad news), they
BBR, Braz. Bus. Rev. (Engl. ed., Online),
Vitória, v. 13, n. 6, Art. 6, p. 291 - 315, nov-dec. 2016 www.bbronline.com.br the second section of the conference call. However, we cannot determine whether this
information is relevant and helps participants in understanding the low quality of earnings or
if the manager is simply trying to draw away the attention of participants with other
information so they will not perceive the low persistence of earnings. The greater information
content in the second section of the conference when there are less persistent earnings can be
due to the fact that less persistent earnings cause more uncertainties on the market, increasing
participants’ demand for information that will help adjusting their forecasting models, or
because the manager tried to obfuscate the low quality of earnings in the first conference
section and is being questioned about it in the second section. With regards to companies with
negative earnings, we did not find evidence that earnings persistence would have any influence on the information content of the sections of the firm’s conference call.
This study contributes to the literature in at least three ways. First of all, it is an
embryonic research in Brazil that deals with the determinants analysis of information content
of conference calls of Brazilian companies. Secondly, the research contributes to an important
discussion for the functioning of the stock market, which is the disclosure of information
through voluntary mechanisms, which are beyond the strictest standards of mandatory
mechanisms. Finally, this study encourages the academic debate related to literature
disclosure, which seeks for a greater understanding regarding the quality and amount of
disclosed information by the firm subject to its incentives and interests.
2 PRIOR LITERATURE
According to Kreps (1990), optimal contracts between the company and investors offer
incentives so that there is full disclosure of private information. Thus, financial disclosures
emerge in an attempt to solve problems associated with information asymmetry. The financial
information is disclosed through mandatory financial reports such as the balance sheet, the
income statement and explanatory notes or through voluntary disclosures, such as managements’ forecasts, analysts’ forecasts, press releases and conference calls. According to the literature (AMIHUD; MENDELSON, 1989; DIAMOND; VERRECCHIA, 1991; KIM;
VERRECCHIA, 1994; EASLEY; O’HARA, 2004) voluntary disclosures policies and the
increase of information quality help to reduce information asymmetry, and this reduction
causes the liquidity of the capital market to increase. Therefore, voluntary disclosures also
help ensure the functionality and efficiency of the capital market. Beyer et al. (2010), by using
North American data, shows that 66% of the variance of quarterly abnormal returns is
BBR, Braz. Bus. Rev. (Engl. ed., Online),
Vitória, v. 13, n. 6, Art. 6, p. 291 - 315, nov-dec. 2016 www.bbronline.com.br
analysts’ forecasts, concluding that voluntary disclosures would be a set of relevant
information for the market.
Companies are increasing the practice of conference calls as a mechanism of voluntary
disclosure in recent years, especially in environments where the stock market is consolidated
or undergoing a consolidation phase. In relation to Brazil in 2008, approximately 275
conference calls were conducted whereas in 2014, this number rose to 568, a variation of
106%. Consequently, this type of disclosure has been the focus of several international
research whose aim is to analyze whether conference calls are able to deliver incremental and
relevant information, helping to reduce information asymmetry (FRANKEL; MAYEW; SUN,
2010; HOLLANDER; PRONK; ROELOFSEN, 2010; MATSUMOTO; PRONK;
ROELOFSEN, 2011).
Galant (1994), Feldman (1999) and WAROFF (1994) claim that conference calls
involving several analysts, institutional investors and those even open to the public improve
equality in the dissemination of information as all participants have access to the same
information at the same time. However, restricted conference calls improve the timeliness of
disclosures to analysts and financial resource managers, leaving individual investors at a
disadvantage (SMITH, 1995; GUTNER, 1996; LEVITT, 1998). Thus, analysts and financial
managers can transmit and/or trade in real time according to the information delivered during
the conference call, whereas investors not invited by the company do not have this
opportunity.
Tasker (1998), Frankel, Johnson and Skinner (1999), Price, Salas and Sirmans (2015)
sought to understand the characteristics of companies that use conference calls as a voluntary
disclosure mechanism, whether they are actually able to provide relevant information to the
market and if all investors can equally have access to this information. Tasker (1998)
examined how the accounting quality of financial reporting influences the company’s
behavior with respect to voluntary disclosures, using conference calls as a metric for
voluntary disclosures. Their results show that companies with less informative financial
reports (lower accounting quality) are more likely to practice conference calls than others, by measuring the accounting quality as the amount of information on the firm’s operations that were disclosed in its financial statements.
Frankel, Johnson and Skinner (1999) claim that companies that are more likely to
practice conference calls have similar characteristics to companies with policies of a more
BBR, Braz. Bus. Rev. (Engl. ed., Online),
Vitória, v. 13, n. 6, Art. 6, p. 291 - 315, nov-dec. 2016 www.bbronline.com.br they access the capital market more frequently, they have higher book-to-market and revenues
growth ratios. It suggests that companies with higher expected growth are more likely to make
conference calls and this may be because these companies have more information problems
than others. In addition, Frankel, Johnson and Skinner (1999) found high levels of earnings
volatility and an abnormally large volume in trading during the period of conference calls,
suggesting that conference calls provide new and relevant information, and large investors
trade in real time according to the information disclosed.
Given its structure, conference call is a unique disclosure mechanism, it is separated
into two sections with interactions between two important agents, manager and analysts. The
first part is the presentation, where the manager has the opportunity to present their interpretation of the company’s performance for the quarter and any additional information one may wish to voluntarily disclose to participants. The second part is referred to as
questions and answers, participants of the conference can ask the manager regarding
non-disclosed information or on any information that may have been non-disclosed but was not clear.
Unlike other disclosure mechanisms, whether they are mandatory and voluntary, the manager
will not only provide information to investors and analysts, but these will also be challenged
at the time of disclosure.
There are certain circumstances in which the manager has no incentive to disclose all
their private information voluntarily, that is, even if one chooses to hold a conference call it
does not mean that they will disclose all the information they have. Research relating the
manager’s type of news and the amount of information disclosed reach several conclusions.
Grossman and Hart (1980), Grossman (1981), Milgrom (1981), Milgrom and Roberts (1986)
claim that the manager will only voluntarily disclose all their private information under
certain circumstances determined as a result of the rationality of investors. Evidence in the literature suggests that managers are more likely to voluntarily disclose “good news” than
“bad news” and investors react negatively in the absence of disclosures (SKINNER, 1994;
SOFFER; THIAGARAJAN; WALTHER, 2000). However, the absence of disclosure is not
always a result from bad news, but ownership costs or uncertainty regarding information
(VERRECCHIA, 1983). Anyway, when a manager chooses to make a conference call and
does not disclose any desired information during the presentation they will be asked during
questions and answers, and if they do not disclose the information at this point the market will
BBR, Braz. Bus. Rev. (Engl. ed., Online),
Vitória, v. 13, n. 6, Art. 6, p. 291 - 315, nov-dec. 2016 www.bbronline.com.br Through a research done with another 400 executives Graham, Harvey and Rajgopal
(2005) analyzed the incentives and factors that guide the decisions of managers with respect
to voluntary disclosures and performance measures. The factor that seems to mostly influence on managers’ disclosure decisions are earnings targets, especially earnings per share. Managers believe that not meeting earnings targets or reporting volatile earnings cause
earnings to be less predictable, which causes stock prices to reduce, since investors are
uncertainty averse. The main targets to be achieved are: (1) same earnings from the previous
quarter, (2) earnings consensus forecasted by analysts for the quarter and (3) positive
earnings. Matsumoto, Pronk and Roelofsen (2011) and Frankel, Mayew and Sun (2010)
adopted the consensus of analysts for analyzing the information content of conference calls. For the purposes of this study, we use the firm’s current earnings as a benchmark to measure the type of news, thus, negative earnings represent bad news and positive earnings good news.
This direction occurred due to the difficulty of obtaining analysts’ forecasts in the Brazilian
market.
Li (2008) adopted the level of complexity of reading and the extent of the company’s
annual report as a metric for the quality of disclosure. His results show that companies with
bad news write more complex and more extensive annual reports. In an attempt to justify this behavior, he provides the “obfuscation hypothesis”: managers make several decisions interested in, at least partially, to make it harder for investors to discover information that they
would like to hide, as this would negatively affect the stock price (BLOOMFIELD, 2002).
However, Bloomfield (2008) provides an alternative hypothesis, the “ontology hypothesis”
firms with bad news write more complex and extensive reports not by a discretionary choice
of the manager, but because this kind of news is more difficult to explain. In addition,
Bloomfield (2008) highlights the importance of extending the research conducted by Li
(2008) exploring more spontaneous means of communication, such as conference calls, rather
than annual reports. Lo et al (2016) found evidence that managers after managing earnings in
order to achieve the positive earnings of the previous year, write more complex management
reports in order to hide the discretionary practices adopted to achieve their goals.
According to the “obfuscation hypothesis” we expect managers with bad news to make
a longer presentation, in order to divert investors’ attention with disclosures of other good
news, blaming other factors other than mismanagement, among other possible ways.
Following the same line, we expect analysts to be able to note the obfuscation of bad news
BBR, Braz. Bus. Rev. (Engl. ed., Online),
Vitória, v. 13, n. 6, Art. 6, p. 291 - 315, nov-dec. 2016 www.bbronline.com.br According to the ‘ontology hypothesis” expected earnings are similar, as negative earnings are less common (empirically) and more difficult to explain, the manager will require more
time to explain bad news, making the presentation part to be longer than when there are good
news. Similarly, as negative earnings are unusual events, analysts will need more information
to properly adjust their forecasting models. If the manager does not know the exact
information that analysts need they will not disclose it during the presentation, but will be
questioned during the question section, making the questions section longer when the
manager has bad news.
Results found in the literature provide further support for our beliefs. Matsumoto, Pronk
and Roelofsen (2011), Frankel, Mayew and Sun (2010) adopted the consensus of analysts’
forecasts as a benchmark to measure the type of news. Frankel, Mayew and Sun (2010)
investigated the effect that negative earnings or target achievements by pennies have on the
duration of the conference call. They argue that managers take actions and decisions to avoid
small negative earnings surprises, because even slight target miss outs cause the manager to spend more time and resources to restore their credibility and convey the company’s financial condition (BURGSTAHLER; DICHEV, 1997; DEGEORGE; PATEL; ZECKHAUSER,
1999; BURGSTAHLER; EAMES, 2006), and require more time to explain why the quarterly
benchmark was not reached (GRAHAM; HARVEY; RAJGOPAL, 2005). Their results show
that the duration of the conference increases significantly when the company misses the
benchmark by a penny and this increase is even more pronounced when compared to quarters
where the company achieves the benchmark by a penny, but perform no singular analysis
regarding the presentation and questions sections as was done by Matsumoto, Pronk and
Roelofsen (2011).
Matsumoto, Pronk and Roelofsen (2011) claim that the conference call parts have larger information content when the company cannot reach the consensus of analysts’ expected earnings (bad news). In addition, when the manager has bad news to disclose the question
section tends to be longer than the presentation.
Based on the discussion presented this study presents the following hypotheses:
H1a: The disclosure of bad news impacts on a larger information content in
conference calls.
H1b: The disclosure of bad news impacts on a larger information content in the
BBR, Braz. Bus. Rev. (Engl. ed., Online),
Vitória, v. 13, n. 6, Art. 6, p. 291 - 315, nov-dec. 2016 www.bbronline.com.br
H1c: The disclosure of bad news impacts on a larger information content in the
question and answer section of conference calls.
In addition to the relationship between the type of news and information content, we
seek to expand our analysis and try to determine whether there is a relationship between the information content of the conference call to the firm’s earnings persistence. Few studies in the literature examine the relationship between the quantity and/or quality of disclosure to the
quality of earning, among these Li (2008) found evidence that managers with less persistent
positive earnings (low quality of earnings) write annual reports that are more complex to read
(low quality of disclosures), and found no relationship when companies disclose more
persistent negative earnings.
To find the relationship between the information content of the conference call and the
earnings persistence a separate analysis is needed for the group of firms with profits and the
group of firms with losses. The persistence of these two groups is interpreted differently.
More persistent profits are better news than less persistent profits and more persistent losses
are worse than less persistent losses (LI, 2008).
The “obfuscation hypothesis” predicts that the manager will disclose more information when they expect their positive earnings to be less persistent or that their negative earnings
are more persistent when trying to obfuscate the low quality of their earnings. We expect that analysts are able to notice the manager’s attempt to obfuscate and will question them further about the quality of their disclosed earnings. According to the “ontology hypothesis” the manager will take longer during their presentation when positive or negative earnings are
expected to be less persistent since less persistent earnings are more difficult to explain.
Analysts should also ask more questions during this section when the manager discloses
positive or negative earnings that are expected to be less persistent, since low persistence is
more difficult to understand as it is unusual.
Therefore, the second hypothesis to be tested in this research for firms with positive
earnings and firms with negative earnings is:
H2a: Firms with less persistent positive earnings (more persistent negative
earnings) present greater information content in their conference calls than firms with
more persistent positive earnings (less persistent negative earnings).
H2b: Firms with less persistent positive earnings (more persistent negative
BBR, Braz. Bus. Rev. (Engl. ed., Online),
Vitória, v. 13, n. 6, Art. 6, p. 291 - 315, nov-dec. 2016 www.bbronline.com.br
conference calls than firms with more persistent positive earnings (less persistent
negative earnings).
H2c: Firms with less persistent positive earnings (more persistent negative
earnings) present greater information content in the questions and answers section of
their conference calls than firms with more persistent positive earnings (less persistent
negative earnings).
3 METHODOLOGY
3.1 SAMPLE SELECTION
We collected data of conference calls available from websites for companies’ investors relations (IR) from 2008 to 2015. The sample was limited to companies listed on the
BM&FBovespa most likely to use as audio conferencing as a mechanism of voluntary
disclosure, that is, firms with higher levels of governance (New Market, Bovespa Mais,
Levels I and Level II). To stay in line with the literature, we prioritize the collection of
transcriptions and for the periods where the transcript was not available we collected the
audio. For periods where the company does not provide the transcript nor the audio we
consider that there was no conference, resulting in 1832 transcripts and 1727 audios. Data
regarding firms’ earnings and the control variables were collected from the Economatica
database.
Table 1 – Sample Selection and Description of Data
Panel A: Sample Distribution by Year
Year Number of conference calls
2008 275
2009 318
2010 380
2011 434
2012 498
2013 534
2014 568
2015 552
Total 3559
Panel B: Sample Distribution by Firm
Sector Number of conference calls
Agricultural & Fishing 18
BBR, Braz. Bus. Rev. (Engl. ed., Online),
Vitória, v. 13, n. 6, Art. 6, p. 291 - 315, nov-dec. 2016 www.bbronline.com.br
Trade 264
Construction 397
Electronics 32
Electric Power 311
Finance & Insurance 387
Funds 0
Non-metallic Minerals 39
Mining 59
Industrial Machinery 92
Others 842
Pulp and Paper 79
Oil and Gas 41
Chemical 82
Steel & metallurgy 110
Software & Data 80
Telecommunications 44
Textile 93
Transport and Services 280
Vehicles & Auto-parts 169
Total 3559
Source: Developed by the authors.
In Panel A in Table 1 we have the number of conferences collected per year, the year
with the greatest number of conferences was 2014 (16%) followed by 2015 (15.5%) and 2013
(15%). As data were collected in the beginning of 2016 some companies completed and/or
disclosed all data for their conferences regarding the fourth quarter of 2015, due to this reason
2015 does not appear as the year with the highest number of transcriptions. In Panel B, the
distribution is done according to the firm, based on the classification by Economatica. The
sectors with the highest number of conferences are: Others (23.6%), Construction (11.1%) and
Finances and Insurances (10.9%).
3.2 MEASUREMENT FOR INFORMATION CONTENT AND NEWS TYPE
Following one of the approaches by Matsumoto, Pronk and Roelofsen, (2011), the
proxy used for the information content was the duration of the conference call. In order to
estimate the duration of the conference call through the transcripts we needed to divide all
transcripts into two sections (section 1: presentation; section 2: questions and answers) and
log the number of words present in each part. Then, we collected 1438 available audios on the
companies’ websites where the transcript also existed to estimate the average number of
words spoken per minute (129 word per minute). Such procedure is usual in the literature to
estimate the duration of the conference call (MATSUMOTO; PRONK; ROELOFSEN, 2011;
BBR, Braz. Bus. Rev. (Engl. ed., Online),
Vitória, v. 13, n. 6, Art. 6, p. 291 - 315, nov-dec. 2016 www.bbronline.com.br 3.3 MODEL AND CONTROL VARIABLES
To measure the relationship between the information content provided by the manager
during the conference call and the type of news, we created the following three models based
on Matsumoto, Pronk and Roelofsen (2011) and Frankel, Mayew and Sun (2010):
(1)
(2)
(3)
In models 1, 2 and 3 the dependent variables CALLit, PRESit and Q&Ait contain the
duration of conference call, presentation and questions and answers of the company i in the
quarter t, respectively. The dependent variable LOSSit indicates whether company i incurred
negative earnings in quarter t.
In models 1, 2 and 3 there are also different control variables suggested by the literature. We controlled them through the company’s performance calculating the firm’s return on sales (ROS), the cumulative abnormal earnings during the previous 90 days to the conference call
(RET), and the percentage of quarters with loss in recent four years (%LOSS). The results in
the studies by Chen, DeFond and Park (2002) indicate that investors demand additional
information in volatile environments. Therefore, we included variables for the volatility of
stocks returns during the 90 days prior to the conference call (VOL) and the absolute change
in seasonal returns on sales (ABS_ROS_CH). According to Frankel, Johnson and Skinner
(1999) and Tasker (1998) the size and growth potential of the company are associated with
voluntary disclosures, so we added the natural logarithm of the market value of the company
(LNMV ) and the ratio of equity and the market value, referred to as book-to-market (BTM ).
To control other unobservable variables that affect the characteristics of the conference call
we followed Matsumoto, Pronk and Roelofsen (2011), adding lag variables in our models,
that is, in models 1, 2 and 3 as control variables we included CALLi(t-1), PRESi(t-1) and
Q&Ai(t-1), respectively. The conference calls of the fourth quarter tend to be longer due to the
need to provide information that compare the performance of the current year with the
performance of the previous year and perspectives and adjustments that will be made in the
subsequent year, for this reason we included the indicator variable Q4 to control the effects of
the fourth quarter. Finally, in order to control the fixed effects of year and firm we included
BBR, Braz. Bus. Rev. (Engl. ed., Online),
Vitória, v. 13, n. 6, Art. 6, p. 291 - 315, nov-dec. 2016 www.bbronline.com.br To study the relationship between the information content and the earnings persistence
we rely on the study by Li (2008), estimating models below separately for two company
groups, those that reported profits and those that reported losses, in order to examine whether
the persistence of different news affects differently the informational content of the
conference call.
(4)
(5)
(6)
The dependent variable in models 4, 5 and 6, EPSi(t+4), contains earnings per share of
the company i in the quarter t+4. As independent variable we EPSit, earnings per share of the
company i in the quarter t. For model 4 we added as an independent variable the duration of
the conference call CALLit and its interaction with earnings per share, CALLit∗ EPSit. In
models 5 and 6 we have as independent variables the duration of the presentation (PRESit)
and questions (Q&Ait), respectively, as well as their interaction with EPSit. We include all
control variables in models 1, 2 and 3, except the lag variable and the indicator variable Q4,
and their interactions with earnings (EPS) as control variables, in addition to the controls for
fixed effects of year and firm. According to Sloan (1996) there is a negative relationship
between the absolute value of the amount of accruals and earnings persistence, for this reason
we also added to models 4, 5 and 6 the variable ABSACC containing the absolute value of
accruals.
Our main interest is in the coefficients and . The interpretation of the sign of
the coefficients is done as follows, if α3 is positive for the group of companies that reported
profits in the current quarter, it means that companies with longer conference calls (greater
information content) expect more persistent positive earnings. For the group of companies
reporting losses in the current quarter, a positive means that firms with longer conference
calls than the others of the same group, present more persistent negative earnings. A similar
analysis can be conducted for and .
4 ANALYSIS OF RESULTS
The number of conference calls comprising the sample is shown in Figure 1. We
observed an increase in the use of conference calls in earnings voluntary disclosure over the
BBR, Braz. Bus. Rev. (Engl. ed., Online),
Vitória, v. 13, n. 6, Art. 6, p. 291 - 315, nov-dec. 2016 www.bbronline.com.br 2016 when most companies had not yet conducted the conference for the fourth quarter of
2015.
Figure 1 – Number of conference calls observations per year. Source: Developed by the authors.
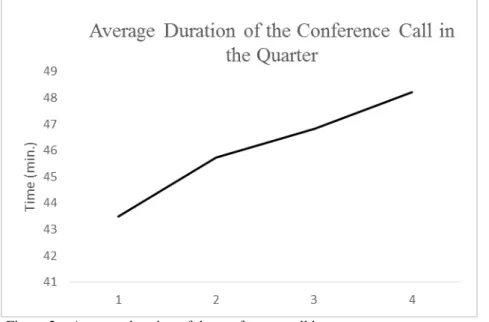
In Figure 2, we show the average duration of conference calls, we can observe an
increase in the duration of the conference over the quarters, that is, conference calls on
earnings of the fourth quarter tend to disclose more information than in any other quarter and
conference calls on earnings of the first quarters are shorter. One possible explanation for this
behavior is that the conference of the 4th quarter also deals with the firm’s annual earnings.
Figure 2 – Average duration of the conference call by quarter. Source: Developed by the authors.
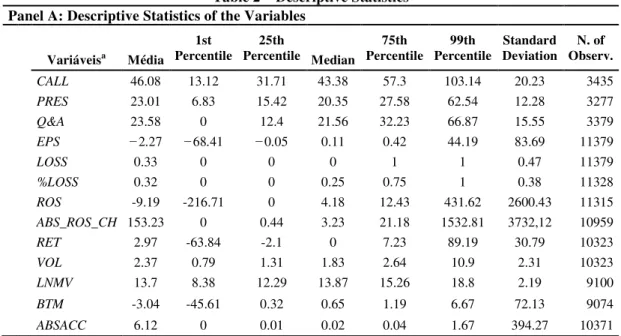
In Panel A in Table 2, we report the descriptive statistics of the variables used in the
BBR, Braz. Bus. Rev. (Engl. ed., Online),
Vitória, v. 13, n. 6, Art. 6, p. 291 - 315, nov-dec. 2016 www.bbronline.com.br (presentation) and the second section (questions and answers) last on average 23.01 and
23.58, respectively. The 1st percentile of the first section (second section) is 6.83 long (0
minutes) and the 99th percentile is 62.54 minutes long (66.87 minutes), exposing a substantial
variation of the sample. The mean of the variable LOSS is 0.33, that is, 33% of the
observations in the sample correspond to companies that report losses.
In Panel B we find the correlations between the variables, we see there is a small
correlation, though significant between the sections of the conference call PRES and Q&A
with the variable LOSS. The 0.05 correlation between the variables PRES and LOSS implies
that company incurring negative earnings makes a longer presentation, and the −0.06
correlation between Q&A and LOSS initially contradicting theories that suggest that the
questions and answers should be longer when companies report negative earnings. The
positive correlation (significant) between LNMV and the variables CALL, PRES and
Q&Aindicate that larger companies tend to disclose more information during conference calls
in both sections.
Table 2 – Descriptive Statistics
Panel A: Descriptive Statistics of the Variables
1st Percentile
25th Percentile
75th
Percentile
99th Percentile
Standard Deviation
N. of Observ.
Variáveisa Média Median
CALL 46.08 13.12 31.71 43.38 57.3 103.14 20.23 3435
PRES 23.01 6.83 15.42 20.35 27.58 62.54 12.28 3277
Q&A 23.58 0 12.4 21.56 32.23 66.87 15.55 3379
EPS −2.27 −68.41 −0.05 0.11 0.42 44.19 83.69 11379
LOSS 0.33 0 0 0 1 1 0.47 11379
%LOSS 0.32 0 0 0.25 0.75 1 0.38 11328
ROS -9.19 -216.71 0 4.18 12.43 431.62 2600.43 11315
ABS_ROS_CH 153.23 0 0.44 3.23 21.18 1532.81 3732,12 10959
RET 2.97 -63.84 -2.1 0 7.23 89.19 30.79 10323
VOL 2.37 0.79 1.31 1.83 2.64 10.9 2.31 10323
LNMV 13.7 8.38 12.29 13.87 15.26 18.8 2.19 9100
BTM -3.04 -45.61 0.32 0.65 1.19 6.67 72.13 9074
ABSACC 6.12 0 0.01 0.02 0.04 1.67 394.27 10371
Panel B: Correlation Matrixb
CALL PRES Q&A EPS LOSS %LOSS ROS ABS_ROS_CH RET VOL LNMV BTM ABSACC CALL 1 0.65 0.83 0.01 -0.02 -0.06 0 0 -0.01 -0.01 0.42 -0.13 -0.06 PRES 0.59 1 0.12 0.01 0.05 0.05 0.01 0 0 0 0.14 -0.03 -0.01
Q&A 0.84 0.11 1 0.01 -0.06 -0.11 -0.01 0 -0.01 -0.01 0.45 -0.15 -0.07 EPS 0.09 0.04 0.08 1 -0.09 -0.13 0 0 0.01 -0.03 0.07 0.01 -0.15 LOSS -0.01 0.05 -0.06 -0.81 1 0.8 -0.04 0.01 -0.01 0.15 -0.42 -0.08 0.02
%LOSS -0.06 0.01 -0.1 -0.65 0.79 1 -0.01 0.02 0.01 0.17 -0.53 -0.1 0.02
ROS 0.05 0.02 0.05 0.58 -0.8 -0.6 1 -0.54 -0.01 0 0 0 0
BBR, Braz. Bus. Rev. (Engl. ed., Online),
Vitória, v. 13, n. 6, Art. 6, p. 291 - 315, nov-dec. 2016 www.bbronline.com.br
RET -0.01 0 0 0.08 -0.08 -0.07 0.05 -0.03 1 0.57 -0.09 -0.02 0
VOL 0.03 -0.02 0.04 -0.1 0.05 0.05 -0.01 0.15 0.06 1 -0.2 -0.02 0
LNMV 0.43 0.08 0.49 0.36 -0.4 -0.49 0.24 -0.05 0.01 -0.03 1 0.13 -0.06 BTM -0.15 0 -0.2 0.06 -0.07 -0.05 0.08 0.25 -0.1 -0.01 -0.09 1 -0.07 ABSACC -0.05 0 -0.06 -0.19 0.24 0.24 -0.18 -0.09 0 0.07 -0.2 -0.17 1
This table contains the descriptive statistics of the sample in Panel A and correlations in Panel B. a CALL
duration of the conference call, PRES duration of the presentation and Q&A duration of questions and answers, in minutes, of the conference call. EPS earnings per share. LOSS indicator variable equal to 1 when the EPS of the company i in the quarter t is negative and 0 otherwise. %LOSS percentage of quarters with negative EPS during the last four quarters of the company i, where data from at least three quarters are required. ROS return on sales (ratio between revenue and net income) of the company i in the quarter t. ABS_ROS_CH absolute value of the seasonal change in earnings on sales of the company i from the quarter t-4 to the quarter t. RET cumulative abnormal earnings adjusted daily by the company i during 90 days (trading days) up to two days prior to the conference call weighted by the earnings of the quarter t. VOL standard deviation of daily cumulative adjusted abnormal earnings of the company i during 90 days (trading days) up to two days prior to the conference call weighted by the earnings of the quarter t. LNMV natural logarithm of the market value of the company i in the quarter t. BTM ratio between the equity and the market value of the company i in the quarter t. ABSACC absolute value of the amount of the company's accruals i in the quarter t, accruals are calculated as the difference between net income and the cash flow weighted by total assets.
b
Above the diagonal are the Pearson's correlations and below the diagonal are the Spearman's correlations. Correlations in bold are significant at least at 1%.
Source: Developed by the authors.
4.1 ANALYSIS OF INFORMATION CONTENT OF THE CONFERENCE CALL
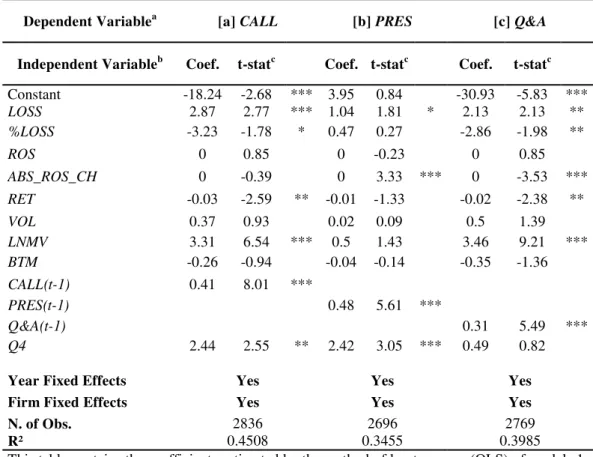
Table 3 shows the result of the estimation of models 1, 2 and 3 in columns [a], [b] and
[c], respectively. Each model has a different number of observations, because some transcripts
or audios only had one part of the conference call.
The main interest in these models are the estimated coefficients of the variable LOSS,
which is statistically positive and significant in all cases, the estimated coefficients were 2.87,
1.04 and 2.13, in columns [a], [b] and [c], respectively. Therefore, the conference call, on
average, is longer by 3 minutes, approximately, when the company incurs negative earnings
in the quarter, and this occurs because both sections are longer, that is, the manager performs
a longer presentation and is further questioned and/or takes longer to answer the questions
when negative earnings are reported for the quarter. The results are in accordance with the
presented hypothesis 1.
With respect to variable Q4, its estimated coefficient shown in columns [a] and [b] in
Table 3 are 2.44 and 2.42, respectively, and statistically significant. Therefore, earnings
conference calls of the fourth quarter are longer in fact, and this occurs because the manager
takes longer to perform the presentation than in other quarters, with the purpose to provide
information comparing the current year’s performance with that of the previous year and prospects for the next year’s performance.
The estimated coefficient of the variable RET is statistically significant and negative in
BBR, Braz. Bus. Rev. (Engl. ed., Online),
Vitória, v. 13, n. 6, Art. 6, p. 291 - 315, nov-dec. 2016 www.bbronline.com.br and consequently the conference call too. Its coefficient in column [b] does not appear as
statistically significant, implying that changes in the cumulative abnormal return does not
influence the information content of the presentation.
Table 3 – Analysis of Informational Content of the Conference Call
Dependent Variablea [a] CALL [b] PRES [c] Q&A
Independent Variableb Coef. t-statc Coef. t-statc Coef. t-statc
Constant -18.24 -2.68 *** 3.95 0.84 -30.93 -5.83 ***
LOSS 2.87 2.77 *** 1.04 1.81 * 2.13 2.13 **
%LOSS -3.23 -1.78 * 0.47 0.27 -2.86 -1.98 **
ROS 0 0.85 0 -0.23 0 0.85
ABS_ROS_CH 0 -0.39 0 3.33 *** 0 -3.53 ***
RET -0.03 -2.59 ** -0.01 -1.33 -0.02 -2.38 **
VOL 0.37 0.93 0.02 0.09 0.5 1.39
LNMV 3.31 6.54 *** 0.5 1.43 3.46 9.21 ***
BTM -0.26 -0.94 -0.04 -0.14 -0.35 -1.36
CALL(t-1) 0.41 8.01 ***
PRES(t-1) 0.48 5.61 ***
Q&A(t-1) 0.31 5.49 ***
Q4 2.44 2.55 ** 2.42 3.05 *** 0.49 0.82
Year Fixed Effects Yes Yes Yes
Firm Fixed Effects Yes Yes Yes
N. of Obs. 2836 2696 2769
R² 0.4508 0.3455 0.3985
This table contains the coefficients estimated by the method of least squares (OLS) of models 1,
2 and 3, in columns[a], [b] and [c], respectively.
a CALL
duration of the conference call, PRES duration of the presentation and Q&A duration of questions and answers, in minutes, of the conference call of the company i in the quarter t. b LOSS
indicator variable equal to 1 when the EPS of the company i in the quarter t is negative and 0 otherwise. %LOSS percentage of quarters with negative EPS during the last four quarters of the company i, where data from at least three quarters are required. ROS return on sales (ratio between revenue and net income) of the company i in the quarter t. ABS_ROS_CH absolute value of the seasonal change in earnings on sales of the company i from the quarter t-4 to the quarter t. RET cumulative abnormal earnings adjusted daily by the company i during 90 days (trading days) up to two days prior to the conference call weighted by the earnings of the quarter t. VOL standard deviation of daily cumulative adjusted abnormal earnings of the company i during 90 days (trading days) up to two days prior to the conference call weighted by the earnings of the quarter t. LNMV natural logarithm of the market value of the company i in the quarter t. BTM ratio between the equity and the market value of the company i in the quarter t. CALL(t-1) duration of the conference call, PRES(t-1) duration of the presentation and Q&A(t-1)duration of questions and answers of the conference call of the company i in the quarter t-1. Q4 is an indicator variable equal to 1 when quarter t is the fourth quarter and 0 otherwise. c
t-statistic with cluster analysis by company. *, ** and *** indicate statistical significance at 1%, 5% and 10%, respectively.
BBR, Braz. Bus. Rev. (Engl. ed., Online),
Vitória, v. 13, n. 6, Art. 6, p. 291 - 315, nov-dec. 2016 www.bbronline.com.br 4.2 RELATIONSHIP BETWEEN THE INFORMATION CONTENT AND THE PERSISTENCE OF THE TYPE OF NEWS
In this section the objective is to analyze the relationship between the information
content of the conference and the persistence of the company’s earnings. To do this analysis
we divided our sample into two groups, observations in which bad news were disclosed
(losses) and in which good news were disclosed (profits). In Table 4 we have a number of
observations for each group with respect to each variable. The number of companies incurring
profits is much higher than the number of companies with loss. In approximately 81% of the
observations in which we have the duration for the conference companies report positive
earnings and only 19% of companies report negative earnings.
Table 4 – Number of Observations by Group of News
CALL PRES Q&A
Number of observations without cuts
3435 3277 3379
Observations with data on quarterly
earnings
3389 3235 3337
Separation by
group Profit Loss Profit Loss Profit Loss Number of
observations 2743 646 2635 600 2730 607
Source: Developed by the authors.
The results of the models 4, 5 and 6 for the group of companies with good news
(profits) are in columns [a], [b] and [c] in Table 5. Column [a] in Table 5 shows the EPS
regression results a year ahead of the current EPS, the duration of the conference call on
current earnings and the interaction between the two. The interaction term between the
variables earnings per share and duration of the conference captures the change in positive
earnings persistence with respect to changes in the conference duration.
In the other columns we replaced duration of the conference call for the duration of its
sections separately, in column [b] the duration of the presentation and in column [c] the
duration of questions and answers. The estimated coefficients of the control variables were
omitted, as well as the coefficients of the dummy variables included to capture the fixed
effects of the year and firm. In all regressions we used the same control variables as well as
the interaction of the control variables with the EPS
The main interest is in the coefficients of the interaction variables CALL∗ EPS,
BBR, Braz. Bus. Rev. (Engl. ed., Online),
Vitória, v. 13, n. 6, Art. 6, p. 291 - 315, nov-dec. 2016 www.bbronline.com.br negative. In column [a] in Table 5, the coefficient of the variable CALL∗ EPS is −0.29, thus,
longer conferences are related to less persistent positive earnings.
Table 5 – Relationship between Information Content and Persistence of Good News
Dependent Variablea [a] EPS(t+4) [b] EPS(t+4) [c] EPS(t+4)
Independent Variableb Coef. t-statd Coef. t-statd Coef. t-statd
Constant 9.14 0.98 21.64 1.74 * 9.54 1.09
EPS -15.21 -1 -40.29 -1.89 * -14.45 -1.2
CALL 0.12 3.48 ***
CALL*EPS -0.29 -4.2 ***
PRES 0.18 2.45 **
PRES*EPS -0.27 -1.95 *
Q&A 0.11 2.6 **
Q&A*EPS -0.33 -3.34 ***
Control Variablesc Yes Yes Yes
Year Fixed Effects Yes Yes Yes
Firm Fixed Effects Yes Yes Yes
Nº. of Obs. 2163 2085 2137
R² 0.8215 0.7535 0.8126
This table contains the coefficients estimated by the method of least squares (MLS) of the models 4, 5 and 6, in columns [a], [b] and [c], respectively, for companies incurring profit.
a
EPS(t+4) earnings per share of the company i in the quarter t+4.
b EPS
earnings per share of the company i in the quarter t. CALL duration of the conference call, PRES duration of the presentation and Q&A duration of questions and answers, in minutes, of the conference call of the company i in the quarter t.
c
LOSS indicator variable equal to 1 when the EPS of the company i in the quarter t is negative and 0 otherwise. %LOSS percentage of quarters with negative EPS during the last four quarters of the company i, where data from at least three quarters are required. ROS return on sales (ratio between revenue and net income) of the company i in the quarter t. ABS_ROS_CH absolute value of the seasonal change in earnings on sales of the company i from the quarter t-4 to the quarter t. RET cumulative abnormal earnings adjusted daily by the company i during 90 days (trading days) up to two days prior to the conference call weighted by the earnings of the quarter t. VOL standard deviation of daily cumulative adjusted abnormal earnings of the company i during 90 days (trading days) up to two days prior to the conference call weighted by the earnings of the quarter t. LNMV natural logarithm of the market value of the company i in the quarter t. BTM ratio between the equity and the market value of the company i in the quarter t. ABSACC absolute value of the amount of the company's accruals i in the quarter t, accruals are calculated as the difference between net income and the cash flow weighted by total assets. And the interaction between all these variables and EPS.
d
t-statistics with cluster analysis by the company. *, ** and *** indicate statistical significance at 1%, 5% and 10%, respectively.
Source: Developed by the authors.
In column [b] the coefficient of the variable PRES∗ EPS is −0.27, that is, when the first
section of the conference presents a higher information content than the average, the
BBR, Braz. Bus. Rev. (Engl. ed., Online),
Vitória, v. 13, n. 6, Art. 6, p. 291 - 315, nov-dec. 2016 www.bbronline.com.br ontological issue, where less persistent earnings are naturally more difficult to explain than
more persistent earnings and therefore require more time to be communicated. Another
alternative explanation could be a matter of obfuscation, where the manager would
intentionally act on communication trying to divert attention from conference participants
from bad news that they would have to communicate and thus spend more time in their
presentation.
In column [c] the coefficient of the variable Q&A∗EPS is −0.33, so when the second
part of the conference lasts longer than the average, positive earnings tend to be less
persistent. Therefore, based on an ontological explanation, we have that less persistent
positive earnings are more difficult to understand, thus, even if the manager has disclosed
information about the quality of earnings participants of the conference demand more information to better understand the firm’s earnings. Another alternative explanation would be that if the manager acted in order to obfuscate the bad quality of earnings during the first
part of the conference, a greater duration of the second section may indicate that the
participants perceive this behavior and ask more questions to the manager when the current
positive earnings tend to be less persistent.
The same models were estimated for companies with bad news (loss) and the results are
found in Table 6. In column [a] we have the estimated model coefficients that captures the
relationship between the information content from the conference call with the persistence of
bad news. In columns [b] and [c] the results of the models that analyze the information
content of the two conference sections individually. The control variables are the same as
regressions shown in Table 5 and their coefficient were also omitted. Following the same
pattern, we included variables included to capture the fixed effects of year and firm. The
estimated variable coefficient CALL∗EPS in model 4 for companies with bad news is negative
and statistically significant, −0.020. Therefore, when the conference has a higher information
content than the average, negative earnings tend to be less persistent. One possible
explanation for this behavior is that managers with less persistent negative earnings seek to
differentiate themselves from those with more persistent negative earnings, disclosing more
information to reveal this news. However, the coefficients of the variables PRES∗EPS
(column [b]) and Q&A∗EPS (column [c]), in Table 6, are not statistically significant.
BBR, Braz. Bus. Rev. (Engl. ed., Online),
Vitória, v. 13, n. 6, Art. 6, p. 291 - 315, nov-dec. 2016 www.bbronline.com.br Table 6 – Relationship between Informational Content and Persistence of Good News
Dependent Variablea [a] EPS(t+4) [b] EPS(t+4) [c] EPS(t+4)
Independent Variableb Coef. t-statd Coef. t-statd Coef. t-statd
Constant -71.14 -0.72 -49.42 -0.61 -92.79 -0.83
EPS -1.32 -0.38 -0.001 0 0.45 0.17
CALL -0.56 -1.88 *
CALL*EPS -0.02 -2.05 **
PRES -0.16 -1.28
PRES*EPS -0.01 -0.35
Q&A -0.74 -1.47
Q&A*EPS -0.27 -1.55
Control Variablec Yes Yes Yes
Yes Yes Yes
Year Fixed Effects
Yes Yes Yes
Firm Fixed Effects
Nº. of Obs. 477 449 452
R² 0.5438 0.5441 0.5554
This table contains the coefficients estimated by the method of least squares (OLS) of the models 4, 5 and 6, in columns [a], [b] and [c], respectively, for companies incurring loss.
a
EPS(t+4) earnings per share of the company i in the quarter t+4.
b EPS
earnings per share of the company i in the quarter t. CALL duration of the conference call, PRES duration of the presentation and Q&A duration of questions and answers, in minutes, of the conference call of the company i in the quarter t.
c LOSS
indicator variable equal to 1 when the EPS of the company i in the quarter t is negative and 0 otherwise. %LOSS percentage of quarters with negative EPS during the last four quarters of the company i, where data from at least three quarters are required. ROS return on sales (ratio between revenue and net income) of the company i in the quarter t. ABS_ROS_CH absolute value of the seasonal change in earnings on sales of the company i from the quarter t-4 to the quarter t. RET cumulative abnormal earnings adjusted daily by the company i during 90 days (trading days) up to two days prior to the conference call weighted by the earnings of the quarter t. VOL standard deviation of daily cumulative adjusted abnormal earnings of the company i during 90 days (trading days) up to two days prior to the conference call weighted by the earnings of the quarter t. LNMV natural logarithm of the market value of the company i in the quarter t. BTM ratio between the equity and the market value of the company i in the quarter t. ABSACC absolute value of the amount of the company's accruals i in the quarter t, accruals are calculated as the difference between net income and the cash flow weighted by total assets. And the interaction between all these variables and EPS.
d
t-statistics with cluster analysis by the company. *, ** and *** indicate statistical significance at 1%, 5% and 10%, respectively.
Source: Developed by the authors.
5 FINAL CONSIDERATIONS
This study analyzed the relationship between the information content of the conference
call and the type of news, considering bad or good news when the company reports positive
or negative earnings for the quarter, respectively. The results indicate that the section of the conference, in which the manager presents the firm’s quarterly earnings, has greater information content when the company reports bad news. Therefore, the manager voluntarily
BBR, Braz. Bus. Rev. (Engl. ed., Online),
Vitória, v. 13, n. 6, Art. 6, p. 291 - 315, nov-dec. 2016 www.bbronline.com.br earnings than when the company incurs positive earnings. The second section of the
conference, which is related to questions and answers in quarterly earnings, also presented
greater information content when the company has bad news to disclose, indicating that the
manager is further questioned by participants of the conference when the company incurs
negative earnings.
In addition, we found evidence that the manager discloses on average, more information
during the first section of the conference when they know the good news will not be persistent
for the following year, than when the good news is persistent. Just as the first part of the
conference, the second part presented greater information content, on average, when the good
news is less persistent. We found a negative correlation and statistically significant between
the information content and the persistence of bad news, indicating that companies with less
persistent negative earnings have conferences with informational content greater than those
with more persistent negative earnings. However, there is no statistically significant
relationship between the parts of the conference, separately, and the persistence of bad news.
The limitations of this research are related to issues such as: the metrics used to measure
the effects of interest as information content, for which we used the duration in minutes of the
conference call, the classification of the type of news, for which we used whether the
company reported positive or negative earnings etc. In addition, the results are limited for the
analyzed periods and companies, which should not be extended to other time stratums or
groups of companies.
For future research it would be interesting to analyze more in-depth, what the true
explanation is for disclosures with greater information content when the company presents
negative or less persistent positive earnings, i.e., it would be an ontological or obfuscation
matter. In addition, research could be conducted using other means of disclosure, such as
press release, mandatory reports etc., as well as using other metrics for the measurement of
information content and the type of news.
CONTRIBUTIONS BY THE AUTHORS
Nadia Cardoso Moreira contributed to the development of the idea, literature review,
writing, collecting and analyzing data.
Felipe Ramos contributed to the development of the idea, writing, collecting and
BBR, Braz. Bus. Rev. (Engl. ed., Online),
Vitória, v. 13, n. 6, Art. 6, p. 291 - 315, nov-dec. 2016 www.bbronline.com.br
Juliana Kozak-Rogo contributed to the development of the idea, construction of the
econometric model, data analysis.
Rafael Rogo contributed to the development of the idea, data analysis and writing.
REFERENCES
AMIHUD, Y.; MENDELSON, H. The effects of beta, bid-ask spread, residual risk, and size on stock returns. The Journal of Finance, Wiley Online Library, v. 44, n. 2, p. 479–486, 1989.
BEYER, A. et al. The financial reporting environment: Review of the recent literature.
Journal of accounting and economics, Elsevier, v. 50, n. 2, p. 296–343, 2010.
BLOOMFIELD, R. Discussion of “annual report readability, current earnings, and earnings
persistence”. Journal of Accounting and Economics, Elsevier, v. 45, n. 2, p. 248–252, 2008.
BLOOMFIELD, R. J. The “incomplete revelation hypothesis” and financial reporting.
Accounting Horizons, v. 16, n. 3, p. 233–243, 2002.
BOWEN, R. M.; DAVIS, A. K.; MATSUMOTO, D. A. Do conference calls affect analysts’
forecasts? The Accounting Review, v. 77, n. 2, p. 285–316, 2002.
BROWN, S.; HILLEGEIST, S. A.; LO, K. Conference calls and information asymmetry.
Journal of Accounting and Economics, Elsevier, v. 37, n. 3, p. 343–366, 2004.
BURGSTAHLER, D.; DICHEV, I. Earnings management to avoid earnings decreases and losses. Journal of accounting and economics, Elsevier, v. 24, n. 1, p. 99–126, 1997.
BURGSTAHLER, D.; EAMES, M. Management of earnings and analysts’ forecast to achieve zero and small positive earnings surprises. Journal of Business Finance & Accounting, Wiley Online Library, v. 33, n. 5-6, p. 633–652, 2006
BUSHEE, B. J.; MATSUMOTO, D. A.; MILLER, G. S. Open versus closed conference calls: the determinants and effects of broadening access to disclosure. Journal of Accounting and Economics, Elsevier, v. 34, n. 1, p. 149–180, 2003.
CHEN, S.; DEFOND, M. L.; PARK, C. W. Voluntary disclosure of balance sheet information in quarterly earnings announcements. Journal of Accounting and Economics, Elsevier, v. 33, n. 2, p. 229–251, 2002.
DEGEORGE, F.; PATEL, J.; ZECKHAUSER, R. Earnings management to exceed thresholds*. The Journal of Business, JSTOR, v. 72, n. 1, p. 1–33, 1999.
DIAMOND, D. W.; VERRECCHIA, R. E. Disclosure, liquidity, and the cost of capital. The journal of Finance, Wiley Online Library, v. 46, n. 4, p. 1325–1359, 1991.
EASLEY, D.; O’HARA, M. Information and the cost of capital. The journal of finance,
Wiley Online Library, v. 59, n. 4, p. 1553–1583, 2004.

![Table 3 shows the result of the estimation of models 1, 2 and 3 in columns [a], [b] and [c], respectively](https://thumb-eu.123doks.com/thumbv2/123dok_br/18922090.435616/16.892.112.827.128.206/table-shows-result-estimation-models-columns-b-respectively.webp)

![Table 5 – Relationship between Information Content and Persistence of Good News Dependent Variable a [a] EPS(t+4) [b] EPS(t+4) [c] EPS(t+4) Independent Variable b Coef](https://thumb-eu.123doks.com/thumbv2/123dok_br/18922090.435616/19.892.171.767.226.638/relationship-information-content-persistence-dependent-variable-independent-variable.webp)
