RBGN
Review of Business Management
DOI: 10.7819/rbgn.v18i62.2798
505
Received on
10/30/2015
Approved on
08/30/2016
Responsible editor:
Prof. Dr. João Maurício Gama Boaventura
Evaluation process: Double Blind Review
Relational structure in the global automotive
industry: groups, networks and fields
Mário Sacomano Neto
Federal University of São Carlos, Department of Production Engineering and Graduate Program in Management of Organizations and Public Systems, São
Carlos, SP - Brazil
Paulo César Matui
Silvio Eduardo Alvarez Candido
Federal University of São Carlos, Department of Production Engineering, São Carlos, SP - Brazil
Roniberto Morato do Amaral
Federal University of São Carlos, Department of Information and NIT, São Carlos, SP - Brazil
Abstract
Purpose – he purpose of this study was to analyze the network
structure of automotive companies linked by cross-shareholding, joint ventures, manufacturing contracts and alliances, from 2004 to 2012. he study also explored how the network structure afects the competition in the ield.
Design/methodology/approach – he sample involved 3695 dyads.
Based on this data, it was possible to build and assess networks using Gephi and UCINET software. he study considered network analysis metrics such as centrality, group and network densities temporally. hus, associated with a contextual and longitudinal analysis, the construction of sociograms allowed visualization of the interactional structure and the automakers’ position in the ield.
Findings – Results showed that the internationalization and growth of
automakers and suppliers are made possible through these relationships among companies (cross-shareholding, joint ventures, manufacturing contracts and alliances). Connections may generate greater power, access to resources and market opportunities. It also enhanced the elaboration of inferences about how these resources inluence the competition in the ield.
Originality/value – he increasing importance of this relational
resource shapes the industry competitive structure, which is composed of cooperative and competitive relationships found in meso-level orders.
Keywords – heory of ields; ields; social networks; strategic groups;
1
Introduction
Meso-level studies are increasingly important in economic sociology, institutional theory and organizational analysis, enhancing the difusion of the concepts of ield (Fligstein & McAdam, 2012), social networks (Granovetter, 1985) and strategic groups (Garcia-Pont & Nohria, 2002; Gomes-Casseres, 2003; Lazzarini, 2008; Nohria & Garcia-Pont, 1991). Diferent theoretical perspectives co-exist and many research results suggest the need for cross fertilization. Companies tend to relate to others in order to keep or improve their position in the ield (Fligstein & McAdam, 2012), by accumulating resources (Garcia-Pont & Nohria, 2002; Gomes-Casseres, 2003) and knowledge of the market (Powell & Smith-Doer, 1994). he coniguration of interactions among these groups of companies play a signiicant role in value appropriation by the actors (Lavie, 2007), deining the incumbents of ields (Fligstein, 1991; Fligstein & McAdam, 2012) and in control and complementarity of resources (Pfefer & Salancik, 2003). Belonging to a group is strategic to companies, since their performance depends on results and resources held by other actors they are connected to (Lazarini, 2008).
Nohria and Garcia-Pont (1991) and Garcia-Pont and Nohria (2002) argued that the automotive industry is organized in “constellations”. The configurations of the property relationships, alliances and cooperation agreements play a significant role in value appropriation and in the complementarities of the groups’ resources (Lavie, 2007; Lin, Yang & Arya, 2009). We suggest that groups operate within strategic action fields (Fligstein & McAdam, 2012) and that the position occupied by actors in diferent networks is a signiicant measure of the social capital (Bourdieu, 2005) or the relational resources (Gulati, 2007, Lavie, 2008) dominated by companies to maintain or improve their position in the competitive arena. Networks are related to several speciic forms
of resource, including intellectual property, marketing channels, manufacturing facilities and personnel (Gulati, Lavie & Madhavan, 2011). he social network analysis is herein used to measure resource endowments of diferent companies in the automotive industry and their changes between 2004 and 2014. his technique is based on the regularity of the structures of ties among nodes (Wasserman & Faust, 1994). he composition of networks based on cross-shareholding, joint ventures, manufacturing contracts and alliances allows mapping groups composing the ield.
he internationalization of automotive companies and their strategies for entering new emerging markets are strongly associated with merger and acquisition processes, and with joint ventures (Shi, Sun, Pinkham, & Peng, 2014). It results in increasing concentration of power and new plant locations and design centers worldwide, such as those implemented in China, South Korea, Russia, India and Brazil. Cross-shareholdings, joint ventures, manufacturing contracts and alliances are indicators of these dynamics, in which companies acquire or establish partnerships with other assemblers in the automotive industry seeking strategic advantages. At the same time, companies in the same sub-groups compete and cooperate with each other and compete with other sub-groups and companies.
he current research is guided by one central question: how does the network structure inluence the position within the ield? Other questions are relevant as well, such as: what are the most central companies along the studied period? What are the strategic groups? Do the sub-groups become denser? How do relationships and relational issues promote a privileged position in the ield? he study seeks to dialogue with distinct theoretical perspectives of ields, strategic groups and networks to address the dynamics of
2
heoretical foundations
heoretically, the paper contributes to clarify the relationship between networks and fields. Networks can support other different resources. So, we can infer that corporate and managerial social skills in networks are signiicantly important to advance to new positions and get new resources. Techniques of social network analysis as the ones used in the paper are useful to get objective measures of social capital. Together with the measures of other resources, these may generate inputs to the drawing of the structure of the ield, which may be done either using multiple correspondence analysis, in the Bourdiesian fashion, or, alternatively, also using social networks techniques to interconnect properties and actors, as suggested by Nooy (2003). Visualizing networks may also be useful for a more qualitative assessment of ields. In this case, it is relevant to understand how the position in the network relates to the shared meanings of actors, who are the incumbents in the ield and why.
2.1
Fields
Field theories have been commonly used to study the economic realm in contemporary
economic and organizational sociologies. here are at least two main basic perspectives using the concept of ields in diferent ways (Swedberg, 2004). The first one is associated with the sociological institutionalism in organizational analysis (DiMaggio & Powell, 1983; Powell & DiMaggio, 1991). In this case, organizational ields are conceptualized as “those organizations which, in the aggregate, constitute a recognized area of institutional life: key suppliers, resource and product consumers, regulatory agencies, and other organizations that produce similar services or products” (DiMaggio & Powell, 1983, p. 148).
he second approach derives from the sociological approach by Bourdieu (1985), which conceptualizes ields as:
a network, or a coniguration, of objective relationships between positions. hese positions are objectively deined in their existence and in the determinations they impose upon their occupants, agents or institutions by their present and potential situation (situs) in the structure of the distribution of species of power (or capital) whose possession commands access to the speciic proits that are at stake in the field, as well as by their objective relation to other positions (domination, subordination, homology, etc.). (Bourdieu & Wacquant, 1992, p. 97).
According to these authors’ view, the concept of field may not be isolated from concepts such as habitus and capital, constituting
a relational scheme of perception that may be used for a rigorous, but not rigid, empirical analysis. Agents’ positions (individuals or organizations) are deined by the relative distribution of resources recognized as valid in the ield’s competition. For instance, in the case of economic fields, inancial, cultural, social, technological, juridical, organizational, commercial and symbolic resources are all important to market competition, with the relative endowments of companies deining their position and possibilities (Bourdieu, 2005).
Inspired by Bourdieu’s approach, Fligstein and McAdam (2012) recently suggested a similar perspective that deines ields as arenas with socially constructed sense of belonging, boundaries and understandings for operation (i.e., the understanding of what is at stake in the ield, who the incumbents and challengers are, what the rules of the space are and how actors in diferent positions should act). he authors suggest the adaptation of the Bourdiesian approach to more systematically account for conscious cooperation and collective action by replacing the sense of
habitus with that of social skills. hey also have a
accounts on how the ield structure is deined by the objective and relative distribution of diferent resources.
The herein presented automotive industry analysis will draw on Bourdieu and Fligstein and McAdam (2012) perspectives without overemphasizing their diferences. hese approaches deine ield in a more focused way than it is deined in the institutional account, which demands taking into consideration the interconnection of ields (Fligstein & McAdam, 2012). hus, the assembling companies in this industry which were approached in the current study will be considered part of the same ield – which is possibly composed of subfields, including speciic segments (or strategic groups, as suggested by Garcia-Pont & Nohria, 2002) and organizations, which might be assessed as ields themselves.
Based on this working hypothesis, the study will also consider that assembling companies operate in a context in which social capital (Bourdieu, 1985) or relational resources (Gulati, 2007) become increasingly important to their competitiveness. Such proposition meets extensive literature on organizational and economic sociologies, which is focused on assessing the institutionalization of new organizational forms that can change these organizations’ boundaries by increasingly conceiving them as networked organizations (Boltanski & Chiapello, 2009; Davis, 2009; Donadone, 2004; Fligstein, 1991; Grün, 1999). According to these authors, this process was driven by changes in the regulation of developed economies and in the increasing control of organizations by the logic of inance, resulting, among other consequences, on drastic changes in organizational dynamics, due to the corporations’ growing focus on their core business and interdependence on other actors in their “value chain” (Davis, Diekmann, & Tinsley, 1994).
Empirically, clear examples of this perspective were found. Take the example given
by the Chinese market, whose access was justiied by its potential consumers, i.e., the giant Chinese domestic demand, which is an attractive resource in terms of man-power, cost, qualiication, inputs and raw materials. he country’s internal volume ensures unprecedented competitiveness levels in comparison to other geographical regions. Incumbents and challengers must dominate the local rules within the global competition game. hus, every group gets access to local resources in China by means of joint ventures (Shi et al., 2014).
It does not mean that all automakers have local presence. However, once a group is formed, its access becomes a common asset. By taking the example of Fiat from 2004-2006 and 2007-2009, the company established three relationships with Chinese companies. After its partnership with Chrysler, from 2010 to 2012, Fiat jumped to 22 partnerships in China. here are also speciic indings such as GM and Nissan partnership from 2010 to 2012 in the European and North American markets against Ford and Toyota. hese partnerships are based on assembly contracts that allow automakers to produce vehicles with acceptance in speciic markets to their partners. hey establish a speciic partnership system for the manufacturing of a speciic vehicle (in this case, a van) and share their facilities. hey understand that there are benefits on competing against incumbents within this sector.
The abovementioned examples also emphasize a possible convergent perspective of the social capital as understood by Bourdieu (1985) and the relational resource as prescribed by Gulatti (2007). his convergent perspective is explored by Nooy (2003), who observed that the theoretical background of correspondence analysis is compatible to the one of network analysis. hrough network analysis techniques it is possible to assess social capital. Nooy (2003) also argues that:
from intersubjective relationships: acts of submission are so similar as emblems of power. hus a researcher may use data on intersubjective relationships for assessing the amount and distribution of particular species of capital. If Bourdieu argues that interaction is driven by the distribution of types of capital, the former can be used to measure the latter. (p. 319)
Interactions represent much more than ties among nodes and may involve recognition and power relationships. Let’s take again the examples above. Fiat allied with Chrysler to leverage its presence in China, conforming to the production model in the country. he monetary valuation of Chrysler is a form of conversion of social into economic capital. Also, GM accepts to share a production line with Nissan. Arrangements like this involve a form of domination expressed as a dyad among two automakers like Fiat and Chrysler, or a triplet in the case of GM and Nissan – GM → Shared plant and Nissan → Shared plant. We can use relationships to operationalize diferent forms of social capital.
However, it is crucial to operationalize these assessments of these variables based on objective relationships, which means:
diferential possession of capital [among actors]: economic, social, and cultural capital. In [Bourdieu’s] theory, the relational aspect is not some kind of exchange or interaction, but the fact that relative diferences count: do you have more capital, another type of capital, or another property or trait than someone else? This is the reason why Bourdieu prefers correspondence analysis: correspondences are relatively frequent combinations of properties. (Nooy, 2003, p. 325).
In the next section, another body of literature focused on how these companies conceptualize their boundaries in a more focused
way and developed diferent forms of alliances with other companies, in the same ield, as part of their strategy to produce or improve their positions will be revised.
2.2
he rise of strategic groups in ields:
Alliances and constellations
he demand for inter-irm cooperation enhanced the formation of strategic alliances (Garcia-Pont & Nohria, 2002). After these changes, several studies started to focus on groups or constellations rather than on individual companies (Casseres, 2003; Das & Teng, 2002; Lazzarini, 2008; Mahmood, Zhu & Zajac, 2011; Powell, 1990). hese studies assumed new competition models and became increasingly focused on constellations, instead of focusing on individual firms, competition, formation of oligopolies, diferentiation sources, resource acquisitions and management, and profit sources. They assumed that the constellation structure afects the way organizations compete and the position in the group inluences the gains appropriated by each irm (Powell, 1990). hey have multiplied because they are viewed as efficient in dealing with knowledge-based activities, solving hold-up problems, and reducing contractual hazards (Menard, 2013).
Casseres (2003) deines constellations as a group of companies connected through alliances that compete with other constellations or with a single company in a certain competitive domain. Das and Teng (2002) define them as a strategic alliance composed of several partner companies to compete against other groups and individual companies. Alliances are defined as inter-firm cooperation arrangements established to achieve strategic goals (Powell, 1990), and constellations are alliances involving autonomous companies that compete against each other for clients and members in a specific or nearby sector (Lazzarini, 2008).
(2002) cite a database with 2417 alliances among several sectors and countries, in which more than a quarter of the partnerships consist of multilateral alliances, or constellations. he authors also argue that constellations should be conceptualized as relevant forms of social control and suggest a typology of constellations based on general reciprocity and exchange of information, knowledge and other resources.
It is also important to distinguish constellations from other forms of cooperation. Inter-irm partnerships may be considered as the strategic alliances or the network of alliances (Das & Teng, 2002). Both represent inter-organizational relationships aiming to enhance competitive advantage via cooperation. However, whereas a network of alliances involves several ties with diferent objects, a strategic alliance involves two or more companies in a speciic cooperation agreement.
Constellations may be more or less formalized, and the informal ones are called implicit constellations. In this case, companies are more interdependent within constellations than they are to irms that are not part of them (Lazzarini & Joaquim, 2004; Li, Eden, Hitt, Ireland, & Garrett, 2012).
2.3
Network analysis
As analytical tools, networks are founded in the structure of interactions that shape several market aspects, in which social connections corroborate structures or regular relationships among units (Wasserman & Faust, 1994). he structure of the ties may be economic, political, interactional, and afective, among other forms. Relationships are expressed through linkages among units of analysis, through which material and non-material resources, physical interactions and authority relationships low (Wasserman & Faust, 1994).
Actors are deined as a set of discrete, individuals, corporations or other collective social units (Carpenter, Li & Jiang, 2012; Scott, 2012; Wasserman & Faust, 1994). hey may be
individual or collectivitie, such as informal groups and formal organizations (Berkowitz, 2013; Knoke & Yang, 2008), and are represented by nodes and supported by attribute data regarded as properties, qualities or features of individuals and groups (Scott, 2012). However, as Borgatti and Li (2009) pointed out, the level of the individual partly depends on their position in the network structure and on their relationship patterns.
Connections, relationships or linkages are deined as speciic types of contact, connection or tie between a pair of actors or dyad. Relationships may be direct and indirect. By focusing on a speciic type of relationship, a researcher may measure a joint dyadic property (Knoke & Yang, 2008). Connections are supported by relational data about contacts and ties. Relational data connect agents in larger relational systems (Scott, 2012) and, by using these connections, some actors have more access to information and scarce resources.
The network structure is the specific pattern assumed by the network (Knoke & Yang, 2008). Positions deine the place of an actor within the network structure, which may be assessed in relation to the overall structure of the networks (Granovetter, 1985; Rowley, Behrens & Krackhardt, 2000; Sacomano & Truzzi, 2009), defining the structural and relational embeddedness (Granovetter, 1985). Structural and relational embeddedness works as control elements of the behavior and cooperation of partners within an alliance (Rowley et al., 2000; Tate, Ellram, & Gölgeci, 2013).
relationship between two other actors in the network. Structural equivalence denotes cases in which two actors occupy similar positions in the network structure. Density is the fraction of actual relationships in a network in relation to the number of possible relationships in it. It facilitates the low of information and resources, thus allowing the emergence of a closed system of conidence and shared standards. Cohesion is understood as the intensity of the relationships, in which strong cohesion is associated with reined information sharing, tacit knowledge, social control and reciprocity. Recent research considering actors attributes in the network also indicated the importance of reach, richness and receptivity as measures of network resources (Gulati et al., 2011). hese properties establish a pattern of clustering in the network. he formation of tightly interconnected cliques suggests processes of diferentiation into subgroups, and changes in these groups may represent the reconiguration of competing constellations, discontinuities in the technologies used in the network or shifts in its power structures (Ahuja, Soda, & Zaheer, 2012). A combination of these measures and the attributes of automotive assemblers, used as relational capital metrics of speciic companies and groups, may provide the basis to the analysis of the structure of ields. he current study will focus on identifying the most central actors and group formations, by analyzing relationships such as cross-shareholding, joint ventures, manufacturing contracts and alliances.
he study also considered network analysis metrics such as centrality, group and network densities. An algorithm based on non-normalized network was selected to calculate group metrics and its graphical representation.
3
Research method
he research method used is descriptive and exploratory (Bervian & Cervo, 1996). Quantitative data was used to describe cross-shareholdings, joint ventures, manufacturing contracts and alliances, from 2004 to 2012. Data
was not updated from 2012 until today because the Automotive News database has not published the new relationships (cross-shareholdings, joint ventures, manufacturing contracts and alliances) among companies for the last years.
he exploratory design is appropriated to address topics with few or no previous study (Collins & Hussey, 2005) and patterns, ideas or hypothesis to be tested need still to be elaborated. he study is also a descriptive research, aiming to identify and gather information about the features of automotive industry (Collins & Hussey, 2005). he compiled data is quantitative and the statistical techniques will be used for assessing data.
3.1
Data collection
he irst step was gathering data of cross-shareholdings, joint ventures, manufacturing contracts and alliances in the automotive industry from 2004 to 2012. Data was obtained from Automotive News, OICA (International Organization of Motor Vehicle Manufacturers) specialized publications and oicial information released by the companies. Connections involving several countries were addressed.
An intermediate data preparation process was conducted on the VantagePoint platform [www.theVantagePoint.com] in order to get the collected data prepared to build networks and their metrics. A thesaurus was developed to group node names into a standardized list of node names. his feature was applied to the complete set of identiied nodes (plants, family investors, banks, pension groups, municipalities, governments, automakers, joint ventures, alliances etc.) and categories (countries and technologies).
3.2
Population and sample
to OICA, which represents 90% of the units produced worldwide. A composition of formal relationships (such as ownership, joint venture, assembly contract and technical alliances) and produced units was taken into consideration to include the automaker or to exclude it from the list. Only small automakers without global operation were kept out of the network map chart.
he data collection method provided more than 98% relational and nodal representativeness in comparison to OICA’s ranking. This was because, throughout the data collection process, it was considered that all declared alliances – technical/parts, joint venture, assembly contracts and ownership – should be understood as a relationship between automakers. By applying this ratio, it was possible to collect nodes from the abovementioned list. he list was the main reference, however, in the end, the found nodes were based on production plants, family investors, banks, pension groups, municipalities (in China and Germany for instance), governments (China, the USA, Canada, France, etc.), joint ventures, alliances (based on joint venture, third party contracts, ownership, etc.) and so on. Then, even with a starting point of 21 to 25 nodal automakers, the current study achieved more than 95% nodal representativeness in comparison to the annual OICA ranking of automakers.
he amount of interactions in the sampling was 3695 from 2004 to 2012. he number could vary from 230 to 400 relationships per year. his is a scale free network, which means that alliances such as DaimlerChysler were terminated and those such as FiatChrysler were created throughout this period. hus, a single node was converted in two nodes and then collapsed into one node again. his led us to certain diiculties in making individual comparisons, which were overcome by using general network metrics and group algorithms based on time stability.
3.3
Data assessment
The construction of the sociograms allowed the visualization of the structure, the
relationships and the positions of the assemblers in the network. Networks were presented using the GEPHI software1 (Bastian, Heymann &
Jacomy, 2009). he constellations involve groups of companies with formal or informal cooperation agreements that compete against other groups in the same or in a similar industry (Lazzarini, 2008). Once the nodes and categories were standardized, the VantagePoint platform was used to produce the matrix of Automaker X Automaker through the logics of co-occurrence over the list of relationships (node, node; categories). Each pair of matrix was established considering the following periods: (i) 2004-2006, (ii) 2007-2009 and (iii) 2010-2012.
Based on the tabulated data, it was possible to assemble networks using Gephi and UCINET software. Metrics such as centrality, group density and network density were then calculated. To do so, an algorithm based on non-dichotomized networks was used. his is the stability principle of a partition which:
measures the quality of a partition [group] in terms of the properties of a stochastic process applied on the graph, [in which] stability is based on flows of probability on the graph and therefore captures how the global structure of the system constrains patterns of flow (Lambiotte, Delvenne, & Barahona, 2008, pp. 3-4).
It means that the strength of the ties is seen as patterns, which drive the quality of partitions (group), instead of the traditional modularity based on dichotomized interactions. Another property of the quality is that it is equal to modularity when it is applied to a dichotomized network.
4
Research results
study aiming to generate relections about the automotive field dynamics. Thus, item 4.1 presents the sample’s density and modularity data. Item 4.2 presents the actors who are more or less central in the networks. he following section focuses on the main groups and on the formation of constellations and coalitions. Finally, the study explores how social capital operates as resource to the actors in the ield.
4.1
Networks density and modularity
Network density decreased along the three periods, as illustrated in Table 1. It means that many network ties were dissolved between 2007 and 2009. he density decreased sharply before the 2008 inancial crisis. At the same time, the network modularity increased, which indicates intense formation and definition of groups. Data revealed that the concentration process and the dynamics of the automotive industry are associated with the composition of strategic groups and not necessarily with the overall density. he industry is organized in groups and coalitions, which suggests increasing concentration of the ield through the formation of diferent ties, such as joint ventures, mergers, alliances and manufacturing agreements.
In practice, what seems to have occurred between 2007 and 2009 was a decrease in the number of new alliances and a greater focus on assembly contracts. Groups tend to disappear when the dynamism of alliances decreases. On the other hand, the increase in assembly contracts imply in a reduction of the number of production plants, which afects the number of network nodes and increases the entanglement among automakers. hus, slower pace partnerships, fewer network nodes and greater sharing of production lines eventually increased the entanglement between automakers, thereby increasing the total network density. he periods of 2004-2006 and 2010-2012 were times of stability and showed similar relationships between modularity and density.
Based on this regular distribution, the exploratory analysis favored the study of relational
structure in a period right before, during and after the crisis. he year of 2013 was kept out of the analysis to assure the homogeneity in the global metrics in the three years periods.
Network density of approximately 1.2% was stable in the irst period (2004, 2005 and 2006). It increased to 1.4% in the second period (2007, 2008 and 2009), but decreased during the crisis. Finally, density dropped to 1.0% in the third period (2010, 2011 and 2012) and then stabilized.
Table 1
Density and modularity
2004-2006 2007-2009 2010-2012
Graph density 1.2% 1.4% 1.0% Modularity 70.2% 63.2% 70.4%
According to this sample, the reduction in the overall density from 2004 to 2012 indicates a reduction of possible relationships among network actors. Therefore, the automotive industry faced a disaggregation process in this period, and the network became more dispersed. At the same time, as shown in figure 1, the modularity increased, indicating the formation and better deinition of groups. he 2008 crisis was key to the ield reconiguration. Curiously, before 2008, network density decreased and a new pattern was established after the crisis. Along this period, some companies got stronger and others lost positions. New groups were established and forces in the ield were reorganized. Next section assesses how companies’ centrality changed along the period.
4.2
Network centrality: companies’ level
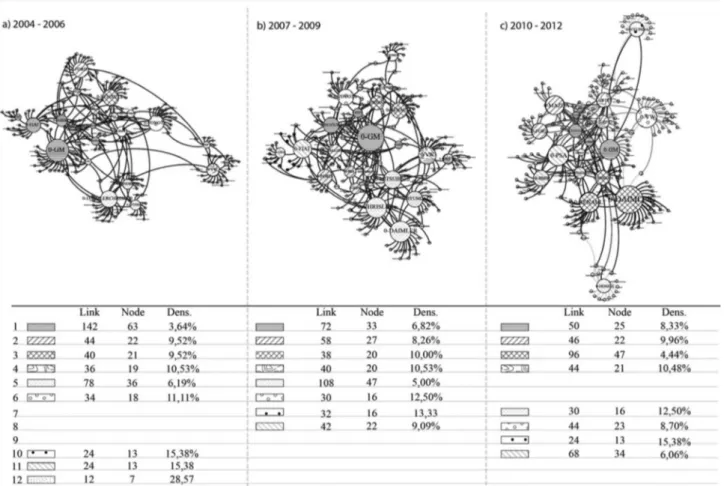
Figure 1. Infographic of strategic groups
between the irst and second periods and increased back between the second and third periods (from 2010 to 2012).
Volkswagen, diferently from GM and
Toyota, increased its centrality throughout the three periods. Actually, in 2014, the company also became the largest automotive company worldwide. he intermediation degree decreased from the irst (2004 – 2006) to the second period (2007-2009), but it increased back in the following period (2010-2012). he eigenvector centrality and the clustering coefficient significantly increased from the irst to the second period, but it decreased a little in the third one (2010-2012).
Hyundai’s centrality increased from the
irst (2004-2006) to the second period (2007-2009) and faced a small decrease in the third period (2010-2012). Its intermediation degree increased throughout the three periods. As for the eigenvector, it increased in the course of the second period (2007-2009) and decreased in the
General Motors had the higher number
of relationships (degree) in the irst two periods. However, it lost degree, betweenness and eigenvector from the second period on (during the crisis) and in the third period. he cluster coeicient index signiicantly increased in the second period and remained stable in the third one. GM was strongly associated with Fiat and Suzuki in the irst period. In the second period, it broke its ties with Fiat. In the second period, GM was strongly associated with Suzuki and Isuzo and it was the central company in the network. GM lost some centrality in the third period, and Daimler became the most central company. According to results from the algorithm, GM used its relationship with Isuzo to approach Toyota, and they started acting in the same group.
Toyota had signiicant degree in the irst
third period (2010-2012). he cluster coeicient got substantially higher and then dropped to zero in the third period. Hyundai became relatively autonomous in its ties in the third period (2010-2012). he trajectory of Hyundai’s assembly plant began as deined by the group, which occupied the 10th place in the OICA ranking of produced units and reached the 4th place in OICA ranking as an independent automaker.
Renault-Nissan kept investing in
cooperative relationships. In 1999, Renault group acquired 44% of Nissan capital participation. Individually, Renault kept a stable centrality degree, showing small decrease between the irst (2004-2006) and the third periods (2010-2012). In terms of intermediation degree, eigenvector decreased in the irst period (2004-2006) and increased in the sequence. Its cluster coeicient increased over the three periods. As for Nissan, the centrality degree increased between the irst (2004-2006) and the second periods (2010-2012). he intermediation and the eigenvector increased between the irst and second periods. Nissan’s cluster coeicient was impressively high, as that of Isuzu.
Ford’s centrality, intermediation and
eigenvector degrees decrease from the ist (2004-2006) to the second periods (2007-2009). In the third period (2010-2012), centrality remained
stable and there was increase in intermediation and eigenvector metrics. As for the clustering coeicient, Ford improved from the irst (2004-2006) to the second period (2007-2009) and this index remained stable in the passage to the third period (2010-2012).
4.3
Groups and networks
he current item explores the following question: What are the strategic groups? Do the sub-groups become denser? In order to do so, the current study used the algorithm developed by Lambiotte, Delvenne and Barahona (2008), which structures the groups by considering the weight of connections, in contrast to the existing literature, which was entirely focused on grouping nodes. hus, instead of assuming that a community is a set of nodes with many links between them, the current study considers a community to be a set of closely interrelated links (Ahn, Bagrow, & Lehmann, 2010). Based on this algorithm, data revealed a change in the groups over the three periods. Certain groups became bigger and others were dissolved. In terms of number of ties, during the last period 2010-2012, the main subgroups along the periods were those highlighted in Groups 1 and 3. Group 5 operated during the irst two periods and disappeared in the third one, due to Daimler-Chrysler dissolution.
Table 2
Network centrality metrics
Automaker Year Degree Betweenness Eigenvector Clustering Coef.
BMW AG
2004-2006 13 2227 0.0139 0.0256
2007-2009 11 1184 0.0188 0.1273
2010-2012 16 2670 0.0164 0.0167
CHRYSLER GROUP
2004-2006 2 - 0.0058 1.0000
2007-2009 23 3244 0.0380 0.0909
2010-2012 7 1466 0.0067
-DAIMLER AG
2004-2006
2007-2009 23 2966 0.0315 0.0593
Automaker Year Degree Betweenness Eigenvector Clustering Coef.
DAIMLERCHRYSLER AG
2004-2006 23 6702 0.0265 0.0237
2007-2009 1 - 0.0036
-2010-2012
DONGFENG MOTOR CORP.
2004-2006 9 1234 0.0086 0.0556
2007-2009 8 2003 0.0070 0.0714
2010-2012 3 362 0.0052
-FAW
2004-2006 8 1157 0.0009
-2007-2009 5 647 0.0045
-2010-2012 6 957 0.0146 0.1333
FIAT S.P.A.
2004-2006 20 4336 0.0239 0.0105
2007-2009 20 3854 0.0234 0.0368
2010-2012 15 3246 0.0218 0.0381
FORD MOTOR CO.
2004-2006 21 3815 0.0114 0.0048
2007-2009 16 1860 0.0150 0.0417
2010-2012 16 2381 0.0186 0.0417
FUJI HEAVY INDUSTRIES LTD.
2004-2006 8 744 0.0169 0.0714
2007-2009 3 228 0.0051
-2010-2012 4 408 0.0074
-GENERAL MOTORS
2004-2006 32 9192 0.0537 0.0141
2007-2009 30 5202 0.0401 0.0437
2010-2012 21 2892 0.0357 0.0429
HONDA MOTOR CO.
2004-2006 10 1404 0.0131
-2007-2009 11 1576 0.0012 0.0182
2010-2012 14 1971 0.0021
-HYUNDAI MOTOR CO.
2004-2006 13 2037 0.0087 0.0128
2007-2009 17 2252 0.0203 0.0441
2010-2012 15 2559 0.0089
-ISUZU MOTORS LTD.
2004-2006 6 488 0.0152 0.0667
2007-2009 9 807 0.0239 0.3611
2010-2012 8 424 0.0245 0.3571
MAZDA MOTOR CORP.
2004-2006 9 1675 0.0135 0.0833
2007-2009 14 1490 0.0220 0.1429
2010-2012 20 4227 0.0301 0.0684
MITSUBISHI MOTORS CORP.
2004-2006 13 1913 0.0122 0.0385
2007-2009 19 2762 0.0372 0.1345
2010-2012 11 1870 0.0200 0.0727
NISSAN MOTOR CORP.
2004-2006 11 1697 0.0196 0.1091
2007-2009 15 3183 0.0286 0.1429
2010-2012 15 2934 0.0344 0.1429
PORSCHE AG
2004-2006 6 1045 0.0013
-2007-2009 10 1392 0.0052 0.0222
2010-2012 4 200 0.0030 0.3333
PSA/PEUGEOT-CITROEN SA
2004-2006 9 1503 0.0099 0.0278
2007-2009 12 2872 0.0195 0.0606
Automaker Year Degree Betweenness Eigenvector Clustering Coef.
RENAULT SA
2004-2006 22 3793 0.0246 0.0130
2007-2009 17 2565 0.0130 0.0147
2010-2012 21 3471 0.0301 0.0286
SAIC
2004-2006 7 234 0.0078
-2007-2009 7 596 0.0094 0.0476
2010-2012 3 292 0.0070
-SUZUKI MOTOR CORP.
2004-2006 15 1864 0.0279 0.0762
2007-2009 17 2155 0.0319 0.1324
2010-2012 13 3016 0.0334 0.1667
TATA MOTORS
2004-2006 7 1251 0.0039
-2007-2009 10 1430 0.0035
-2010-2012 6 985 0.0031
-TOYOTA MOTOR CORP.
2004-2006 21 3802 0.0219 0.0048
2007-2009 17 2391 0.0117 0.0074
2010-2012 13 1912 0.0217 0.0641
VOLKSWAGEN AG
2004-2006 17 4526 0.0081
-2007-2009 19 3262 0.0226 0.0409
2010-2012 22 3830 0.0173 0.0130
Group 1, composed of companies such as GM and Fiat, was clearly the dominant one in terms of ties and nodes in the irst period (2004-2006). In the second (2007-2009) and in the third periods (2010-2012), this group went through a sharp decrease in the number of ties and nodes, probably as a result of the 2008 inancial crisis. Fiat left the group in the second period, and a second force emerged from the association between Fiat and Tata, which is highlighted as Group 8. his group improved its position in the third period, mobilizing more ties and actors with Chrysler and Suzuki.
Group 3 also had signiicant increase in the number of ties due to the introduction of Daimler in the third period (2010-2012). Initially formed by Renault-Nissan, the number of actors and connections composing the group increased one hundred percent with the Daimler’s arrival, which brought all the connections previously associated with the Group 5 and strongly modiied the structure of the Group 3 in the third period (2010-2012).
he Group 5 was initially composed of Daimler, Mitsubishi and Hyundai and it increased
the number of ties and actors in the second period (2007-2009) but it disappeared in the third period (2010-2012) due to Daimler-Chrysler dissolution. Mitsubishi got associated with Group 10 and Hyundai formed a new group in the third period (2010-2012), which is highlighted in Group 9. his Group 9 lost centrality in the passage to the third period (2010-2012).
The number of ties in Group 2 also increased over the entire period. This was a relatively stable group led by Ford and Mazda. In the second period (2007-2009), its number of ties increased when PSA, BMW and Mitsubishi joined the group, but it dropped down a little in the third period (2010-2012). In general, it remained stable from the second to the third periods. In the irst one, the group already held PSA and Mitsubishi, but it became stronger in the third and second one (2006-2009), according to this sampling.
Group 6 was very inluenced by Toyota. It lost actors and relationships from the irst to the second periods. In the third one, it approaches Group 1, when Toyota and GM became more connected. Here, we see a possible joining of GM and Toyota for the 2010-2012 period, when joint ventures were established with the Chinese FAW.
Certain groups were more stable in terms of their relationship structure and their density presented less variation. hey had more stable social capital strategies along the considered period. This is the case of the group led by Volkswagen (4) and the one led by Ford (2). Group 3 was the most unstable group over the period, and it went through a major change when Daimler approached Renault-Nissan.
PSA, BMW and Mitsubishi formed a new group in the third period, Group 10. It was established in irst period with PSA and BMW; it disappeared in the second and re-emerged in the third period with the participation of Mitsubishi.
In terms of cluster coeicient, the best positioned companies are those associated with Chrysler and Nissan in the first period and, associated with Group 3 afterwards. In the second period, Isuzu’s (Group 1), Nissan’s (Group 3) and Suzuki’s (Group 1) cluster coeicients were particularly impressive. In the third period, the indexes of Porsche (Group 7), Isuzu (Group 1) and Nissan (Group 3) were the highest ones. hese companies had greater level of inluence over their neighboring peers, as defined by UCINET (2014).
4.4
Social capital and ields
he automotive industry may be studied as a ield, in which companies such as Toyota, General Motors, Volkswagen, Ford and Hyundai dispute for market space. Emergent companies, such as Dongfeng, Faw, Saic and Tata, also play an important role as international partners and network intermediates. As it is possible to see in the network index, these challenger companies have high degree of intermediation (betweenness centrality) and work as bridges to emergent
markets and other production platforms.
Among the incumbent companies, Hyundai, Volkswagen and Renault-Nissan stand out mostly in terms of their position in social networks. Hyundai, for instance, was established in the 1960’s and, nowadays, it is the fourth biggest assembler in the world. he Hyundai-Kia relationship (acquired in 1998) also generated positive results to the Korean group. he three companies presented certain positive relationship between network indexes and their growth over the period.
he automotive ield had been through important changes along the considered period. Actors were involved in a complex game and strategies with several challenges. Currently, this industry has excessive production capacity, high ixed costs, energetic and other technological challenges and demands for environmental and mobility solutions. he ield also competes with other arenas, such as the airline, railway and shipbuilding sectors. Incumbent actors establish strategies to keep their ield domain and expand their markets in order to address these challenges. One of these strategies consists of establishing alliances with other companies to assure their access to and control over certain resources.
Social capital may be converted into other resources along with reconiguration of the global automotive industry. hese relationships may assure access to markets, new production forms, new design and manufacture technologies, cost reductions, institutional domain, among other capitals. Networks do not represent the ield, but they may be used to measure the distribution of relational resources that afect the dispute in the arena. hus, networks may help understanding the formation of coalitions within the ield, which afects the control conditions and the shared meanings that organize the social space. he longitudinal study of networks may also indicate the existence of stability and change in the ield.
maintain relationships with other actors. hese relationships have an intersubjective efect and inluence the development of shared meanings that organize the ield. Companies also tend to imitate alliance strategies understood as successful, especially those of the incumbents, in a process of mimetic isomorphism. If one thinks social skill as habitus, one can infer a positive meeting predisposition in the 2007-2009 period. As previously mentioned, there was higher share of production lines, fact that eventually increased the entanglement between automakers in this period. Establishing a production line requires predisposition to accept competitive technologies.
Network data also reveals the increasing inluence of inancial actors, such as JP Morgan and Bank of Japan, as intermediate actors in the automotive industry. Another interesting point is related to the emergence of new technologies. Data shows that the number of partnerships organized around sustainable solutions significantly increased in the studied period. herefore, funding and sustainability appear to have signiicant inluence on actors’ behaviors in the ield and they might be determinant to the disputes unfolding in the space.
5
Discussion
he automotive industry goes through intense geographic, technological and environmental change processes. Sturgeon,
Memedovic, Biesebroeck and Gerei (2009) mention some modiications associated with this industry: 1) Increased direct investment (FDI) in developing countries by cross-border trade; 2) more value chain activities in supplier irms; 3) inal vehicle assembly kept close to end markets; 4) Strong regional structures; 5) customization; and 6) small number of giant companies exert power over smaller irms. hese features stimulate the sharing of vehicle platforms among different models. Thus, cross-shareholdings, joint ventures, manufacturing contracts and alliances are fundamental to understand the industry dynamics.
he global overcapacity in the industry also stimulates the formation of groups and alliances. Each business group holds some types of complementary resources and certain geographical locations, as highlighted by Lavie (2007). hus, the relationship between companies forms a capital that can streamline a signiicant number of resources (Gulatti, 2007; Powell & Smith-Doer, 1994). hese connections create groups, coalitions between companies and may generate important positions in the structure of relationships and industry domain.
M o r e c e n t r a l a c t o r s d o m i n a t e information lows. Certain groups can articulate complementary resources and generate relative impact on the competition between groups, as shown in the indings of Casseres (2003) and Das and Teng (2002). he companies’ associative logic is afected by the composition of the groups, as highlighted by the network indices of modularity. Modularity indicates greater deinition in the composition of groups. Interestingly, as shown in Table 1, the period of greatest modularity degree in the sample was the second period (2006-2009), during the 2008 crisis. hus, the 2008 crisis was crucial for the rise and fall of some organizations and new business groups. During this period, many eforts were made to share online platforms among companies when the number of assembly contracts signiicantly increased. hen, the results suggest that powerful actors (organizational and interpersonal) had to build new coalitions, and group in order to keep their advantages during the crisis, using their social skills (Fligstein & McAdam, 2012). hey also sought to manipulate symbols, identities and meanings structuring action in the ield to induce cooperation.
with successful performances in world vehicle production in the last five years. According to OICA’s data, Hyundai and VW have been growing consistently since 2005, and Renault started gaining market especially from 2009 on.
In this regard, survey results point towards the formation of strategic groups, coalitions or company constellations (Casseres, 2003; Das & Teng, 2002; Lazzarini, 2008; Powell, 1990). hese groups allow access to diferent resources, such as technology, global platforms, design and other important resources. In addition, intermediary companies - such as Chinese companies - helped connect major manufacturers - such as FAW-, which mediated the relationship between GM and Toyota in the third period (2010-2012).
he idea of social skills can be scaled up to organizations and not necessarily to people, despite the fact that they always originate in individuals and are activated by them. To build and transform networks, individuals have to act inside organizations to build coalitions that may coordinate strategic organizational action. This is achieved by creating shared believes that accommodate the different conceptions coexisting in organizations and that should orient the construction of interactions with external social actors (Fligstein & McAdam, 2012). Socially skilled individuals may even create shared conceptions orienting others to behave strategically, building what would resemble an organizational social skill. hese skilled organizations should orient, for example, individuals in key positions to be attentive to the possibilities of building new interactions in order to accumulate social capital more systematically. Managers and executives must develop their interpersonal skills to orient the building of organizational networks and these social skills at individual and corporate social skill level are highly interrelated. Obviously, relationships associated with these networks are commonly agreements between two or more legal entities. To execute these agreements, it is necessary that members of the managerial elite agree with the
contractual terms. So, contractual relations among companies somehow relect the corporate social skills constructed by individuals.
6
Final remarks
It can be inferred that the industry operates in a type of constellation, in which companies tend to keep bilateral relationships with others in the same group as part of their strategy to gain position in the ield. However, connections are relatively dynamic and they signiicantly changed during the studied period. It is possible to see how the social skills and the willingness to work together with an “enemy” are evident in the data.
In this sense, the industry needs to compose complementary relationships in diferent markets in order to internationalize production and sales structures. his dynamic international business is streamlined by the composition of groups. he generated capital can then support several key features for the dominant players in the ield, but high intermediation actors such as the Chinese, may compose an important type of capital to access such markets.
The paper illustrates that relational resources are very important in today’s competitive arenas and that the connections among companies are dynamic, and may face drastic changes in contentious periods. Managers have to be social skilled to understand the movements occurring in the ield and to build coalitions capable of supporting organizational strategies. In other terms, the ability to induce cooperation in highly competitive settings appears to be an increasingly important skill for managers.
the structure of networks. In a highly competitive environment, relational resources are valuable to acquire and retain other resources, such as technological capabilities, managerial expertise, access to domestic markets and governments, access to privileged information, and so on. So, social skills are demanded to build networks and to reconigure their structures. As the results of our longitudinal research show, coalitions of organizations have to be created and re-created continuously and, to interfere in the process, actors must be able to continuously identify new opportunities to improve their positions. he position in the ield can be supported partially by networks positions. he relationships among competitors and partners in the ield are also a key strategic asset capable of generating other changes in the ield.
From a theoretical point of view, the study presents the analytical potential of social network analysis, composed longitudinally. Without the use of this method, it would have been impossible to map such high volume of relationships. In this sense, social network analysis is elementary for the study of contemporary organizational phenomena, whether in intra-organizational, inter-organizational and ield level.
Network analysis is a powerful method to analyze the structural change of a ield. However, it is worth understanding that the anti-categorical imperatives of strict network assessment does not ofer appropriate theoretical tools to understand the way actors interpret and act in the game in which they are inserted (Emirbayer & Goodwin, 1994). A way to deal with this limitation is to articulate and orient its usage by ield theories as the ones used here. For the analysis of ields, it is necessary to deepen the intersubjective ield structures, and to understand the relationship between actors occupying different positions in competitive arenas. Either way, data revealed interesting dynamics such as the composition and prominence of groups and companies, suggesting that the generated social capital is increasingly important in economic ields.
Some questions arise from the research: do groups support internationalization? How can the central companies beneit from their position? How can intermediation companies inluence the network dynamics? What are the resources obtained by companies and groups? Is social capital a key resource to get another resource in the ield? hus, there are too many eforts to develop complementarity in group, network and ield studies. Far from closing the debate, further research on the relationship among groups and ields is important for advancing in the understanding of the contemporary economic and organizational dynamics.
References
Ahn, Y. Y., Bagrow, J. P., & Lehmann, S. (2010). Link communities reveal multi-scale complexity in networks. Nature, 466, 761-764.
Ahuja, G., Soda, G., & Zaheer, A. (2012). The genesis and dynamics of organizational networks. Organization Science, 23(2), 434-448.
Bastian, M., Heymann, S., & Jacomy, M. (2009). Gephi: An open source software for exploring and manipulating networks. Proceedings of the hird International ICWSM Conference, San Jose, California, USA.
Berkowitz, S. D. (2013). An introduction to structural analysis: he network approach to social research. Toronto: Butterworth.
Bervian, P. A., & Cervo, A. L. (1996).Metodologia cientíica. São Paulo, SP: Makron Books.
Boltanski, L., & Chiapello, È. (2009). O novo espírito do capitalismo. São Paulo: Martins Fontes.
Borgatti, S. P., & Li, X. (2009). On social network analysis in a supply chain context. Journal of Supply Chain Management, 45(2), 5-22.
research for the sociology of education (pp. 241-258). New York, NY: Greenwood.
Bourdieu, P. (2005). he social structures of the economy. Cambridge, MA: Polity Press.
Bourdieu, P., & Wacquant, L. (1992). An invitation to relexive sociology. Cambridge, MA: Polity Press.
Carpenter, M. A., Li, M., & Jiang, H. (2012). Social network research in organizational contexts a systematic review of methodological issues and choices. Journal of Management, 38(4), 1328-1361.
Casseres, B. G. (2003). Competitive advantage in alliance constellations. Strategic Organization, 1(3), 327-335.
Collins, J., & Hussey, R. (2005). Pesquisa em administração. Porto Alegre: Bookman.
Das, T. K., & Teng, B. S. (2002). Alliance constellations: A social exchange perspective.
Academy Management Review, 27(3), 445-456.
Davis, G. F. (2009). Managed by the markets: How inance re-shaped America. Oxford: OUP.
Davis, G. F., Diekmann, K. A., & Tinsley, C. H. (1994). he decline and fall of the conglomerate irm in the 1980s: he deinstitutionalization of an organizational form. American Sociological Review, 59(4), 547-570.
DiMaggio, P. J., & Powell, W. W. (1983). he iron cage revisited: Institutional isomorphism and collective rationality in organizational ields.
American Sociological Review, 48(2), 147-160.
Donadone, J. C. (2004). Dinâmica organizacional, crescimento das consultorias e mudanças nos conteúdos gerenciais nos anos 90. Produção, 14(2), 58-69.
Emirbayer, M., & Goodwin, J. (1994). Network analysis, culture, and the problem of agency.
American Journal of Sociology, 99(6), 1411-1454.
Fligstein, N. (1991). The transformation of corporate control. Cambridge, MA: Harvard
University Press.
Fligstein, N., & McAdam, D. (2012). A theory of ields. New York: OUP.
Garcia-Pont, C. E., & Nohria, N. (2002). Local versus global mimetism: he dynamics of alliance formation in the automobile industry. Strategic Management Journal, 23(4), 307-321.
Gomes-Casseres, B. (2003). Competitive advantage in alliance constellations. Strategic Organization, 1(3) 327-335.
Granovetter, M. S. (1985). Economic action and social structure: he problem of embeddedness.
American Journal of Sociology, 91(3), 491-501.
Grün, R. (1999). Modelos de empresa, modelos de mundo: Sobre algumas características culturais da nova ordem econômica e da resistência a ela. Revista Brasileira de Ciências Sociais,14(41), 121-140.
Gulati, R. (2007). Managing network resources: Alliances, ailiations and other relational assets.
Oxford: OUP.
Gulati, R., Lavie, D., & Madhavan, R. R. (2011). How do networks matter? The performance efects of interorganizational networks. Research in Organizational Behavior, 31, 207-224.
Knoke, D., & Yang, S. (2008). Social network analysis. 2nd ed. housand Oaks: SAGE.
Lambiotte, R., Delvenne, J. C., & Barahona, M. (2008). Laplacian dynamics and multiscale modular structure in networks. IEEE Transactions on Network Science and Engineering, 1(2), 76-90.
Lavie, D. (2007). Alliance portfolios and irm performance: A study of value creation and appropriation in the US software industry. Strategic Management Journal, 28(12), 1187-1212.
Lazzarini, S. G. (2008). The transition from alliance networks to multilateral alliances in the global airline industry. Brazilian Administration Review, 5(1), 19-36.
Lazzarini, S. G., & Joaquim, T. A. Z. (2004). A formação de constelações: O caso da indústria global de transporte aéreo. Revista de Administração de Empresas, 44(2), 11-25.
Li, D., Eden, L., Hitt, M. A., Ireland, R. D., & Garrett, R. P. (2012). Governance in multilateral R&D alliances. Organization Science, 23(4), 1191-1210.
Lin, Z. J., Yang, H., & Arya, B. (2009). Alliance partners and firm performance: Resource complementarity and status association. Strategic Management Journal, 30(9), 921-940.
Mahmood, I. P., Zhu, H., & Zajac, E. J. (2011). Where can capabilities come from? Network ties and capability acquisition in business groups. Strategic Management Journal, 32(8), 820-848.
Menard, C. (2013). Hybrid modes of organization. Alliances, Joint Ventures, Networks, and other’strange’animals. In R. Gibbons & J. Roberts (2013). he handbook of organizational economics (pp. 1066-1108). New Jersey: Princeton University Press.
Nohria, N., & Garcia-Pont, C. (1991). Global Strategic linkage and industry structure. Strategic Management Journal, 12(S1), 105-124.
Nooy, W. D. (2003). Fields and networks: Correspondence analysis and social network analysis in the framework of ield theory. Poetics,
31(5-6), 305-327.
Pfefer, J., & Salancik, G. R. (2003). he external control of organizations. Stanford, CA: Stanford
University Press.
Powell, W. W. (1990). Neither market nor hierarchy: Network forms of organization.
Research in Organizational Behavior,12, 295-336.
Powell, W. W., & DiMaggio, P. J. (1991). he new institutionalism in Organizational Analysis.
Chicago, IL: University of Chicago Press.
Powell, W. W., & Smith-Doer, L. (1994). Networks and economic life. In N. J. Smelser, & R. Swedberg. The handbook of economic sociology (pp. 379-402). Princeton, NJ: Princeton
University Press.
Rowley, T., Behrens, D., & Krackhardt, D. (2000). Redundant governance structures: An analysis of structural and relational embeddedness in the steel and semiconductor industries. Strategic Management Journal, 21(3), 369-386.
Sacomano, M., Neto, & Truzzi, O. M. S. (2009). Posicionamento estrutural e relacional em redes de empresas: Uma análise do consórcio modular da indústria automobilística. Gestão & Produção, 16(4), 598-611.
Scott, J. (2012). Social network analysis. London: Sage.
Shi, W. S., Sun, S. L., Pinkham, B. C., & Peng, M. W. (2014). Domestic alliance network to attract foreign partners: Evidence from international joint ventures in China. Journal of International Business Studies, 45(3), 338-362.
Sturgeon, T. J., Memedovic, O., Biesebroeck, J. V., & Gerei, G. (2009). Globalization of the automotive industry: Main features and trends.
International Journal of Technological Learning, Innovation and Development,2(1/2), 7-24.
Swedberg, R. (2004). Sociologia econômica: Hoje e amanhã. Tempo Social, 16(2), 7-34.
Tate, W. L., Ellram, L. M., & Gölgeci, I. (2013). Difusion of environmental business practices: A network approach. Journal of Purchasing and Supply Management, 19(4), 264-275.
Note
1 Gephi is an open source software for graph and network analysis
Supporting agencies: Brazil’s National Council for Scientiic and Technological Development (Conselho
Nacional de Desenvolvimento Cientíico e Tecnológico, CNPq) and São Paulo Research Foundation (Fundação de Amparo à Pesquisa do Estado de São Paulo, FAPESP)
About the authors:
1. Mário Sacomano Neto, PhD in Production Engineering at Federal University of São Carlos, Brazil.
Email: msacomano@ufscar.br
2.Paulo Cesar Matui, PhD student in Production Engineering at Federal University of São Carlos, Brazil.
Email: paulo.matui@gmail.com
3.Silvio Eduardo Alvarez Candido, PhD in Production Engineering at Federal University of São Carlos,
Brazil. Email: seacandido@ufscar.br
4.Roniberto Morato do Amaral, PhD in Production Engineering at Federal University of São Carlos,
Brazil. Email: roniberto@ufscar.br
Contribution of each author:
Contribution
Mário Sacomano
Neto
Paulo Cesar Matui
Silvio Eduardo
Alvarez Candido
Roniberto Morato do Amaral
1. Deinition of research problem √ √
2. Development of hypotheses or research questions (empirical
studies ) √ √
3. Development of theoretical propositions (theoretical Work) √ √ √
4. heoretical foundation/Literature review √ √ √
5. Deinition of methodological procedures √ √ √ √
6. Data collection √ √
7. Statistical analysis √ √ √
8. Analysis and interpretation of data √ √ √ √
9. Critical revision of the manuscript √ √ √ √
10. Manuscript Writing √ √ √ √