FACULDADE DE
ENGENHARIA DA
UNIVERSIDADE DO
PORTO
Drill-down Dashboard for Coordination
of Master Programmes in Engineering
Anabela Costa e Silva
Mestrado Integrado em Engenharia Informática e Computação Supervisor: Leonel Morgado
Supervisor: António Coelho
Drill-down Dashboard for Coordination of Master
Programmes in Engineering
Anabela Costa e Silva
Mestrado Integrado em Engenharia Informática e Computação
Abstract
Online masters program coordinators need information promptly to monitor efficiently and effec-tively all the courses in the program they are responsible for.
Learning Management Systems(LMS) supporting the operation of the online programme col-lect vast amounts of data about the learning process. These systems are geared to support teachers and students, and not to support master program’s coordinators in their monitor role.
Thus, it is proposed to create a dashboard that provides master program’s coordinators with information relevant to their tasks. This information is aggregated (from all courses), contributing to improving decision making.
This dissertation begins by presenting the bibliographic review of the related works in the areas of "Learning Dashboards" and "Learning Analytics". It describes the design and development of a dashboard to support the coordinators of master programs. It includes requirements gathering, through interviews, to determine the relevant tasks of the master program coordinators and the information to be used. It also includes an analysis of the data currently available in the LMS that can provide this information and a description of the prototyping process.
Keywords: Learning Management Systems; Virtual Learning Environment; Program Coordi-nation; Data Visualization; Learning Analytics;
Resumo
Os Coordenadores de Cursos de Mestrado Online para supervisionarem, de forma eficiente e efi-caz, todas as unidades curriculares existentes no curso de que são responsáveis, necessitam de informação, em tempo oportuno.
Os Sistemas de Gestão de Aprendizagem (Learning Management Systems, LMS) usados no decorrer de um curso online acumulam grandes quantidades de dados sobre os processos de apren-dizagem. Estes sistemas foram concebidos para apoiar estudantes e professores e não para apoiar os Coordenadores de Mestrado na sua função de supervisão.
Assim, propõem-se a criação de um painel de instrumentos que forneça aos coordenadores de curso, informação relevante para as suas tarefas. Esta informação é agregada (todas as unidades curriculares), contribuindo para melhorar a tomada de decisão.
Esta dissertação apresenta a revisão bibliográfica dos trabalhos relacionados nas áreas de “Learning Dashboards” e “Learning Analytics”. Descreve o desenho e desenvolvimento de um painel de instrumentos para apoiar os coordenadores de cursos de mestrado. Inclui a recolha de requisitos, através de entrevistas, para determinar as tarefas relevantes dos coordenadores de mestrado e a informação a ser utilizada. Também inclui uma análise dos dados atualmente disponíveis nos LMS que podem fornecer essa informação, e a descrição do processo de prototi-pagem.
Acknowledgements
Firstly, I would like to thank my supervisors, Professor Leonel Morgado and Professor António Coelho, for all the support and guidance, their effort and help were invaluable to me in the devel-opment of this thesis.
I also extend a word of appreciation to all the master program coordinators who took the time to answer my questions and give me feedback on my work, especially the ones who could participate in the interviews.
Lastly, I couldn’t forget to thank my family and friends for the continuous support, not only for this thesis but in all my goals.
To all my sincere thanks!
Anabela Silva
“A good system shortens the road to the goal”
Orison Swett Marden
Contents
1 Introduction 1 1.1 Context . . . 1 1.2 Motivation . . . 1 1.3 Objectives . . . 2 1.4 Document Structure . . . 22 State of the Art 3 2.1 Coordination of Master’s Programs . . . 3
2.1.1 Regulations . . . 3
2.2 Distance Learning and E-learning . . . 3
2.3 Tools for administrators . . . 5
2.4 Indicators of absenteeism and dropout . . . 6
2.4.1 1st literature review . . . 6
2.4.2 2nd literature review . . . 11
2.5 Data Visualization As A Decision-Making Tool . . . 13
2.6 Data Types and Retinal Variables . . . 14
2.7 Learning Analytics and Performance Indicators . . . 15
2.8 Dashboard . . . 15
2.9 Dashboard for Masters Program Coordinators . . . 16
3 Problem Definition 19 3.1 Problem Statement . . . 19
3.2 Approach to the Proposed System . . . 19
4 Methodology 21 4.1 Design science, learning by making . . . 21
4.2 Design Science Research Process(DSRP) . . . 22
4.3 Participatory design (PD) . . . 22
4.4 Conclusion . . . 23
5 Requirement Gathering, Interviews with masters program coordinators 25 5.1 Results of the Interviews . . . 26
6 Identification of the data available with regards to the masters program coordinators’ tasks 31 6.1 Available indicators of absenteeism and dropout . . . 31
6.2 Available data to support coordinator tasks . . . 31
6.2.1 Task4: Oversee Absenteeism . . . 32
6.2.2 Task5: Prevent Dropout . . . 35
6.2.3 Task6: Review Students Results . . . 35
7 Dashboard prototyping 37 7.1 Dummy Data . . . 37
7.2 Dummy Data Production . . . 38
7.3 1st prototype . . . 38
7.3.1 Evaluation of the first prototype . . . 39
7.4 2nd Prototype . . . 41
7.4.1 Program-wide view . . . 42
7.4.2 Student view . . . 42
7.4.3 Evaluation of the second prototype . . . 43
7.5 3rd Prototype . . . 45
7.5.1 Program-wide view . . . 46
7.5.2 Student view . . . 46
7.5.3 Evaluation of the third prototype . . . 48
8 Final Prototype 51 8.1 Development . . . 51 8.1.1 Program view . . . 53 8.1.2 Student view . . . 53 8.1.3 Course view . . . 53 8.2 Implementation . . . 55
8.2.1 Moodle Web Services . . . 55
8.2.2 Database . . . 58 8.2.3 NodeJS . . . 58 8.2.4 ExpressJS . . . 58 8.2.5 Google Charts . . . 58 8.2.6 D3JS . . . 59 8.2.7 Heroku . . . 59
9 Conclusions and Future Work 61 9.1 Limitations and Future Work . . . 61
A List of masters programs coordinators on FEUP, UAb and UTAD 63
B Original Interview Protocol 67
C Revised Interview Protocol 69
D Results of the Original Interviews 71
E Results of the Revised Interview 75
F Feedback Interview Protocol (Portuguese) 77
G Translated Feedback Interview Protocol (English) 79
H 2nd Prototype - Close ups of the screen mockups 81
CONTENTS xi
J Pieces of Evidence Collected in the Feedback Interviews, Translated and Categorised 93
K Final Prototype - Close-ups of the screen elements 101
K.1 Program View . . . 101
K.2 Student View . . . 104
K.3 Course View . . . 107
List of Figures
5.1 FlowChart of the procedure done by a masters program coordinator for the tasks
selected . . . 29
7.1 1st prototype: Screen mockup for task6 . . . 39
7.2 1st prototype: Screen mockup for tasks4and5, phase 1 . . . 40
7.3 1st prototype: Screen mockup for task4and5, phase 2 . . . 41
7.4 2nd prototype: Screen mockup for the program-wide view . . . 43
7.5 2nd prototype: Screen mockup for the student view . . . 44
7.6 3rd prototype: Screenshot for the program-wide view . . . 47
7.7 3rd prototype: Screenshot for the student view . . . 47
8.1 Final prototype: Screenshot for the program-wide view . . . 54
8.2 Final prototype: Screenshot for the student view . . . 55
8.3 Final prototype: Screenshot for the course view . . . 56
8.4 UML Diagram of the database of the final prototype . . . 58
H.1 Close-up of the Distribution of Participation in the program-wide view . . . 82
H.2 Close-up of the Distribution of the Grades in the program-wide view . . . 82
H.3 Close-up of the Days since Last Access in the program-wide view . . . 83
H.4 Close-up of the Number of Activities in the student view . . . 84
H.5 Close-up of the Grades in the student view . . . 84
H.6 Close-up of the Percentage of Participation in the student view . . . 85
H.7 Close-up of the Comparison with the Average in the student view . . . 86
I.1 Close-up of the Distribution of Participation in the program-wide view . . . 88
I.2 Close-up of the Distribution of the Grades in the program-wide view . . . 88
I.3 Close-up of the Days since Last Access in the program-wide view . . . 89
I.4 Close-up of the Courses’ Comparison in the program-wide view . . . 89
I.5 Close-up of the Number of Activities in the student view . . . 90
I.6 Close-up of the Percentage of Participation in the student view . . . 90
I.7 Close-up of the Grades in the student view . . . 91
I.8 Close-up of the Comparison with the Average in the student view . . . 91
K.1 Close-up of the Distribution of the Participation and Grades . . . 101
K.2 Close-up of the Change in the Percentage of Participation Through the Weeks . . 102
K.3 Close-up of the Distribution of Participation . . . 102
K.4 Close-up of the Days since Last Access . . . 103
K.5 Close-up of the Timeline of Activities . . . 104
K.6 Close-up of the Change in the Percentage of Participation Through the Weeks . . 105
K.7 Close-up of the Percentage of Participation . . . 105
K.8 Close-up of the Grades . . . 106
K.9 Close-up of the Timeline of Activities . . . 107
K.10 Close-up of the Change in the Percentage of Participation Through the Weeks . . 107
K.11 Close-up of the Distribution of Participation . . . 108
K.12 Close-up of the Distribution of the Percentages of Participation . . . 108
List of Tables
2.1 Competencies of program coordinators by University as stated by the statutes . . 4
2.2 Plugins for Moodle related to administrative processes . . . 5
2.3 Analysis of the literature review on absenteeism and dropout indicators . . . 10
2.4 Summary of Indicators in the the literature review . . . 13
2.5 How to Apply the Retinal Variables to Data?[32] . . . 15
2.6 Education Performance Indicators . . . 16
2.7 Analysis of the literature review on dashboards for masters program coordinator . 17 2.8 SLA course level: SmU user requirements (examples). Adapted from [93] . . . . 18
4.1 Design-Science Research Guidelines[43] . . . 22
4.2 Six Steps of the Design Science Research Process[69] . . . 22
4.3 Appling the DSRP to this dissertation . . . 23
5.1 Tasks needed to be done by master program coordinators . . . 27
5.2 Tasks of a masters program coordinator that are the focus of this dissertation . . . 27
6.1 Indicators available externally to Program Coordinators . . . 31
6.2 Data used for the indicators in the articles of section2.4 . . . 32
6.3 Indicators to be used by a masters program coordinator to oversee absenteeism . 34 6.4 Indicators to be used by a masters program coordinator to prevent dropout . . . . 35
6.5 Indicators to be used by a masters program coordinator to review students results 36 7.1 Indicators used in the 1st prototype with the method of display . . . 40
7.2 Indicators used in displays in the Program Wide View . . . 42
7.3 Indicators used in displays in the Student View . . . 44
7.4 Indicators added as changes to the 3rd prototype . . . 46
7.5 Themes emerging from the interviews with coordinators . . . 48
7.6 Results of the thematic analyses of the feedback interviews . . . 49
7.7 Study of the problems stated in the improvement suggestions . . . 50
8.1 Technical problems and the study of solutions implemented . . . 51
8.2 Indicators used in displays in the Program Wide View of the Final Prototype . . . 53
8.3 Indicators used in displays in the Student View of the Final Prototype . . . 54
8.4 Indicators used in displays in the Course View of the Final Prototype . . . 56
8.5 Moodle Web Services Functions Used . . . 57
Abreviaturas e Símbolos
AVA Ambiente Virtual de Aprendizagem CLA Connected Learning Analytics DSRP Design Science Research Process EDM Educational Data Mining
ICT Information and Communications Technology LA Learning Analytics
LMS Learning Management Systems MLA Machine Learning Algorithm PD Participatory Design
SLA Smart Learning Analytics UAb Universidade Aberta UPORTO Universidade do Porto
UTAD Universidade de Trás-os-Montes e Alto Douro VLE Virtual Learning Environment
Chapter 1
Introduction
The job of a program coordinator is to ensure that the students enrolled in the program have all the help that they need to be successful. They monitor the individual and collective learning process of the whole cohort and forecast and prevent student failure.
This chapter will start with a description of the context and of the gap in the current solutions in Section1.1. Then in Section1.2the motivation to tackle this issue is presented, followed by the objectives and goals to achieve in Section1.3. This chapter ends with Section1.4, outlining the content of each chapter.
1.1
Context
There are several roles in education, and the role of a program coordinator is to provide the re-sources and structure needed so that the program is successful.
There are several tools already created that aim to encourage the learning process, nevertheless, they are mostly focused on the role of students or teachers[81]. The job of a program coordinator requires managing several subjects, but, by virtue of its target audience, in most Virtual Learning Environments and Learning Management Systems, the information is structured by subject.
The data present in the education system is often presented in ways that target students and teachers, not coordinators and, as such, from the point of view of the coordinator, the information is dispersed.
1.2
Motivation
It is often said that education is the future, so contributing to education is contributing to a better future for mankind. Both my parents work in the educational sector, so its difficulties are familiar to me. Information systems should be used to respond to real problems, and its use by program coordinators is not sufficiently treated in the literature.
Creating ways to help program coordinators, will hopefully ensure better and faster decision making freeing time and resources for the crucial task of teaching, encouraging learning and re-search.
1.3
Objectives
The main objective of this research project is to support the process of coordination of master programs. This goal can be divided into four stages.
• Explore the tasks asked of program coordinators; • Find the data that supports those tasks;
• Develop visualizations for that information;
• Create a dashboard focused on the job of the program coordinator;
So, this masters’ thesis aims to answers to following research questions "What are the func-tions of a master program coordinator?", "What data does one master program coordinator have to fulfil its role?", and "What learning dashboards have been created to support masters program coordinators?".
1.4
Document Structure
Besides this introduction, eight more chapters compose this document. The literature review is presented in Chapter2 it englobes both the job of a masters program coordinator, tools already available to help the education community options for the visualization of information and its ex-traction from data, dashboards and their functions as well as learning analytics and the current role of learning dashboards. Then, Chapter3contains the problem statement as well as an early proposed approach. Next, Chapter4 presents the methodology used in the development of this thesis. Then, following the methodology used the work is presented. Chapter5relates the require-ment gathering done with interviews of masters program coordinators. Chapter 6 identifies the data that is useful and available to program coordinators for the tasks that this prototype answers to. Afterwards, Chapter7depicts the prototyping process and, later, Chapter8characterizes the final prototype and its construction.
Chapter 2
State of the Art
2.1
Coordination of Master’s Programs
This section focuses on the responsibilities and duties of a program coordinator. In it we discover what tasks are required of them.
2.1.1 Regulations
The functions done by program coordinators came from the obligations to them intrusted in the statutes of each university. Their main function is, usually, to ensure the well-governance of the program. In the statutes of the University of Porto, the first duty of a program coordinator is to ensure the normal functioning of the program as well as to safeguard its quality[30].
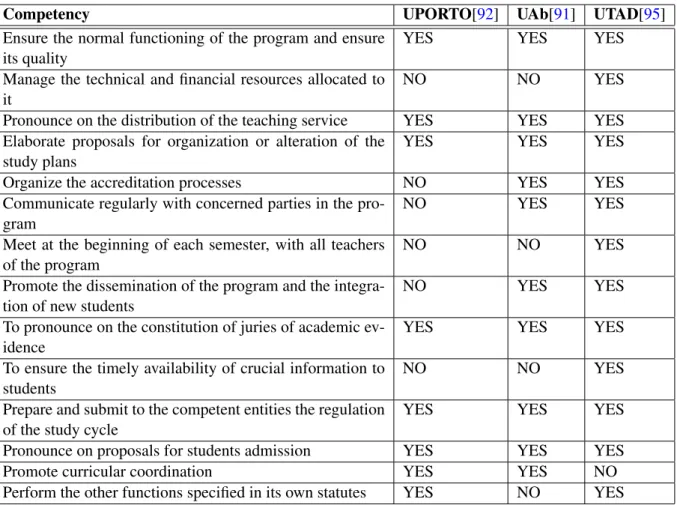
The table2.1shows the services asked of the program coordinator by the Universities statutes, it is noted that both the University of Porto and the University of Trás-os-Montes and Alto Douro both specify that other tasks may be added by other statutes[31][27], and in the pedagogical model of the Universidade Aberta there are other functions asked of the program coordinators[70].
2.2
Distance Learning and E-learning
There are different definitions of both distance learning and e-learning, and while they interconnect they are not the same and diverge in significant ways.
In regards to distance learning, we can differentiate already how the Universidade Aberta and the University of Aveiro regard distance learning. The pedagogical model for the Universidade Aberta establishes as one of its pillars the non-coincidence in Time or Space, as such, they limit to the minimum synchronous face-to-face sessions [70], on the other hand the University of Aveiro in its distance learning programs has weekly contact periods, in real-time (“synchronous hours”) done via electronic communication [4].
Concerning e-learning, there is also a broad definition of the concept. Some authors restrict e-learning to classes that take place entirely online, while others consider all learning that uses information and communication technologies as being a form of e-learning, as such, a teacher that
Table 2.1: Competencies of program coordinators by University as stated by the statutes
Competency UPORTO[92] UAb[91] UTAD[95] Ensure the normal functioning of the program and ensure
its quality
YES YES YES
Manage the technical and financial resources allocated to it
NO NO YES
Pronounce on the distribution of the teaching service YES YES YES Elaborate proposals for organization or alteration of the
study plans
YES YES YES
Organize the accreditation processes NO YES YES Communicate regularly with concerned parties in the
pro-gram
NO YES YES
Meet at the beginning of each semester, with all teachers of the program
NO NO YES
Promote the dissemination of the program and the integra-tion of new students
NO YES YES
To pronounce on the constitution of juries of academic ev-idence
YES YES YES
To ensure the timely availability of crucial information to students
NO NO YES
Prepare and submit to the competent entities the regulation of the study cycle
YES YES YES
Pronounce on proposals for students admission YES YES YES Promote curricular coordination YES YES NO Perform the other functions specified in its own statutes YES NO YES
2.3 Tools for administrators 5
Table 2.2: Plugins for Moodle related to administrative processes
Name Brief Explanation Intended
Audi-ence GISMO[62] Visualisation of students’ activities in online
courses to instructors
Teachers Configurable
Reports[52]
Categories reports, with information regarding categories. A courses report can be embedded in this type of report
Admins and Teach-ers
Checklist[84] Mark progress Students and Teachers
IntelliBoard - Your data. Right here. Right now.[48]
A compilation of comprehensive tools focused on teachers but with a few administrative tools
Students, Teachers and Admins Analytics
graphs[80]
Creates five graphs that may facilitate the identi-fication of student profiles
Teachers Overview
statistics[65]
Size statistic for IT Admins(IT)
makes available any material on the Internet is considered to partake in an e-learning environment, this is also sometimes called b-learning(blended learning)[28].
Although the beginning of distance learning came before the inclusion of ICT, nowadays dis-tance education relays on these technologies reach a bigger audience. As such, disdis-tance education has a wealth of data collected through ICT, able to be used to improve itself.
2.3
Tools for administrators
Virtual Learning Environments and Learning Management Systems have made e-learning and b-learning a new way to educate and they collect vast amounts of data about the b-learning process. There are several options on VLE and LMS to choose from depending on the school necessities, nevertheless, they are optimized in order to help teachers and students, and, as such, structure information by subjects, dispersing the data used in the work of a program coordinator. Options of well-know LMS are: Moodle[56], BlackBoard[5], Docebo[22], Desire2Learn[23], Sakai[74], among others.
Focusing on Moodle, which is Open Source Software and used in UPORTO, UTAD, and UAb, described in [16] as a course management system, and, like this description implies it is structured in course and classes, not in programs. However, because it is open source it is adaptable and has allowed the creation of plug-ins to enhance its scope. Table2.2describes some plugins taken from the Moodle Plugins Directory[29] whose purpose is reported to be “administration”, they were selected after the query "management".
2.4
Indicators of absenteeism and dropout
2.4.1 1st literature reviewA literature review was done with the search string: ”absenteeism AND (moodle OR elearning)” of papers between 2015 and 2020, on the academic databases: RCAAP, Web of Science, Springer-Link, ACMDigital Library, Scopus, and Repositório Aberto da Universidade do Porto, searched on the 11th of May 2020. Of 34 results were found, 6 were collections of abstracts or conference proceedings, which were excluded for the broad scope of their topics. After reading the titles and abstracts, 17 papers were also excluded for not relating to elearning, or not referring to the search of indicators or the detection of absenteeism. Of the papers, 10 were selected to be read. In the table2.3is an extraction of the knowledge.
Article About the paper Indicators Mentioned/Used Application of learning analytics us-ing clusterus-ing data Mining for Students’ disposition analysis[9]
“The main objective of this research work is to find meaningful in-dicators or metrics in a learning context”[9] Work done on a dataset of not university stu-dents
It was found that Stu-dents’ Interaction with the LMS affect Stu-dents’ Overall perfor-mance • Nationality • Gender • Place of Birth • Educational Stage/School level • Grade Level • Section ID • Semester • Topic
• Student Absence Days • Parent Answering
Sur-vey
• Parent School Satisfac-tion
• The parent responsible for student • Discussion groups • Visited resources • Raised hands • Viewing announce-ments • Learning Context • Real-time feedback • Interactional Features • Learner Guidance • Usage of LMS • Behavioural features • Relationship mining feature • Parental Involvement • Interactional features • Demographic features • Academic features
2.4 Indicators of absenteeism and dropout 7 A Survey of Machine Learning Ap-proaches and Techniques for Student Dropout Prediction[59]
“This paper presents an overview of machine learning in education with the focus on techniques for student dropout prediction”[59] Work not about univer-sity Students Focused on developing countries Focused on School Level indicators • Pupil-Teacher Ratio (PTR) • Enrollment • Student performance • Gender • Socio-economic demo-graphics • School infrastructure • Teacher skills • School distance • Academic performance Meta-model of the teaching and learning environment based on ICT integration in the e-learning systems[2]
“The main purpose of the paper is to investi-gate the degree of inte-gration of ICT into the learning process.”[2] Work done in the Poly-technical School of Uige - ESPU, Angola
Focused on the indicator of usage of ICT
“It is clear from the re-sults obtained from the study that
the student success rate increased with about 30% to 50% after the introduction of the MOODLE platform”[2] • Checking activities • Accessing resources • Grades • Uploads • Video lessons
• Audio and video confer-encing
• Chats and Forums
• Virtual libraries
• The success rate of the students who were en-rolled in the course • The failure rate of the
students who were en-rolled in the course • Student attendance
Patterns in students’ us-age of lecture recordings: a cluster analysis of self-report data[33]
“The aim of this study is to identify clusters of students who use lec-ture recordings in differ-ent ways”[33]
Is about the profile of students who use lecture recordings, and how and if it increases absen-teeism • Frequency of usage • Repetitive watching • Selectivity in watching • Lecture attendance • Social context • Location Diversity of online behaviours associated with physical attendance in lectures[12]
“Our aim is to link student online atten-dance and behavioural patterns with physical attendance in class”[12] Work on how the dif-ferent online behaviours and their prevalence changes throughout the semester
• Content view
• Content download
• Discussion view
• Access external applica-tion
• Thermal sensors to mea-sure attendance in face-to-face classes Virtual Teams in Higher Education: A Review of Factors Affect-ing Creative Performance[90]
“Creativity has been an ignored variable, especially in virtual contexts.”[90]
Work on how creativity affects efficiency in on-line teamwork • Participation in teams Advances in Test Person-alization and Adaptation in a Vir-tual Learning Environment[40]
“This paper states the analysis of an experi-ence of personalization and adaptation for the learning of university students.”[40]
This work explores how different learning styles and previous knowledge may be used to improve formative tests
2.4 Indicators of absenteeism and dropout 9 Web gamifi-cation with problem simulators for teaching engineering[26]
“A good strategy to enhance student motivation towards problem-solving is to use engaging and interactive gamification techniques.”[26]
This work shows how to use gamified exercises to improve the learning experience • Student ID • Total hits • Total failures • Date • Total games Development of Flipped Classroom model to improve the students’ performance[79]
“The use of flipped-classroom methodology has increased recently in higher education.”[79] This work explores if the use of a flipped classroom model im-proves performance
Web-based Analysis of Student Activity for Predicting Dropout[18]
“Students most likely to drop out of a course will first become absent from the course website.”[18] This paper tries to find a link between students engagement with the LMS and their dropout status the following year “At-risk students might show changes in their behaviour, unexpect-edly, such as inactivity on the course website or a reduced amount of activity in relation to the rest of the class. ”[18]
• Student ID
• The date and time of the activity
• Activity type
• No. of all student actions during the semester
• No. of all student ac-tions during a specified period of time
• Average of all student activity days
• Average of all student activity(hits) in a course in a specified month • No. of actions for the
entire semester
• No. of actions in a spec-ified period of time • Relative No. of actions
in relation to other stu-dents in a specified pe-riod of time
• No. of activity days • Student final grade
• Learning status of stu-dent the following aca-demic year
• No. of alerts for monthly inactivity • No. of alerts for
monthly decreases in activity compared to the class average (low aver-age of actions)
• The calendar month in which the inactivity alert appears
• The calendar month in which the low activity alert appears
• Total number of stu-dent activities for the semester
• The average number of student activities in rela-tion to the average num-ber of all student activi-ties for the semester; • Number of days in
which students were acti-ve
Table 2.3: Analysis of the literature review on absenteeism and dropout indicators
Of the papers selected some were done in not university students: [9] which used a dataset of younger students, [59] which focused on school performance in developing nations, and [90] which focused on teamwork. Others focused on finding if specific pedagogical methodologies
2.4 Indicators of absenteeism and dropout 11
using ICT affect learning performance: [33], [40], [26], and [79]. While the paper [2] focused on the knowledge of students and faculty about the academic use of several ICTs, the papers, [12] and [18], were the most related to finding how to measure attendance in a LMS. Article [12] tried to find how different online behaviour influenced class attendance, for that they measured the behaviour of students in the LMS, as such, they had to measure how students interacted with the LMS and how this interaction changed with time, a proxy for online attendance. The article [18] was interested in finding how students activity in the LMS was linked to students’ dropout, they measure the activities that students did in the LMS, as well as if they changed throughout the semester and how this was linked to students’ dropout. It was found that students that add an online presence 70% inferior to their colleagues were more likely to not be enrolled next semester.
2.4.2 2nd literature review
In an effort to improve the previous findings a review of the State of the Art on the indicators of dropout and absenteeism in e-learning was done. Using Publish or Perish[42] to rank by citations the results from GoogleScholar[55]. The search for articles was done with the search strings: “ab-senteeism AND (moodle OR e-learning OR elearning)”, “dropout AND (moodle OR e-learning OR elearning)”, and “attendance AND (moodle OR e-learning OR elearning)” on the 18th of may 2020, limiting the results to the first 100, from the years 2015 to 2020. From these results, the most relevant were selected, in total 13 articles were fully read. Of the articles selected, 9 were related to using LMS data to predict at-risk students with LA and EDM. 4 were related to a sin-gle course, where the portability may not be good. Some classes have different assessment rules, while grades were mentioned in several studies, some courses rely more heavily on the final exam. In a comparison between courses, different predictors were found to have different effects[20].
Indicator Mentioned in Ar-ticle
Notes Moodle Web Services function
Number of clicks
[63], [19], [78], [34], [20]
Some studies use number of hits in a pages None Time in LMS [34], [20] None Number of different sessions [20] None Frequency of actions [19], [78], [20] None Number of on-line days [19] None Number of lo-gin [53], [34], [20] None
Time before deadline of submission [63], [53], [19] mod_assign_get_assignments mod_assign_get_submissions Timing of ac-tivities [63], [19], [20] None View Assign-ments [63], [53], [19], [78], [34], [20] None
View Course [63], [20], [20] None Submit As-signment [63], [53], [19], [78], [34], [20] mod_assign_get_assignments mod_assign_get_submissions Assessment Grades [53], [19], [20], [89] gradereport_user_get_grade_items View Forum [53], [78], [34], [15], [20]
Some studies only say that they used data from fórum, without specifying view, post or re-ply. Other data related with num-ber of discussions started were also mentioned None Post on Forum [53], [78], [34], [15], [20] mod_forum_get_forums_by_courses mod_forum_get_forum_discussions mod_forum_get_discussion_posts Reply to Fo-rum [34] mod_forum_get_forums_by_courses mod_forum_get_forum_discussions mod_forum_get_discussion_posts Quizzes Grades [19], [34], [20], [89] Some studies [20] subdivid more, and use as data the number of right/wrong answers and the number of attempts. gradereport_user_get_grade_items Quizzes answer [34] None
2.5 Data Visualization As A Decision-Making Tool 13 Grades [19], [75], [50], [78], [34], [20], [14], [49], [89] gradereport_user_get_grade_items Gender [75], [50], [78], [15], [49], [89] None GPA [75] None Highschool Grade [75], [89] None City [75], [78], [89] None Age [50], [78], [15], [49], [89] None Marital Status [50], [78], [49], [89] None Children [50], [49] None Employment [50], [78], [49] None Digital knowl-edge [50], [49] None Synchronous voluntary talks [50], [49] None
Table 2.4: Summary of Indicators in the the literature review
As we can see in table2.4, the most referenced predictor(9 papers) were the grades the student had on assessments and midterms tests or projects, as they can count to their overall grade it was expected that they would be a good predictor.
The portability issue is related to differences in LMS use between classes and school, in [19] the comparison between students in the same course is made, making comparisons between stu-dents easier.
In conclusion the most talked about indicators were the grades in midterm exams or projects, assessment, quizzes and forum activities were also LMS activities referenced as well as the hits or clicks stored in the LMS logs. Personal information, that is not likely to change throughout the semester(i.e. gender, age, employment...) were also fairly mentioned.
2.5
Data Visualization As A Decision-Making Tool
Data visualization is used to serve a purpose, making the transmission of information faster and easier. The design and user experience that a program creates is extremely important[3], if only because if the information is not assimilated the main goal of the visualization was not accom-plished.
So, as stated in [24], one of the dimensions of interest is the Audience who will use this information for a purpose. As it is expressed in [94] “The goal of an SLA system is to provide LA stakeholders with analytics-based features and functionality to perform main business functions in academia – teaching, learning, tutoring, mentoring, research and administrative services – in an optimal way and with the highest possible quality.”
One of the goals of this master’s thesis is to understand the task required of masters program coordinators and how decision-making is made by them, so that a proposal of the development of part of an SLA system can be made, to help program coordinators perform their duties to the highest possible quality.
2.6
Data Types and Retinal Variables
How humans perceive information is a complex field. Designers learn for years how to express and display information for our understanding. We can differentiate between three different kinds of data:
• Quantitative — Numerical data;
• Ordered/Qualitative — Non-numerical data that can be compared or ordered, the differ-ence between each echelon is not defined;
• Categorical — All other types, for example, animals can be divided into cats, dogs, ducks. . . There are different ways to display information. In [32] there are seven retinal variables dis-cussed, as well as their suitability for relaying information from different data types. In table2.5
we have a summary of the suitability of each retinal variable for displaying the three types of data. As an example, we can see that using size to relay information about categorical data like what type of fruit it is can be misleading, why is a pear bigger or smaller than an apple, in the same way, there is no information of magnitude in textures so using it to display quantitative information is inadequate. The seven retinal variables are:
• Planar variables — variables displayed in a plane, for example, x and y axis • Size
• Texture • Shape • Orientation
• Colour Value — darker or lighter colours, but, for example, still blue
• Colour Hue — colloquially different colours, for example, blue, green or yellow, may change depending on languages.
2.7 Learning Analytics and Performance Indicators 15
Table 2.5: How to Apply the Retinal Variables to Data?[32] Quantitative Ordered/Qualitative Categorical Planar variables YES YES YES
Size YES YES NO
Texture NO NO YES
Shape NO NO YES
Orientation YES YES YES
Colour Value YES YES NO
Colour Hue NO NO YES
2.7
Learning Analytics and Performance Indicators
Learning Analytics is the measurement and analysis of data about learners in their context[66]. Its goal is to extract useful knowledge about education from the data that already exists in the education community. It may be used to personalise learning environments [51], or to predict at-risk students[6].
In the table2.6there are several KPIs that may be used by a program coordinator to overview the management of the program. While some, like the number of accesses, are taken directly from the data, others like the risk of abandonment are the result of LA models. Some of these models may not be relevant, for example, [25] studied the effect of logging in to an LMS(SIGARRA) in students’ grades, it was not found.
2.8
Dashboard
There are several definitions of “dashboards”, in a systematic review of learning dashboards, [81] found that of the papers that defined the term, all had different definitions. they suggest using the term “learning dashboard” defined as “A learning dashboard is a single display that aggregates different indicators about learner (s), learning process(es) and/or learning context(s) into one or multiple visualizations.”[81] to distinguish between single visualizations and to restrict the focus on education.
Of the different interpretations of the term, Stephen Few describes it as “A dashboard is a visual display of the most important information needed to achieve one or more objectives; con-solidated and arranged on a single screen so the information can be monitored at a glance”, in [13] it is understood to be “An easy to read, often single page, real-time user interface, showing a graphical presentation of the current status (snapshot) and historical trends of an organization’s key performance indicators (KPIs) to enable instantaneous and informed decisions to be made at a glance”, it is also widely accepted to be “a container of indicators”[45].
In regards to learning dashboards, [98] defines it “a display which visualizes the results of educational data mining in a useful way”, while [86] claim to be related to “visualisations of learning traces”.
Table 2.6: Education Performance Indicators KPI Description
Program dossier A collection of all the information about the program subjects, their professors the objectives, type of evaluation, language, hours...[1]
Risk of abandon-ment
An estimation of the risk of a student leaving the program Regularity of
ac-cess
Number of access to the VLE, as well as any spikes or long absence[8] On-time deliveries The number of students that deliver the projects on time
Student effort rate The effort having to be made by students spread in the calendar, for evaluating that there are no weeks with an abnormal amount of deliveries
Regular and rele-vant access to fo-rums
Information on the use of the communication tool, with the professors and other students
Number of Stu-dents that did not access
Provides an overview of any problems with access by students, an early indi-cator of the risk of abandonment
In conclusion, the common ground that learning dashboard definitions have are: visuals dis-plays that aggregate educational performance indicators to be used at a glance.
2.9
Dashboard for Masters Program Coordinators
The goal of this research project is to propose an approach to help masters program coordinators. Dashboards collect several visual displays whose main function is to transmit information. LA has found several indicators and models that may help program coordinators in their job. The proposed approach to this problem will be a dashboard that uses LA to recognize important indicators to the masters program coordinator.
A literature review was done to ascertain the use of learning dashboards by masters program coordinators. Using PoP[42] to rank the results from GoogleScholar, on the 14th of August 2020 the search was conducted with the search string “dashboard AND ("learning analytics" OR "edu-cational data mining" OR "edu"edu-cational datamining") AND (master OR graduate) AND (administ* OR coordinat* OR adivis* OR chair)” and limiting the search for results after the year 2015. The first 19 results were selected. 2, [82] and [96], were not articles and were discarded, and one, [46], was unavailable. In total 16 articles were read. Table2.7contains a summary of the articles.
[87] relates different approaches of employing LA in Moodle. In relation to scope, it distin-guishes between Course-level and Organizational-level. In [93] a bigger analysis of these different levels of depth in SLA is made, two of them related to the work asked of masters program coor-dinators described in 2.1, ”Concentration/minor program level” and “Departmental/program of study/curriculum level”. In this example, the master program coordinator appears to have an anal-ogous role to that of a department chair. Table2.8 is an extract of the user requirements for a department chair.
2.9 Dashboard for Masters Program Coordinators 17
Table 2.7: Analysis of the literature review on dashboards for masters program coordinator Article About the article
[87] Example of an online course level study; “Can online student learning performance be reliably predicted by learning engagement analytics in Moodle?”[87]
[83] A review of the most widely used tools to conduct EDM research
[17] Case study of using LA to create new forms of assessment in medical education; “MLAs have the potential to assist program directors with screening for residents at risk, but lack the ability to understand trainees’ strengths and weaknesses and the sophistication to generate specific remediation plans.”[17]
[7] “This paper provides a general overview to the complexities and challenges of using xAPI in a general systemic analytics solution - called the Connected Learning Analytics (CLA) toolkit.”[7]
[88] “This longitudinal study explores the effects of tracking and monitoring time devoted to learn with a mobile tool, on self-regulated learning.”[88] Studies how notification and their timing might change student behaviour
[35] Introduce two LA platforms used in Japan Propose a model for sharing LA tools and results between institutions
[61] “This paper describes the technological approach for the development of the system that supports the Observatory for University Employability and Employment”[61]
[58] A systematic review of the interplay between LA and adaptive learning
[67] “In this paper, we address issues of transparency, modularity, and privacy with the introduc-tion of an open source, web-based data repository and analysis tool tailored to the Massive Open Online Course community.”[67] Introduces a platform to conduct LA research [47] This study analyzes the effect of student-facing dashboards on learning
[93] “This paper presents the up-to-date research outcomes of a research project on the design and development of smart learning analytics systems for smart universities.”[93] This study introduces a developed prototype, it divides the field of LA into various levels with different users and requirements, one of them is a program of study.
[68] Study on the adoption of Blended-learning in universities and the user profiles of students [10] Comprehensive literature review of student-facing learning analytics reporting systems [60] “In this paper, a dashboard for visualizing and inspecting early detected reading difficulties
and their characteristics, called PADA (acronym for the Spanish name Panel de Analıticas de Aprendizaje de Dislexia en Adultos), is presented.”[60] A student dashboard that helps students understand their learned profile.
[44] “The purpose of this study was to examine student perceptions of privacy principles related to learning analytics.”[44] Students’ perception of principles of privacy in LA systems. Study of the relation of the perception of usefulness and willingness to supply data
[97] “This article surveys and maps the landscape of digital policy instrumentation in education and provides two detailed case studies of new digital data systems.”[97] This article relates how public policy is changing with the availability of data and LA.
Table 2.8: SLA course level: SmU user requirements (examples). Adapted from [93] Users type Desired functions in SLA system (examples)
Department chair
• Keep track of course instructor accomplishments versus other faculty at the department, or at the same course (but other sections)
• Compare student academic performance in a given course vs. student perfor-mance in the same course but in other sections, in previous semester, etc. • Access data of course academic performance of any student
Nevertheless, there was not much specifically directed to program coordinators. Possible rea-sons are that there are dashboards that were not written about, this position is different in each university so there was not a focus for these tasks, there is another nomenclature used that was not found, or that simply there is more interest in the users directly related to learning (teachers and students) for their impact on performance.
Chapter 3
Problem Definition
In this chapter, a detailed characterization of the problem will be made. First on Section3.1an abbreviated problem statement will be made. Followed by an early overview of the proposed approach in Section3.2.
3.1
Problem Statement
Moodle and other LMS already have a vast amount of information about the education environ-ment. Nonetheless, they are geared in order to help teachers and students, and, because they structure information by subjects, they disperse the data used by program coordinators. The result of this thesis is a prototype that proposes a reorganization of that information with the presenta-tion of it in a visual display. In this prototype the informapresenta-tion frequently used by the program coordinator is easily accessible.
For this purpose an study of the tasks required of a master program coordinator was conducted, as well as a review of the learning analytics and learning dashboards currently in the educational community.
3.2
Approach to the Proposed System
There were several different systems thought to solve this issue. Foreseeing that the resulting prototype would be used in many different locations, it was decided not to link it closely to a single LMS, and so it was decided not to make it as a Moodle plugin. The proposal for the project is the creation of a website that uses Moodle Web Services[64] to extract the data required from the LMS and that reorganizes it and displays it from the point of view of a program coordinator.
Chapter 4
Methodology
This chapter describes the research paradigm used, in section4.1. Section4.2explains the process followed.
4.1
Design science, learning by making
Design Science is a paradigm for doing research which seeks to learn from creating new and inno-vative artefacts. It is a paradigm that values learning by doing[43]. While the behaviour-science paradigm tries to find what is true, that is, tries to explain what is observed in the world, in design-science one aspires to create what is effective, or useful, and as a result to learn. Examples of artefacts in DS are decision-support systems, modelling tools, governance strategies, or evaluation methods[41].
The fundamental questions for design-science research are, “What utility does the new artefact provide?” and “What demonstrates that utility?”[43]
As stated in section 1.3, the goal of this thesis is to support the process of coordination of master’s programs. It is not to find out why coordinators make the decisions they make, nor to examine their roles in the education system. As such, the design of an artefact to support their action is in the realm of design-science.
The research contribution is to explore the use of the new LA solutions and learning dash-boards to the role of the masters program coordinator, this is, to extend known solutions to a new propose.
According to [43] a research project in design-science should follow 7 guidelines as detailed in table4.1.
Table 4.1: Design-Science Research Guidelines[43] Guideline Description
Guideline 1: De-sign as an Artifact
Design-science research must produce a viable artefact in the form of a con-struct, a model, a method, or an instantiation.
Guideline 2: Prob-lem Relevance
The objective of design-science research is to develop technology-based solu-tions to important and relevant business problems
Guideline 3: De-sign Evaluation
The utility, quality, and efficacy of a design artefact must be rigorously demon-strated via well-executed evaluation methods.
Guideline 4: Research Contribu-tions
Effective design-science research must provide clear and verifiable contribu-tions in the areas of the design artefact, design foundacontribu-tions, and/or design methodologies.
Guideline 5: Re-search Rigor
Design-science research relies upon the application of rigorous methods in both the construction and evaluation of the design artefact.
Guideline 6: De-sign as a Search Process
The search for an effective artefact requires utilizing available means to reach desired ends while satisfying laws in the problem environment.
Guideline 7: Com-munication of Re-search
Design-science research must be presented effectively both to technology-oriented as well as management-technology-oriented audiences.
4.2
Design Science Research Process(DSRP)
Rigour in science is based on the application of rigorous methods. So, a process to conduct design science research was adopted. [69] developed a design science research process with six activities or steps, detailed in Table4.2.
4.3
Participatory design (PD)
Participatory Design in a methodology that relies on the participation of all the stakeholders on a project. Artefacts produced by PD tend to enhance users abilities in functions that they already do[36].
Table 4.2: Six Steps of the Design Science Research Process[69] Steps Explanation
Problem identifica-tion and motivaidentifica-tion
Define the problem and what motivated the research to attack it; Can be achieved by describing what value the solution brings;
Objectives of a so-lution
Explain the objectives of the solution; Design and
devel-opment
Create the artefact;
Demonstration Demonstrate that the artefact solves the problem; Evaluation Measure how well the artefact performs in its task;
4.4 Conclusion 23
Table 4.3: Appling the DSRP to this dissertation Activity Specification
Problem identifica-tion and motivaidentifica-tion
Chapters1and3provide an explanation of the problem as well as the motiva-tion to address.
Objectives of a so-lution
Section1.3an overview of the thesis objectives. In chapter5, a more in-depth requirement gathering was done, with section 5.1describing the tasks which are the focus of the artefact.
Design and devel-opment
Chapter6reports what data was available and how it related to the problem. Chapter7describes how the artefact was created through prototyping.
Demonstration Chapter7relates how the artefact can be used. And chapter8details the final prototype was well as its implementation.
Evaluation Chapter7details how each prototype was evaluated and improved upon on the next iteration.
Communication This thesis expresses the contribution of this artefact.
One of the methods of Participatory Design is the iterative prototyping of ideas as stated in [85]. Chapter7 describes how Iterative Prototyping was used in the Design and Development phase of the DSRP.
4.4
Conclusion
This chapter presents the methodology used in the development of this thesis. Table4.3 details how the process was used in the development of this thesis.
Chapter 5
Requirement Gathering, Interviews
with masters program coordinators
In the process of trying to understand the problems facing masters program coordinators, an inter-view protocol (appendixB) was drafted to gather data on this topic from coordinators of masters programs in three universities(FEUP, UAb, and UTAD).
These interviews sought to find out activities that masters program coordinators do throughout the year, and problems in that process, such as their time constraints and effort.
The population for these interviews was 49 professors, coordinating Master programs of study, gathered from the Web sites of all master programmes offered at these universities (appendixA). These were invited by e-mail on the 7th of December of 2019. Until the 31st of January of 2020, there were four replies, and subsequently four interviews were scheduled and conducted (appendix
D).
From these interviews, it emerged that data on year-long activities was scarce: the most talked-about problems were the serialization of candidates for the next edition of the program and the process of compiling, choosing, and following the development of dissertation projects, that is, ac-tivities that are done at specific times of the semester, at the beginning or at the end, not throughout the semester (dissertation projects development being the only exception). When asked specifi-cally about problems that occur during the academic semesters, the interviewees did not specify them, they reported that the problems are varied and are usually solved by direct communication with the interested parties.
Three possibilities for this outcome were proposed:
1. there are not many problems or activities that need the masters program coordinator help during the semester;
2. the load of the master’s programs coordinator job is so unbalanced towards the beginning and end of the semester that other problems are minimised;
3. program coordinators are unaware of problems occurring during the semester if they do not impact the end or start of academic semesters.
In conclusion, with this method of interviews, it was found that either there are no serious problems throughout the year, or their sparse regularity leads them to be resolved in a timely fashion, or these problems are not being given their due importance.
In an attempt to gather more data on the mid-year activities, the interview protocol was revised, to try and probe more keenly the coordinators on this period, in case they do not mention it of their own accord (appendixC).
Having parsed the results and having determined that this method of interviews has not given the information expected, or the answers to the interview’s goal, the tactic, to conduct these inter-views, was changed.
The population for these interviews was invited again by email on the 28th February 2020. However, up to the 6th March 2020, only one interview was scheduled and conducted with pro-fessor Filipa Barreto de Seabra Borges from UAb.
The results from this new protocol were more detailed (appendix: E), although the activities at the beginning and end of the semester were still the most discussed, given that the middle of the semester was described as the time with less work. Nevertheless, the activities done in the middle of the semester were better described. The work performed in the middle of the semester is to oversee the progress of the program in all courses. As such, the information that the program coordinator seeks is whether the students are attending classes, i. e. are logging into the courses’ pages, handing in the assignments, as well as, if there are any other problems. Regarding following dissertation projects, the program coordinator would like to have a master list of all the delivery dates as well as advisors’ and students’ information to be able to see if any student is behind schedule. The main requirement, supported by reports on the activities of a masters program coordinator[39,57], is an overview of the students’ attendance.
5.1
Results of the Interviews
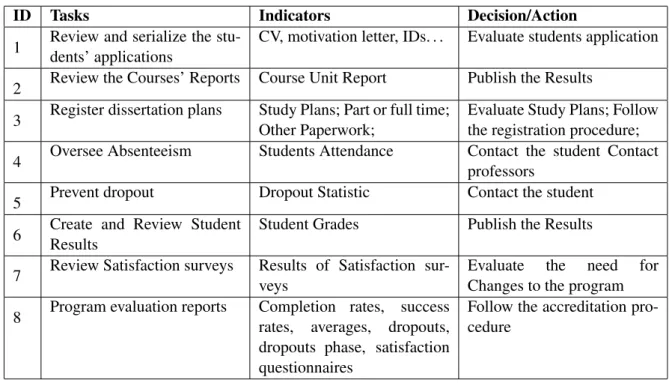
With the results of both these rounds of interviews, as well as the literature review that has been done before in section 2.1 a list of tasks done by masters program coordinator has been com-posed(table5.1).
The tasks are spread throughout the academic year or semester unevenly. Task1is done yearly at the beginning of the academic year,2and3are repeated at the beginning of each semester, tasks
4,5, and6are done repeatedly over the semester,7is done at the end of the semester while task8
is done sparingly in a defined time frame.
Owing to the dispersed, scattered and repeated realization of the tasks 4, 5, and 6, it was determined that they were the most crucial to be included on the dashboard. Because of the restricted and focused time frame of the other tasks they were deemed less critical for inclusion on this dashboard, as the indicators used had a limited timeframe to be useful. As such the dashboard made will be focused on displaying the appropriate indicator used in those three activities.
5.1 Results of the Interviews 27
Table 5.1: Tasks needed to be done by master program coordinators
ID Tasks Indicators Decision/Action
1 Review and serialize the stu-dents’ applications
CV, motivation letter, IDs. . . Evaluate students application
2 Review the Courses’ Reports Course Unit Report Publish the Results 3 Register dissertation plans Study Plans; Part or full time;
Other Paperwork;
Evaluate Study Plans; Follow the registration procedure; 4 Oversee Absenteeism Students Attendance Contact the student Contact
professors
5 Prevent dropout Dropout Statistic Contact the student 6 Create and Review Student
Results
Student Grades Publish the Results
7 Review Satisfaction surveys Results of Satisfaction sur-veys
Evaluate the need for Changes to the program 8 Program evaluation reports Completion rates, success
rates, averages, dropouts, dropouts phase, satisfaction questionnaires
Follow the accreditation pro-cedure
Table 5.2: Tasks of a masters program coordinator that are the focus of this dissertation
4 Oversee Absenteeism Students Attendance Contact the student Contact professors
5 Prevent dropout Dropout Statistic Contact the student
6 Create and Review Student Results
These activities are done following the flowchart on figure5.1, where the coordinators react to a warning indicator to try and prevent or solve problems. One of this thesis goals is to select and present the appropriate indicators that create a warning.
5.1 Results of the Interviews 29
Figure 5.1: FlowChart of the procedure done by a masters program coordinator for the tasks selected
Chapter 6
Identification of the data available with
regards to the masters program
coordinators’ tasks
6.1
Available indicators of absenteeism and dropout
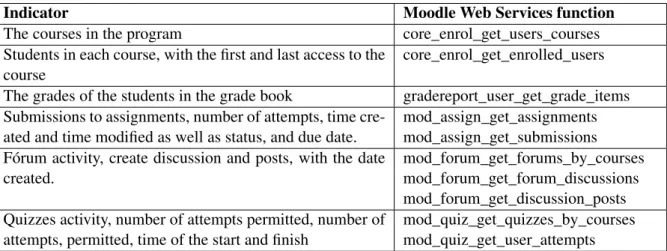
Of the indicators discussed in table 2.4, those which master program coordinators have access using Moodle web services are shown in table6.1.
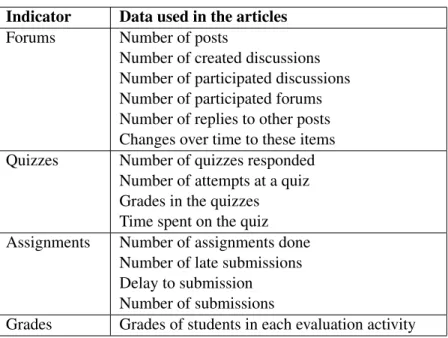
Thus, only these indicators were focused on, to select the ones used in the dashboard prototype. Table6.2summarizes these elements, the indicator as well as the data used in them.
6.2
Available data to support coordinator tasks
The tasks of a masters program coordinator that are the focus of this dissertation are (as shown in table5.2): oversee absenteeism, prevent dropout, and review students results. These will now be
Table 6.1: Indicators available externally to Program Coordinators
Indicator Moodle Web Services function
The courses in the program core_enrol_get_users_courses Students in each course, with the first and last access to the
course
core_enrol_get_enrolled_users The grades of the students in the grade book gradereport_user_get_grade_items Submissions to assignments, number of attempts, time
cre-ated and time modified as well as status, and due date.
mod_assign_get_assignments mod_assign_get_submissions Fórum activity, create discussion and posts, with the date
created.
mod_forum_get_forums_by_courses mod_forum_get_forum_discussions mod_forum_get_discussion_posts Quizzes activity, number of attempts permitted, number of
attempts, permitted, time of the start and finish
mod_quiz_get_quizzes_by_courses mod_quiz_get_user_attempts
Table 6.2: Data used for the indicators in the articles of section2.4
Indicator Data used in the articles Forums Number of posts
Number of created discussions Number of participated discussions Number of participated forums Number of replies to other posts Changes over time to these items Quizzes Number of quizzes responded
Number of attempts at a quiz Grades in the quizzes Time spent on the quiz Assignments Number of assignments done
Number of late submissions Delay to submission Number of submissions
Grades Grades of students in each evaluation activity
analysed regarding the available data presented in section6.1.
6.2.1 Task4: Oversee Absenteeism
The literature presented in section2.4, regarding this task, provided insights on the relevance of the indicators. By combining them with the available data in table 6.2, one can ascertain the following:
• The number of discussions one created was used as a variable in a machine learning algo-rithm.
• The number of discussions one participated was used as a variable in a machine learning algorithm.
• The number of forums one participated was used as a variable in a machine learning algo-rithm.
• The number of quizzes one responded was used as a variable in a machine learning algo-rithm.
• The time spent on a quiz was used as a variable in a machine learning algorithm. • The number of late submissions was used to predict performance.
• The submission delay was used to predict performance. • The number of submissions was used to compare students. Some indicators were used in different ways by different papers:
6.2 Available data to support coordinator tasks 33
• "Number of posts" was used either to compare with other students (percentage) ([53,19]) or as a variable in a machine learning algorithm ([78,34,15,20]) or in a visualization of students interactions ([15])
• "Number of replies to other posts" was used either to compare with other students (percent-age) ([53,19]) or as a variable in a machine learning algorithm ([34,15])
• "Number of attempts at a quiz" was used either to compare with other students ([19]) or as a variable in a machine learning algorithm ([34,20])
• "Number of assignments done" was used either to compare with other students (percentage) ([53,19]) or as a variable in a machine learning algorithm ([20])
• "Changes over time to these items" was used either to compare with the previous behaviour ([19]) or to redo the prediction with newer data ([78,34,15]) or as a variable in a machine learning algorithm ([20])
From the perspective of program coordinators overseeing absenteeism across an entire pro-gram, rather than individual professors considering only their courses, some of these uses must be reconsidered. A program coordinator needs to oversee several courses, not a single one.
Due to the difference in the organization of various courses (some courses will have more activities than others, or request more frequent participation than others) and the fact that some students can be participating in only some courses (part-time students) a mere sum or direct com-parison of absolute number of participation indicators of students is not useful for the program coordinator to oversee absenteeism. This affects forum postings, but also other types of participa-tion. For instance, the number of attempts at quizzes and the number of submissions of quizzes may differ widely between courses, as summative evaluation usually only allows one attempt, but formative assessment may allow multiple attempts.
Corollary 1 Presenting participation indicators of students as percentages of available partici-pation opportunities is more relevant.
Formative assessments and quizzes usually allow an unlimited number of attempts to give students the opportunity to improve their understanding of the subject, but some professors prefer to limit those attempts and summative evaluations only allow one attempt. This disparity in the number of attempts allowed will alter the pattern of response attempts.
Corollary 2 The number of attempts and the time spent on quizzes should only be considered when the number of attempts permitted is unlimited.
Comparing the students with their previous behaviour to ascertain any changes is useful, as changes in behaviour can be a manifestation of changes of attitudes related to the program. Corollary 3 The indicators need to be clarified in terms of their change over time, in order to be useful for the task of overseeing absenteeism.
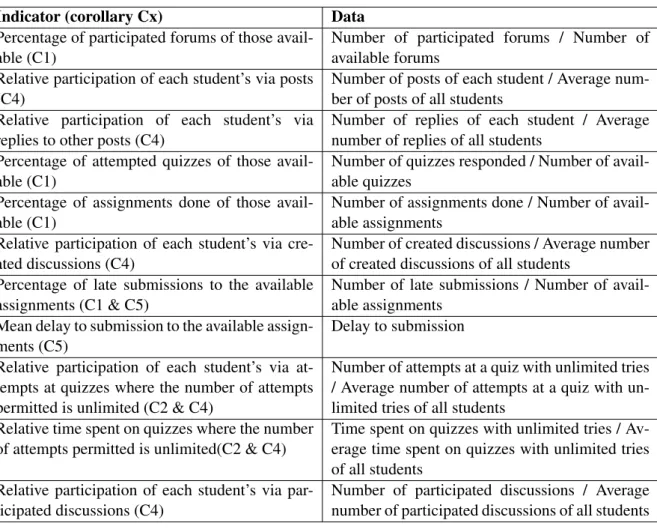
Table 6.3: Indicators to be used by a masters program coordinator to oversee absenteeism Indicator (corollary Cx) Data
Percentage of participated forums of those avail-able (C1)
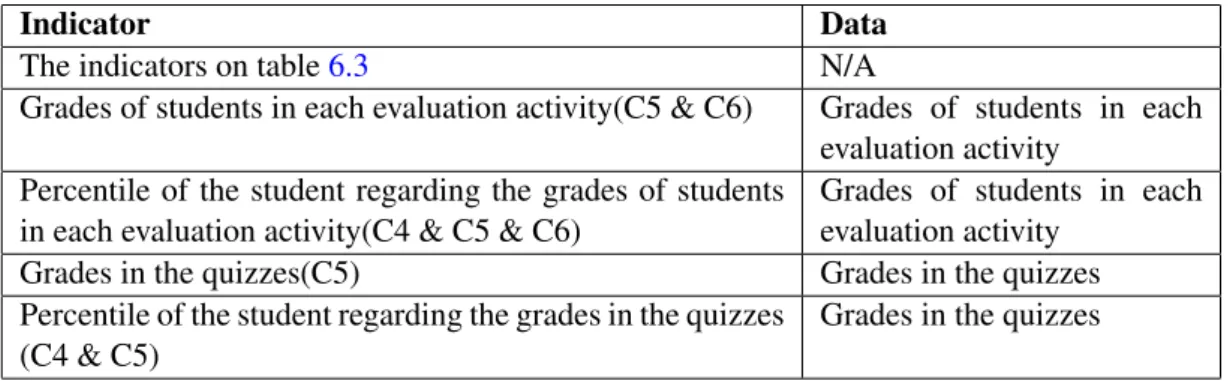
Number of participated forums / Number of available forums
Relative participation of each student’s via posts (C4)
Number of posts of each student / Average num-ber of posts of all students
Relative participation of each student’s via replies to other posts (C4)
Number of replies of each student / Average number of replies of all students
Percentage of attempted quizzes of those avail-able (C1)
Number of quizzes responded / Number of avail-able quizzes
Percentage of assignments done of those avail-able (C1)
Number of assignments done / Number of avail-able assignments
Relative participation of each student’s via cre-ated discussions (C4)
Number of created discussions / Average number of created discussions of all students
Percentage of late submissions to the available assignments (C1 & C5)
Number of late submissions / Number of avail-able assignments
Mean delay to submission to the available assign-ments (C5)
Delay to submission Relative participation of each student’s via
at-tempts at quizzes where the number of atat-tempts permitted is unlimited (C2 & C4)
Number of attempts at a quiz with unlimited tries / Average number of attempts at a quiz with un-limited tries of all students
Relative time spent on quizzes where the number of attempts permitted is unlimited(C2 & C4)
Time spent on quizzes with unlimited tries / Av-erage time spent on quizzes with unlimited tries of all students
Relative participation of each student’s via par-ticipated discussions (C4)
Number of participated discussions / Average number of participated discussions of all students
Different masters programs and different courses require a different level of participation and a masters program coordinator may not know how much the students need to participate. A bench-mark is required to extract meaning from data.
Corollary 4 The participation activities should be compared with the activities done by an aver-age student.
In Master courses, assessment via assignments may be less frequent than in undergraduate courses, and more common at the end of the course. However, while this makes the indicator less useful during the semester, any such assignments that do exist are valuable regarding participation information.
Corollary 5 Data on assignments, while not expected to be frequent, is valuable.
Following from Corollaries 1 to 5, the indicators that are being considered are presented in Table6.3.