RESEARCH ARTICLE Pub. 1144
ISSN 1679-9216
1
Received: 27 March 2013 Accepted: 8 June 2013 Published: 5 July 2013 1Young Researchers Club, Rasht Branch, Islamic Azad University, Rasht, Iran. 2Department of Animal Science, Rasht Branch, Islamic Azad Univer-sity, Rasht. 3Department of Animal Science, Rasht Branch, Islamic Azad University, Rasht. 4Animal and Veterinary Research Centre - CECAV; ECAV, Department of Zootecnics, UTAD, Vila Real, Portugal. CORRESPONDENCE: A. Seidavi [[email protected] - Fax: + (98) 911-3313073]. Department of Animal Science, Rasht Branch, Islamic Azad University, Pole-Taleshan, Rasht. ZIP code: 4185743999, Iran.
Eff ects of Two Levels of Quantitative Feed Restriction for a 7- or 14- Days Period
on Broilers Blood Parameters
Hossein Jahanpour1, Alireza Seidavi2, Ali Ahmad Alaw Qotbi3 & Rita Payan-Carreira4
ABSTRACT
Background: Compensatory growth after a feed restriction (FR) period, associated with increased feed intake and digestive adaptation allows the broilers chickens to demonstrate better food conversion effi ciency and meat yield when submitted to an early-age food restriction. Differences in levels of feed restriction or on the period of feed restriction need to be adapted to each broilers strain, and should balance an adequate physiological response towards compensatory growth for production of the most suitable carcass, the smallest stress and an adequate immune-competence levels. So far, investigations showed considerable variations concerning broilers response to early life restrictions, physiological associate changes, compensatory growth and fat deposition. This experiment had been done to compare the effects of quantitative feed restriction imposed in different intensities and durations on the blood concentrations of energy, protein and lipid metabolites.
Materials, Methods & Results: Five experimental treatments included T1 corresponded to controls (ad libitum); T2 and T4 groups were submitted to 25 and 50% feed restriction for one week; and T3 and T5 were feed deprived in 25 and 50% for two weeks, in three replicates of 10 pieces per treatment. Periods previous and subsequent (up to 42 days) to FR periods were fed ad libitum. All chickens were fed with ad libitum before and after the completion of the restriction period. Feeds were based on corn and soybean meal, and were formulated to contain the same protein and energy levels in all treatments; feed was adapted to the three main phases of the rearing period: the starter period (1-21 days of old), grower period (22-35 days old) and the fi nisher period (36-42 days old). At the end of the study, at 42 days of age, one bird per group, totalling 3 birds per treatment, was randomly selected for blood collection. Blood samples (1 mL/bird) were collected into EDTA tubes from the wing veins by the end of the experiment, at day 42. Samples were transferred to the laboratory for analysis within 2 h of collection. After centrifugation (3000 g, for 10 min at room temperature) plasma was harvested and stored in eppendorf tubes at -20ºC, until assayed. Severe restriction for a 2 week period showed the highest concentrations for Uric Acid (UAc), Triglycerides, VLDL, as well as the lowest for cholesterol and LDL; also, the highest ratios HDL/LDL were observed in this group, suggesting that birds in this treatment are more susceptible to protein catabolism during fasting and more prone to fat deposition in the carcass. In opposition, mild feed deprived birds showed the highest cholesterol and LDL concentrations in blood along with the lowest UAc, triglycerides and VLDL plasma values; they also showed lower HDL/LDL ratios than controls or severely feed deprived birds. No differences were observed between groups in glucose plasma concentrations.
Discussion: The results suggest that feed restriction for longer periods may predispose the bird metabolism for an increased susceptibility for fat deposition, in comparison to the controls or the mild feed restriction treatments. Data gathered in the present study showed that quantitative feed restriction starting by day 8, followed by ad libitum was associated with changes in plasma metabolite concentrations. These changes varied between the two different intensities of FR and the two periods of FR evaluated. The results suggest that, for the same intensity of feed restriction, the length of deprivation may not be a determinant factor in mild FR. However, when severe FR is imposed, the length of FR may be a risk factor for excessive protein catabolism and increased VLDL availability, with the latter favouring precocious fattening of the carcasses. New studies are warranted to strength these results in particular on respect to the establishment of the infl uences of such changes in plasma metabolites with fatness and fat distribution on broilers.
INTRODUCTION
Food deprivation is a commonly used manage-ment strategy in broilers, aiming to prevent excessive weight gain during growth and thereby to solve some health-related problems [7], while also preventing precocious fat deposition [33]. Feed restriction also presents some economic benefi ts [6,11]. Further, feed restrictions can be obtained in a quantitative or a quali-tative way, thus allowing the production of different carcass quality (softness and fl avoursome). In addition, it can be used also as a strategy to reduce heat stress, in particular during summer in subtropical zones [22].
Although quantitative feed restriction may stimulate activity in broilers and be benefi cial to their leg health, it also tends to raise the levels of hunger, thus severely compromising the welfare of the birds, that is evidence to the manifestation of frustrated be-haviour patterns [32].
Nowadays, welfare concerns demands in-creased attention is paid for stressful side effects associated with diets manipulation and management aiming a more compassionate animal production and attentive production systems.
Changes in blood some blood parameters, such as glucose and other metabolites, are expected following diet restrictions, in particular when they are extended in time. Yet, limited information is available on changes in blood metabolites changes in association with different feed restriction techniques. The present study aims to evaluate the effects of two regimens of feed deprivation, different in intensity (mild vs. severe) and length (short vs. moderate), which are compared to those of ad libitum feed birds, upon the blood glu-cose, lipid and protein concentrations of Ross 308 male broilers.
MATERIALS AND METHODS
This study was developed in the poultry farm facilities of the Agriculture Faculty of Islamic Azad Uni-versity, in Rasht, Iran. It is situated 7 m below sea level and located at latitude 37°15’ N and longitude 49°36’ E; Rasht has a humid subtropical climate. The study was carried during the winter (cold) season, between December 2011 and January 2012, for a total of 42 days.
The experiments were approved by the Scien-tifi c Board of the Islamic Azad University, and were conducted in respect to the International Guidelines for research involving animals (Directive 2010/63/EU).
Facilities
The facilities (4×40 meters) included, other than the main compartment for chicken, a labour room, a slaughter-room and separate carcass and a storage room, where the ingredients are grinded and mixed. Five ventilators were used to maintain the desired air temperature: one strong ventilator with air discharge power of 1400 cubic meters per hour, and four other units with discharge power of 3500 cubic meters per hour.
The main compartment, the pens and the rooms were thoroughly cleaned and disinfected (Multifenelic1
solution at a ratio 1:125 and 1:250), as were the drink-ers, the feeders and all the equipment to be used during the experiments (20% Benzalkonium chloride2 - Germo
Killer). Also windows and the ventilators were gasifi ed with Formalex®3 solution.
Temperature, humidity and light
During the experiments, room temperature was maintained applied according to standard brood-ing practices and adapted to their rearbrood-ing stages [2]. The temperature was adjusted to approximately 30ºC on day 1, and then is gradually decreased to 22ºC. Lighting was provided 23 h/d, with one h of darkness, from 19 to 20 pm. The birds were housed in the main compartment, in fl oor pens with 1.5m2 fi tted with
electrical heaters.
Humidity was maintained at least at 55 to 65% in the early growing period, by spraying water on the fl oor.
Animals and treatments
In this study, 150 male Ross 308 broilers [2,3] were randomly distributed into 5 treatments with 3 replicates per treatment, with a total of 30 birds per treatment. The experiments started with one-day-old chicks, which were randomly assigned into 15 groups of 10 pieces, with mean body weights similar for all the groups. Birds were housed in groups of ten (each group was regarded as one experimental unit) in pens of 1.5 m × 1 m (with an area of 0.15 m2 per bird).
Rearing conditions were similar for all treat-ments, and feed restriction was obtained by reducing the total daily amount per pen.
The treatments (3 units of 10 chicks each) consisted of:
• Control group (CD): ad libitum intake
• Treatment 2 (T2): 50% quantitative feed restriction (50% of the recommended by the standard catalogue [30] for one week (between days 8 to 14), correspond-ing to a short, severe feed restriction;
• Treatment 3 (T3): 50% quantitative feed restriction (50% of the recommended by the standard catalogue • [30] for two weeks(between days 8 to 21),equivalent to a median length, severe feed restriction;
• Treatment4 (T4): 25% quantitative feed restriction (75% of the recommended by the standard catalogue [30] for one week (between days 8 to 14),correspond-ing to a short, mild feed restriction;
• Treatment 5 (T5): 25% quantitative feed restriction (75% of the recommended by the standard catalogue
[30] for two weeks (between days 8 to 21),equivalent to a median length, mild feed restriction.
Water was supplied ad libitum during the entire experimental period.
Broilers nutritional requirements were based on NRC recommendations [23] and Ross strain rearing catalogue [2,3]. All chickens were fed with ad libitum before and after the completion of the restriction pe-riod. Feeds were based on corn and soybean meal, and were formulated to contain the same protein and energy levels in all treatments; feed was adapted to the three main phases of the rearing period: the starter period (1-21 days of old), grower period (22-35 days old) and the fi nisher period (36-42 days old).
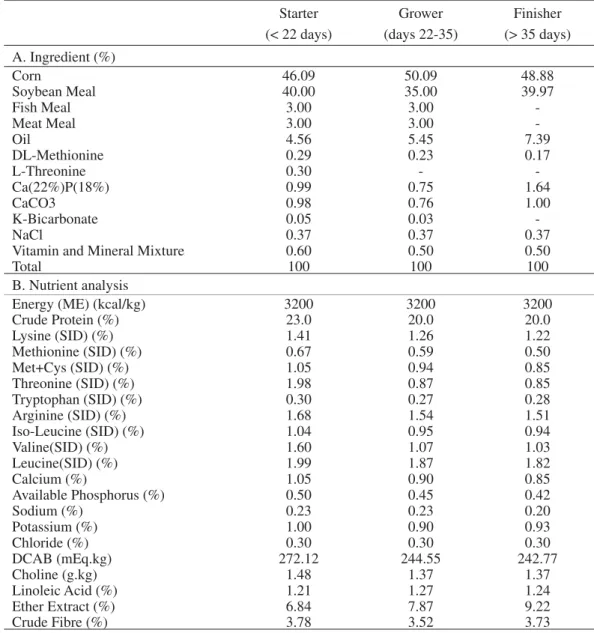
Composition of the diets and its nutrient com-position for the above-mentioned phases are presented in Table 1.
Table 1. Composition of the basal diets used in this study for the different rearing periods. A. Ingredient (%) of the diets; B. Calculated nutrient constitution of the diets.
Starter (< 22 days) Grower (days 22-35) Finisher (> 35 days) A. Ingredient (%) Corn 46.09 50.09 48.88 Soybean Meal 40.00 35.00 39.97 Fish Meal 3.00 3.00 -Meat Meal 3.00 3.00 -Oil 4.56 5.45 7.39 DL-Methionine 0.29 0.23 0.17 L-Threonine 0.30 - -Ca(22%)P(18%) 0.99 0.75 1.64 CaCO3 0.98 0.76 1.00 K-Bicarbonate 0.05 0.03 -NaCl 0.37 0.37 0.37
Vitamin and Mineral Mixture 0.60 0.50 0.50
Total 100 100 100
B. Nutrient analysis
Energy (ME) (kcal/kg) 3200 3200 3200
Crude Protein (%) 23.0 20.0 20.0 Lysine (SID) (%) 1.41 1.26 1.22 Methionine (SID) (%) 0.67 0.59 0.50 Met+Cys (SID) (%) 1.05 0.94 0.85 Threonine (SID) (%) 1.98 0.87 0.85 Tryptophan (SID) (%) 0.30 0.27 0.28 Arginine (SID) (%) 1.68 1.54 1.51 Iso-Leucine (SID) (%) 1.04 0.95 0.94 Valine(SID) (%) 1.60 1.07 1.03 Leucine(SID) (%) 1.99 1.87 1.82 Calcium (%) 1.05 0.90 0.85 Available Phosphorus (%) 0.50 0.45 0.42 Sodium (%) 0.23 0.23 0.20 Potassium (%) 1.00 0.90 0.93 Chloride (%) 0.30 0.30 0.30 DCAB (mEq.kg) 272.12 244.55 242.77 Choline (g.kg) 1.48 1.37 1.37 Linoleic Acid (%) 1.21 1.27 1.24 Ether Extract (%) 6.84 7.87 9.22 Crude Fibre (%) 3.78 3.52 3.73
Health programs
The birds used for this study were fi rst treated for coccidiosis and from day 21 on Salinomycin4 (0.5
kg/ton) was mixed in the diet. Feed remained in feeders was weighed and recorded. The recommended vaccina-tion program against Newcastle and Gumboro diseases was observed in all cases. After each vaccination, to reduce stress, a multiple-vitamin and electrolytic solu-tion (1:1000) was diluted in drinking water was used within 24 hours.
Sampling and Blood parameters
At the end of the study, at 42 days of age, one bird per group, totalling 3 birds per treatment, was randomly selected for blood collection. Blood samples (1 mL/bird) were collected into EDTA5 tubes
from the wing veins by the end of the experiment, at day 42. Samples were transferred to the laboratory for analysis within 2 h of collection. After centrifuga-tion (3000 g, for 10 min at room temperature) plasma was harvested and stored in eppendorf tubes at -20ºC, until assayed.
Blood parameters analysed in this study were: glucose (GLU), uric acid (UAc), total cho-lesterol (TC), total triglycerides (TG), very low density lipoprotein (VLDL), high density lipopro-tein (HDL), low density lipoprolipopro-tein (LDL), the HDL/LDL ratios, total protein (TP), and albumin (Alb).The concentrations for these parameters were determined by routine methods using commercial laboratory kits6.
Statistical design of experiment
Data gathered during the trials were organised in Excel data sheets and the statistical analysis per-formed with SAS® 9.0 (SAS Institute). For statistical
analysis, the mean of pen results was considered as the experimental unit. Data of this experiment were subjected to analysis of variance using GLM proce-dures in a completely randomized design. Comparison of the means between groups and between replicates was achieved by the Duncan’s multiple range tests at 5% probability.
The statistical model for the experiment was
Yij = µ+Ti+ eij, where Yij is the value for each
obser-vation, µ the average measured traits in the studied population, Ti the effect of the treatment and eij the experimental error.
RESULTS
The results for the biochemical parameters concentration at day 42 in broilers plasma according to feed treatments are shown in Table 2. Results were given in mean ± standard error of mean (x̄ ± SEM).
At day 42, no signifi cant changes were found in the mean plasmatic glucose (Glu) concentrations between birds submitted to feed restriction and controls (P = 0.138). Nevertheless, small differences in abso-lute concentrations were found between groups, with animals from severe feed restriction of short duration showing higher Glu concentrations than all the other treatment groups (Figure 1). In contrast, birds submit-ted to mild feed restriction for two weeks showed the lowest levels of Glu. The plasmatic Glu concentrations were similar in controls and birds in treatments T3 and T4 (two weeks, severe feed restriction and short, mild feed restriction, respectively; Figure 1; Table 2).
Signifi cant differences among groups were found for the uric acid (UAc) concentrations in broiler plasma (P = 0.01). The concentrations of UAc were higher in birds submitted to severe feed restriction than in controls and mild feed restriction groups (P < 0.001). In contrast, the lowest concentrations in plasmatic UAc were found in birds submitted to mild feed restriction (Figure 1; Table 2).
Statistical differences were found on regard to plasmatic total cholesterol (TC) concentrations (P = 0.022). Only birds from mild feed restriction treatments showed signifi cant differences in TC concentrations in comparison with controls and severe restriction feed groups (P = 0.002). In groups submitted to mild feed restriction, a marked increase in plasmatic cholesterol was observed, along with the largest individual varia-tions. In contrast, severe feed restriction (treatment groups T2 and T3) resulted in a slightly non-signifi cant decrease in TC concentration when compared to con-trols (Figure 1; Table 2).
No differences were observed among treat-ments for plasmatic total triglycerides (TG) concentra-tion at day 42 (P = 0.272). Yet, severely feed restricted birds showed higher absolute TG plasmatic concen-trations than birds submitted to mild feed restriction. Despite showing a striking increase in TC blood levels, the 2 weeks mild feed restriction regimen did not show statistical differences from the other treatment groups (Figure 1; Table 2).
No statistical differences were found in VLDL cholesterol plasmatic concentrations within treatment groups and controls (P = 0.277), though absolute plasmatic concentrations were higher in severe feed restricted groups, while lower absolute values were found in the mild feed restriction groups (Figure 1; Table 2).
Concerning the plasmatic high-density lipopro-teins (HDL) concentrations, no signifi cant differences were found among treatment groups (P = 0.086). The HDL lowest concentrations were found in the severe feed restriction regimens, in particular in the median length (2 weeks), while the highest concentration was found for the short, mild restriction period (Figure 1; Table 2).
Statistical differences were detected amongst treatments for the plasmatic low-density lipoproteins (LDL) at day 42 (P = 0.022). A remarkable change in LDL concentrations were observed in both the groups of mild feed deprivations, with a 5- to 7-folds increase on when compared to controls and severely deprived broilers (P = 0.003; Figure 1; Table 2).Despite the
absence of differences between controls and the severe feed restricted groups, smaller plasma concentrations were found for the birdsingroupsT2 and T3 (Figure 1).
Calculated HDL/LDL ratios were found to be signifi cantly different between groups (P < 0.001). The severely feed restricted groups showed slightly higher plasmatic concentrations than controls, although without statistical signifi cance. A striking, signifi cant reduction of the calculated HDL/LDL ratios was found for the mild feed restriction groups (P < 0.001), independently of the length of the deprivation regimen (Figure 1; Table 2).
No statistical differences were found for total proteins concentrations at day 42 within treatment groups and controls (P = 0.537), even if small numeric concentrations were observed mainly in severe feed restriction group (Figure 1; Table 2).
Similarly, no statistical differences were ob-served for total albumin concentrations at day 42 in feed deprived groups in comparison to controls (P = 0.637) [Figure 1; Table 2].
Table 2. Effect of different feed deprivation regimes (in intensity and duration, starting at day 8) over blood metabolites concentration at day 42 in male Ross 308 broilers (Mean ± SEM).
Metabolite
Control (T1- Feed ad libitum from d1-42)
Severe feed restriction (50% of the standard amount)
Mild feed restriction (25% of the standard amount) T2 - 1 week period T3 - 2 week period T4 - 1 week period T5 - 2 week period Glucose [mg/dL] 242.33a ± 3.84 256.67a ± 2.60 240.67a ± 12.86 243.67a ± 12.17 221.00a ± 5.57
Uric Acid [mg/dL] 2.70a,b ± 0.51 4.17a ± 0.52 4.40a ± 0.12 1.53a,b ± 0.22 1.97b,c ± 0.58
Total Cholesterol [ mg/dL] 141.33 a ± 5.18 135.00b ± 2.08 130.67b ± 3.71 248.33a ± 45.67 285.00a ± 59.53 Triglycerides [mg/dL] 86.00a ± 43.32 85.33a ± 28.24 120.67a ± 12.39 50.67a ± 14.99 45.33a ± 7.33 VLDL [mg/dL] 17.33a ± 8.51 17.00a ± 5.51 24.00a ± 2.52 10.33a ± 2.96 9.33a ± 1.33 HDL Cholesterol (High Density Lipoproteins) [mg/dL] 101.00a ± 2.00 99.00a ± 3.22 91.00a ± 2.08 107.66a ± 5.61 102.67a ± 4.06 LDL Cholesterol (Low Density Lipoproteins) [mg/dL] 23.00a ± 4.36 19.00a ± 4.00 15.67a ± 1.20 129.67b ± 48.75 173.00b ± 58.71 Total Protein [g/dL] 3.13a ± 0.30 2.97a ± 0.12 2.83a ± 0.09 2.97a ± 0.09 3.23a ± 0.18
Total Albumin [g/dL] 1.33a ± 0.15 1.33a ± 0.09 1.20a ± 0.00 1.27a ± 0.09 1.43a ± 0.15
Metabolite ratios
HDL/LDL 4.69a,b ± 0.79 5.56a ± 0.84 5.86a ± 0.32 1.56b,c ± 0. 98 0.80c ± 0.31
Figure 1. Box-plot representation for the treatment associated changes in blood metabolites concentration at day 42 in male Ross 308 broilers [329 x 499 mm (72 x 72 DPI)].
DISCUSSION
Manipulation of the diet in birds, as in other species in mammals, modifi es the endocrine and blood metabolite patterns, whether the manipulation acts on diet energy and protein levels or on its fat and protein sources [16,19]. These changes are used to achieve different carcass composition and to modulate the lipid composition in the fi nal carcass in broilers, al-lowing producers to meet market requirements and minimize side effects of fast growing in commercial chicken farms [7,33]. In broilers, food deprivation is frequently used in an attempt to control fat deposition and to improve feed conversion [6,28,31]. Changes in the blood metabolites profi les, as well as in the results, may vary within the genetic lines, with the sort of feed restriction regimen (qualitative vs. quantitative), the diet composition (ratios energy/protein) the duration of food deprivation, the deepen of the induced restric-tion (% of the recommended amount of diet; schedule of feeding) and with the moment of the rearing period when food restriction is imposed [6,9,20,28].
Also, restricted feed birds usually show a high motivation to feed at all times and are more active than unrestricted ones [18,25,32]. Nevertheless, some controversial results on complete fi nal growth recovery exist, which could be related to differences in the sever-ity of feed restrictions used in different studies [33]. An important side effect of such inability is the decrease in the breast meat yield, particularly when severe feed deprivation (but not for mild fee restrictions) occurs at early stages.
The work presented now, aimed to evaluate changes in energy and lipid metabolites in plasma samples of birds submitted to two levels of quantitative feed deprivation (75% and 50% of the recommended diets, respectively mild and severe FR) that was im-posed for one or two weeks periods. In this study, metabolite modifi cations were found in feed restricted regimen at day 42 when compared to controls, although presenting signifi cance for UAc, cholesterol, LDL and HDL/LDL calculated ratios.
In the study presented herein, no statistical changes were found for Glu plasmatic concentrations between feed restricted groups and controls at day 42, although lower absolute concentrations were found in mild feed restrict groups and higher values were found in severe, short period FR birds. Controversial responses of blood Glu to feed restriction are
avail-able. It is currently accepted that blood Glu is under a fi nely tuned control mechanism even during fasting, although differences between genetic lines, sex, age and husbandry conditions (meal intervals and stress, for example) may induce small changes in blood Glu parameters [6,19]. It have been reported that broilers submitted to mild FR showed a tendency to present a slighter decrease in plasmatic Glu concentration in comparison to severely feed restricted birds [9,29], which is in accordance with our results. Further, non-signifi cant changes in Glu blood levels in response to feed restriction have also been previously reported [9,19,28]. In opposition, several reports exists on signifi cant changes in blood Glu concentrations after feed restriction [1,5,15] and also references to dif-ferent responses according to age [6] may be found. Controversial results from the cited reports may result, among others, from the use of different strategies for feed restriction, the genotype, the bird´s age or the rearing phase, duration of food deprivation and, mostly important time of analysis regarding feed restriction imposition [10]. Even so, slight increases in Glu blood concentrations may be found in previously FR birds, although without statistical signifi cance [28]. Also in our study, although without signifi cance, higher blood Glu concentrations were found in birds submitted to severe feed restrictions for one week (T2) while the concentrations for those submitted to the same feed re-gime for 2 weeks (T3) approaches the ones for controls (T1) and the mild FR (T4 and T5) groups. This could suggest that in birds from group T3 the mechanisms of gluconeogenesis re-established blood Glu concen-trations more effi ciently than in birds from group T2. In fact, it would be expected that early after starting feed restriction Glu blood levels would decrease, in association to fasting. However, due to the endocrine regulatory mechanisms it is also preview that after 7 days of food deprivation Glu blood concentrations returns to normal due to gluconeogenesis [8,10,38].
Blood UAc concentrations may vary with diet (according to the protein content or to the energy: protein ratios), changes in its blood concentrations may also be associated with stress (in response to cor-ticosterone raising) and to increased gluconeogenesis [28]. In fasting birds, gluconeogenesis from proteins is frequently associated with UAc increases in blood [8]. In the study presented herein, higher values of UAc were found in animals submitted to severely
re-stricted feeding, even of not signifi cant, in comparison to controls and mild severe FR groups suggesting that gluconeogenesis was signifi cantly lower in mild feed restriction groups, in particular in the short duration (T4) group. Increased UAc concentrations were found in birds submitted to severe FR, in particular in those offered a short period fasting, suggesting that in those animals gluconeogenesis mechanism (catabolism of proteins as precursors for glucose) is activated.
Our results also insinuate that gluconeogenesis is more demanding in birds submitted to severe FR of short duration (1 week) when compared to longer fasting periods of the same intensity (2 weeks). Simi-lar results in UAc blood concentrations in association with FR are available [8,28], despite that in the studies from other teams reduction in blood UAc have been also reported [15,26,34]. Controversial results from different studies may originate in differences in the feed deprivation intensities or types (qualitative vs. quantitative), the moment of evaluation towards the ending of the restriction period or the genetics or sex of the experimental animals. Nevertheless, we could propose that, on what concerns the catabolic stage of broilers, independently of the length of the FR (one or two weeks restriction periods), mild quantitative feed restriction is less demanding for the organism than severe FR regimes, when imposed during the starter phase of rearing, and consequently less stressful and consequently less harmful to animal welfare.
When analysing the blood lipid metabolites profi les in the present study, overall changes point to an increase in lipid availability in blood for ani-mals submitted to mild restriction feed, which could present some negative effects on the carcass fi nal fat content. However, it is true that the birds genetics is an important modulator for the blood lipid profi le, as lean and fat breeds may respond differently to food de-privation and show distinct changes in cholesterol and triglycerides upon fasting Hermier et al. [12,14,20,21]. Also the blood lipid profi le may be infl uenced by the dietary fat source [35]. In the study presented herein, total plasmatic cholesterol (TC) was found to be dif-ferent amongst treatment groups, but not the total triglycerides concentrations in blood. Particularly, sticking increases were found in TC for the mild feed deprivation groups (T4 and T5), which parallels a slight decrease in TG levels in blood. Also, TC concentrations in blood encompassed lower VLDL and higher LDL,
HDL plasma concentrations for those treatment groups, as well as a decreased HDL/LDL ratios. Comparing the overall changes in the lipid profi le in broilers sub-mitted to a mild or a severe feed restriction regimes in our study, one could say that in the former, VLDL concentrations in plasma and HDL/LDL ratios are sug-gestive of a lower availability of lipids for fat deposition in the carcass, even if LDL levels are raised towards those of controls. Further, this effect also seems to be independent of the FR treatment period, as no differ-ences were found within the degree of FR when time of fasting was considered. Though variable reactions have been reported in birds of different genetics (lean vs. fat lines) [13,24], it is commonly accepted fat deposition is positively correlated with VLDL, LDL and cholesterol blood levels, and that fat deposition depends mainly on available VLDL transported triglyceride [13,14,20,21]. Hence adipose tissue accretion is associated with TG removed from the plasma [20]. Triglycerides are the most important source of fatty acids for fat accumula-tion [37]. VLDL concentraaccumula-tions in blood have been associated with an increased hepatic lipogenesis, which was found not being a limiting factor on susceptibility to fattening [14,27]. In commercial birds lines, where broilers are selected for rapid growth rate, its food conversion effi ciency often leads to excessive fat ac-cumulation. Thus, the balance between synthesis and secretion of VLDL may be determinant for regula-tion of fattening in poultry [37]. Results concerning the lipid profi le following FR are in accordance with previous reports [28,31] taking into consideration the broilers age at FR, the FR regime infl icted, and the moment of blood collection regarding the ending of FR. For the treatments tested herein, birds submitted to severe FR for 2 weeks showed the highest TG, VLDL plasma concentrations, with higher HDL/LDL ratios, and also higher concentrations in UAc, suggestive of an increased protein catabolism and increased lipid availability for fat deposition.
No differences were found in the work pre-sented here on what concerns the total protein and total albumin plasma concentrations by d 42. Similar fi ndings have also been reported in other studies [4,19]. Nevertheless, other studies [17,36] report the existence of signifi cant effects of FR on total protein or albumin parameters. Protein plasma levels can vary with the diet protein content (both qualitative or quantitative), the stress level, the FR regime, the environmental factors
and the genetics, among other factors, which could explain some of the differences found in available references.
CONCLUSION
For concluding, data gathered in the present study showed that quantitative feed restriction starting by day 8, followed by ad libitum was associated with changes in plasma metabolite concentrations. These changes varied between the two different intensities of FR and the two periods of FR evaluated. The results suggest that, for the same intensity of feed restriction, the length of deprivation may not be a determinant fac-tor in mild FR. However, when severe FR is imposed, the length of FR may be a risk factor for excessive protein catabolism and increased VLDL availability, with the latter favouring precocious fattening of the carcasses. New studies are warranted to strength these results in particular on respect to the establishment of
the infl uences of such changes in plasma metabolites with fatness and fat distribution on broilers.
SOURCES AND MANUFACTURERS
1Multifenelic - Sigma-Aldrich, St. Louis, MO, USA.
2Benzalkonium chloride - Sigma-Aldrich, St. Louis, MO, USA. 3Formalex® - American Master Tech, Lodi, CA, USA.
4Salinomycin - Cayman Chemical Company, Ann Arbor, MI, USA. 5EDTA - Sigma-Aldrich, St. Louis, MO, USA.
6Lab Mark - Prague, Czech Republic.
Acknowledgments. This work was based on the MSc. thesis of
fi rst author, and it was entirely supported by the Rasht Branch, Islamic Azad University, that we gratefully acknowledge.
Ethical approval. Use of birds in this study was approved by
the local institutional animal ethical committee (Protocol 17-16-5-10938; 90-11-15).
Declaration of interest. The authors report no confl icts of
interest. The authors alone are responsible for the content and writing of the paper.
REFERENCES
1 Alparslan G. & Ozdogan M. 2006. The effects of diet containing fi sh oil on some blood parameters and the
perfor-mance values of broilers and cost effi ciency. International Journal Poultry Science. 5: 415-419.
2 Aviagen. 2009. Broiler management manual. http://en.aviagen.com/assets/Tech_Center /Ross_Broiler/Ross_Broiler_ Manual_09. pdf. 114p.
3 Aviagen. 2009. Broiler Nutrition Supplement.http://en.aviagen.com/assets/Tech_Center /Ross_Broiler/Ross_ Nutri-tion_Supplement. pdf. 24p.
4 Balog J.M., Anthony N.B., Cooper M.A., Kidd B.D., Huff G.R., Huff W.E. & Rath N.C. 2000. Ascites syndrome
and related pathologies in feed restricted broilers raised in a hypobaric chamber. Poultry Science. 79(3): 318-323.
5 Bavelaar F.J. & Beynen A.C. 2004. The relation between diet, plasma cholesterol and atherosclerosis in pigeons,
quails and chickens. International Journal Poultry Science. 11: 671-684.
6 Boostani A., Ashayerizadeh A., Mahmoodianfard H.R. & Kamalzadeh A. 2010. Comparison of The Effects of
Several Feed Restriction Periods to Control Ascites on Performance, Carcass Characteristics and Hematological Indices of Broiler Chickens. Brazilian Journal Poultry Science. 12(3): 171-177.
7 Cangar O., Aerts J.M., Vranken E. & Berckmans D. 2007. Online growth control as an advance in broiler farm
management. Poultry Science. 86(3): 439-443.
8 de Beer M., McMurtry J.P., Brocht D.M. & Coon C.N. 2008. An examination of the role of feeding regimens in
regulating metabolism during the broiler breeder grower period. 2. Plasma hormones and metabolites. Poultry Science. 87(2): 264-275.
9 de Jong I.C., van Voorst A.S. & Blokhuis H.J. 2003. Parameters for quantifi cation of hunger in broiler breeders. Physiology Behavior. 78(4-5): 773-783.
10 Dewil E., Darras V.M., Spencer G.S., Lauterio T.J. & Decuypere E. 1999. The regulation of GH dependent hormones
and enzymes after feed restriction in dwarf and control chickens. Life Sciences. 64: 1359-1371.
11 Dunnigton E.A. & Siegel P.B. 1996. Long-term divergent selection for eight-week body weight in white Plymouth
rock chickens. Poultry Science. 78: 1168-1179.
12 Hermier D., Quignard-Boulangé A., Dugail I., Guy G., Salichon M.R., Brigant L., Ardouin B. & Leclercq B. 1989.
Evidence of enhanced storage capacity in adipose tissue of genetically fat chickens. Journal of Nutrition. 119(10): 1369-1375.
13 Hermier D., Salichon M.R. & Whitehead C.C. 1991. Relationships between plasma lipoproteins and glucose in fasted
chickens selected for leanness or fatness by three criteria. Reproduction Nutrition Development. 31(4): 419-429.
14 Hermier D. 1997. Lipoprotein metabolism and fattening in poultry. Journal of Nutrition. 127(5): 805S-808S. 15 Homswat S. 1999. Blood chemistry, hematology, plasma protein electrophoretic patterns and hemoglobin
electropho-resis bands in pheasant. Natural Science. 33: 377-379.
16 Hornick J.L., Van Eenaeme C., Gérard O., Dufrasne I. & Istasse L. 2000. Mechanisms of reduced and
compensa-tory growth. Domestics Animal Endocrinology. 19(2): 121-132.
17 Jang I.S., Kang S.Y., Ko Y.H., Moon Y.S. & Sohn S.H. 2009. Effect of Qualitative and Quantitative Feed
Restric-tion on Growth Performance and Immune FuncRestric-tion in Broiler Chickens. Asian-Australian Journal of Animal Science. 22(3): 388-395.
17 Khetani T.L., Nkukwana T.T., Chimonyo M. & Muchenje V. 2009. Effect of quantitative feed restriction on broiler
performance. Tropical Animal Health Production. 41: 379-384.
18 Kubíková Ľ., Vý boh P. & Košťál Ľ. 2001. Behavioural, endocrine and metabolic effects of food restriction in broiler
breeder hens. Acta Veterinaria Brno. 70: 247-257.
19 Musa H.H., Chen G.H., Cheng J.H. & Yousif G.M. 2007. Relation between abdominal fat and serum cholesterol,
triglycerides, and lipoprotein concentrations in chicken breeds. Turkish J Veterinaria Animal Science. 31: 375-379.
20 Musa H.H., Chen G.H., Wang K.H., Li B.C.M., Mekki D.M., Shu J.T. & Ju H.P. 2006. Relation between serum
cholesterol, lipoprotein concentration, and carcass characteristics in genetically lean and fat chicken breeds. Journal
of Biological Science. 6(3): 616-620.
21 Nielsen B.L., Litherland M. & Noddegaard F. 2003. Effects of qualitative and quantitative feed restriction on the
activity of broiler chickens. Applied Animal Behaviour Science. 83: 309-332.
22 NRC. 1994. Nutrient requirements of domestic animals.Nutrient requirements of poultry. 9th rev. ed., National Research
Council, National Academy Press: Washington, DC, 157 p.
23 Osorio J.H. & Flórez J.D. 2010. Biochemical differences in poultry lipoprotein metabolism [In Spanish]. BIOSALUD. Revista de Ciências Básicas. 10(1): 88-98.
24 Oyedeji J.O. & Atteh J.O. 2005. Response of Broilers to Feeding Manipulations. International Journal Poultry Science. 4(2): 91-95.
25 Ozdogan M. & Aksit M. 2003. Effects of feeds containing different fats on carcass and blood parameters of broilers. Journal of Applied Poultry Research. 12: 251-256.
26 Pourreza J., Sadeghiand G. & Mehri M. 2004. Scott chicken feed (translation). Arkan publication, Esfahan, p.672. 27 Rezaei M. & Hajati H. 2010. Effect of diet dilution at early age on performance, carcass characteristics and blood
parameters of broiler chicks. Italian Journal of Animal Science. 9(19): 93-100.
28 Rezaeipor V., Palangi M. & Irani M. 2010. Effect of Early feed restriction with or without enzyme
supplementa-tion on performance, nutrients digestibility and blood biochemical parameters of broiler chickens. Journal of Animal
Veterinaria Advance. 11(5): 622-626.
29 Ross Breeders. 1995. Ross 308 Parent Stock Management Manual. Midlothian, Ross Breeders. 180p.
30 Santoso U. 2001. Effects of early feed restriction on growth, fat accumulation and meat composition in unsexed broilers
chickens. Asian-Australian Journal of Animal Science. 14(11): 1585-1591.
31 Savory C.J., Kostal L. & Nevison I.M. 2006. Circadian variation in heart rate, blood pressure, body temperature and
EEG of immature broiler breeder chickens in restricted-fed and ad libitum-fed states. British Poultry Science. 47(5): 599-606.
32 Urdaneta-Rincon M. & Leeson S. 2002. Quantitative and qualitative feed restriction on growth characteristics of
male broiler chickens. Poultry Science. 81(5): 679-688.
33 Vakili R. & Akbarogli F. 2006. Effect of feed restriction method during rearing on growth and blood indices of stress in
broiler breeder. Proceedings of the XII European Poultry Conference. Italian Journal of World´s Poultry Science. pp 6.
34 Velasco S., Ortiz L.T., Alzueta C., Rebolé A., Treviño J. & Rodríguez M.L. 2010. Effects of inulin supplementation
and dietary fat source on performance, blood serum metabolites, liver lipids, abdominal fat deposition, and tissue fatty acid composition in broiler chickens. Poultry Science. 89(8): 1651-1662.
www.ufrgs.br/actavet
1144
35 Verma D.N. 1975. The effect of age and sex on the serum proteins of the white leghorn birds. Indian Veterinary Journal.
52: 544-546.
36 Wang K.H. & Musa H.H. 2007. The impact of obesity on serum biochemical components. Journal of Cell and Animal Biology. 1(5): 087-091.
37 Yang Y.X., Guo J., Yoon S.Y., Jin Z., Choi J.Y., Piao X.S., Kim B.W., Ohh S.J., Wang M.H. & Chae B.J. 2009.
Early energy and protein reduction: effects on growth, blood profi les and expression of genes related to protein and fat metabolism in broilers. British Poultry Science. 50(2): 218-227.
![Figure 1. Box-plot representation for the treatment associated changes in blood metabolites concentration at day 42 in male Ross 308 broilers [329 x 499 mm (72 x 72 DPI)].](https://thumb-eu.123doks.com/thumbv2/123dok_br/15844507.1084764/6.892.224.697.80.921/figure-representation-treatment-associated-changes-metabolites-concentration-broilers.webp)