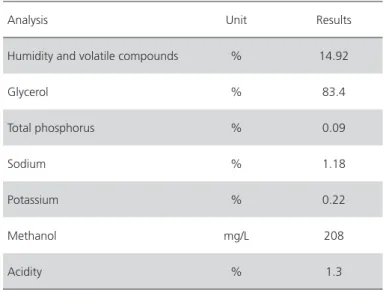
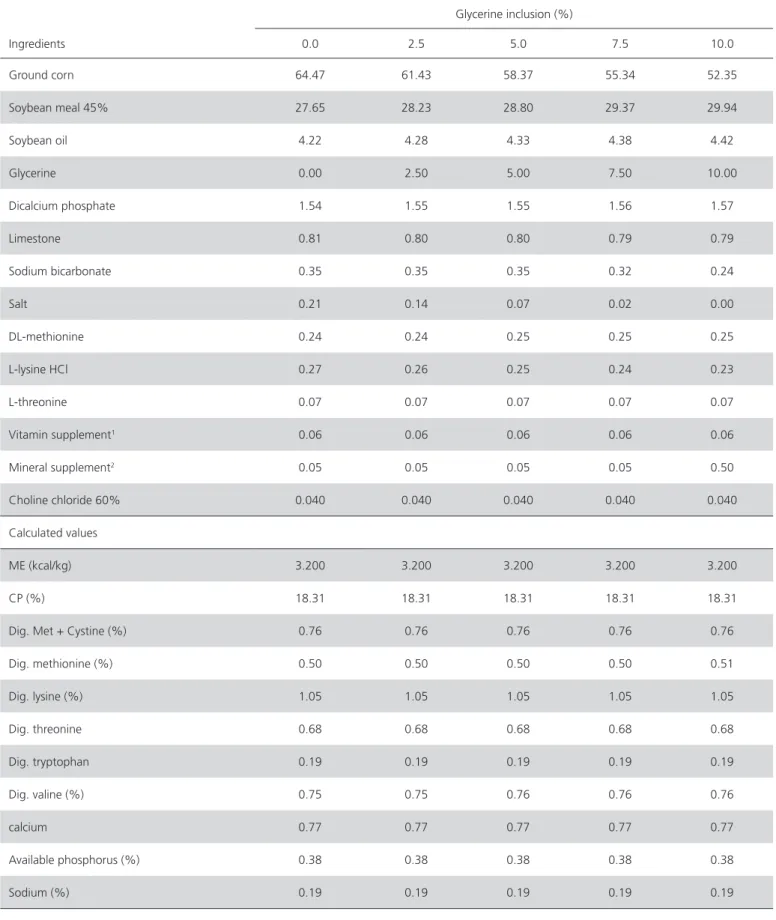
Table 1 – Composition of the crude glycerine included in the diets
Texto
Imagem


Documentos relacionados
The probability of attending school four our group of interest in this region increased by 6.5 percentage points after the expansion of the Bolsa Família program in 2007 and
The decrease in weight gain of the broilers at 21 days due to the increase in sunflower cake levels in the diet probably occurred as a result of the increased fiber
The results of the economic analysis (Table 7) showed a linear increase (P<0.05) in the cost of feed per kilogram of weight gain as the levels of sticky coffee hull silage
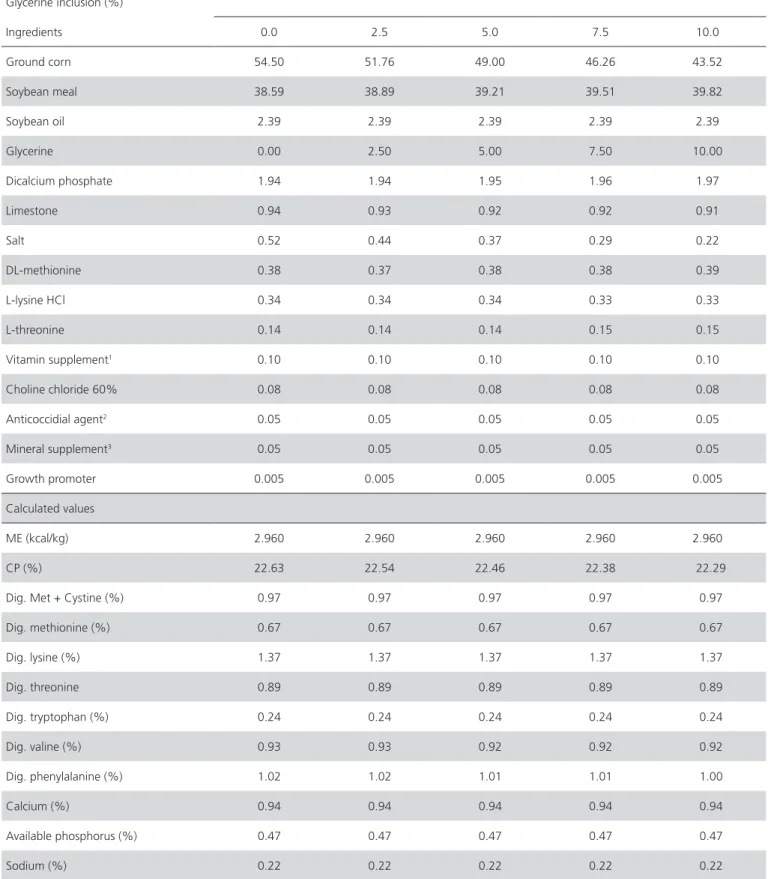
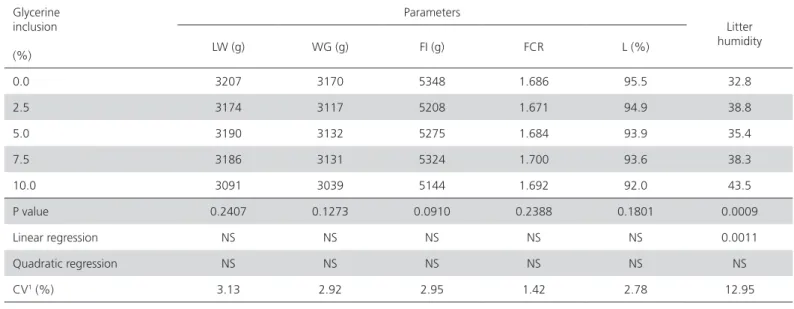
Boso (2011) evaluated the inclusion of crude and semi-purified glycerine in layer diets, and reported that excreta moisture increased as dietary glycerine level
Inclusion of increased levels of SPC in pre-starter and starter diets did not affect the final body weight, body weight gain, feed intake, feed conversion ratio and viability
Ousasse apontar algumas hipóteses para a solução desse problema público a partir do exposto dos autores usados como base para fundamentação teórica, da análise dos dados
Soil Erosion Susceptibility Analysis using RUSLE model source : class work - LA 2050 Edges of Alqueva Reservoir : Before
Como uma mesma cultivar convencional pode ser comercializada com mais de uma versão transgênica, 74 cultivares normais (19 híbridos triplos e 55 híbridos simples) também são
