i
The Impact of Knowledge Management
Systems on Organizational Effectiveness and
Innovation
NINA BAJRAKTAROVA
Dissertation presented as partial requirement for obtaining
the Master’s degree in Statistics and Information
ii
The Impact of Knowledge Management
Systems on Organizational Effectiveness and
Innovation
NINA BAJRAKTAROVA
Dissertation presented as partial requirement for obtaining
the Master’s degree in Statistics and Information
i
Title:The Impact of Knowledge Management Systems on Organizational Effectiveness and Innovation
Subtitle:
NINA BAJRAKTAROVA
MEGI
2015
2015
Title:The Impact of Knowledge Management Systems on Organizational Effectiveness and Innovation
Subtitle:
2
NOVA Information Management School
Instituto Superior de Estatística e Gestão de Informação
Universidade Nova de Lisboa
The Impact of Knowledge Management Systems on
Organizational Effectiveness and Innovation
by
Nina Bajraktarova
Dissertation presented as partial requirement for obtaining the Master’s degree in Information Management, with a specialization in Information Systems Management
Advisor: prof. Guilherme Martins Victorino ( NOVA IMS, Universidade Nova de Lisboa)
Co Advisor: prof. dr. Miro Gradišar ( Faculty of Economics, University of Ljubljana )
3
ABSTRACT
The new digital age has been triggering dramatic changes in the way organizations think and operate. If we can learn one important lesson from the history of organizational management, it is that the knowledge and the management are the vital organs behind every surviving
organization. Today, the greatest importance lies when combining the two - the intellectual property of the organization.
This paper looks into the importance of Knowledge Management and analyses the impact that Knowledge Management Systems have on organizational effectiveness and ultimately,
innovation.
Many manufacturing companies from the Balkan region value the traditional way of operating. They remain to have hierahcy, centralized decision making and are seen to adapt to the
technological changes on a slower rate when compared to other regions of Europe. Many of them have non-serial manufacturing. Often, due to the size of the country of origin of the individual organization, the only way to stay in business is by having tailored production. This increases the need for Knowledge Management.
The purpose of this research is to get a better perspective on how Knowledge Management is embraced in manufacturing companies in order to see how information technology can help in the future.
Data were collected with the use of an online survey sent to organizations. In order to obtain reliable data on the research and to have a more realistic view of the processes of knowledge management, this research includes organizations with different number of employees and different years of existence.
Despite still having a centralized decision making and a more traditional organizational
environment with noticeable hierarchy, manufacturing organizations in the Balkan Region today strive for improvement and have a high level of recognition for the need of Knowledge
Management, according to the results from the analysis.
KEYWORDS
Knowledge Management; Knowladge Management Systems; Information Technologies; Organizational Effectiveness; Innovation; Manufacturing Companies; Balkan Region
4
TABLE OF CONTENT
1.
Introduction ... 10
2.
Theoretical foundations ... 12
2.1.
Knowledge Management (KM) ... 12
2.2.
Data, Information, Knowledge ... 13
2.3.
The Value of Knowledge to the Organization ... 14
2.4.
Four-process models of knowledge management ... 14
3.
Information Systems For Knowledge Management ... 16
3.1.
The Importance of Knowledge Management Systems (Manufacturing Industry)17
4.
Methodology ... 18
4.1.
Research Problem ... 18
4.2.
Research goals and objectives ... 18
4.2.1.
Main purpose ... 18
4.2.2.
Research Assignments ... 18
4.3.
Hypotheses ... 19
4.3.1.
General hypothesis ... 19
4.3.2.
Specific hypotheses... 19
4.4.
Research Type and Design ... 19
4.5.
Research respondents ... 20
4.6.
Example of variables and method of their measurement ... 20
4.7.
Data Analysis ... 21
5.
RESEARCH RESULTS ... 22
5.1.
Basic demographic indicators of the respondents ... 22
5.2.
Results about Strategies, Approaches and Processes ... 25
5.2.1.
Information on strategies, approaches and processes related to the collection
and creation of knowledge from attributive indicators ... 25
5.2.2.
Information about effective knowledge management and innovation from
attributive indicators... 32
5.3.
Numerical indicators in the research ... 48
5.3.1.
Basic descriptive indicators from the assessment carried out for information
on strategies, approaches and processes related to collection of knowledge ... 48
5.3.2.
Basic descriptive indicators from the assessment carried out for information
on strategies, approaches and processes related to the storage and transfer of
knowledge 53
5.3.3.
Basic descriptive indicators of the performed assessment for the effective
knowledge management and innovation ... 59
5
5.4.
Results from the assessments carried out in the processes of collecting, sharing,
transferring and managing knowledge and innovation ... 64
5.4.1.
The ratio of indicators in the processes related to knowledge collection64
5.4.2.
The ratio of indicators in the processes related to the storage and transfer of
knowledge 66
5.4.3.
The ratio of indicators related to effective knowledge management and
innovation 70
5.5.
The relationship between the processes for collecting, sharing, utilizing and managing
knowledge and Innovation ... 73
5.5.1.
Relationship between the indicators in processes related to the collection of
knowledge according to the number of employees and the years of existence of
organizations... 73
5.5.2.
Assistence of indicators in the processes related to the storage and transfer of
knowledge to organizations by number of employees and years of existence ... 81
5.5.3.
Relationship between indicators for effective knowledge management and
innovation according to the number of employees and years of existence ... 89
5.6.
Interpretation of the obtained results ... 97
5.6.1.
Interpretation of the obtained results for the processes of collecting, storing
and transfering knowledge ... 97
5.6.2.
Interpretation of the obtained results for effective knowledge management
and innovation ... 98
5.6.3.
Verification of hypotheses ... 98
6.
Conclusion ... 100
6.1.
Theorethical Implications ... 100
6.2.
Practical Implications ... 100
7.
limitations and recommendations for future works ... 102
8.
Bibliography ... 103
6
LIST OF FIGURES
Figure 5.1. – 1 Geographical area in which the organization operates ... 22
Figure 5.1. -2 Review of the respondents according to their work position ... 22
Figure 5.1.-3 Number of employees in the organization ... 23
Figure 5.1.-3a Number of employees in the organization ... 23
Figure 5.1.-4 Organizations by years of existence ... 24
Figure 5.1.-4a Organizations by years of existence... 24
Graphic display 5.2.1.-1 Application and use of the term "knowledge management" ... 25
Graphic display no. 5.2.1.-2 Terms used in Relation to the initiatives related to knowledge . 26
Graphic display no. 5.2.1-3 Where does knowledge reside in the organization ... 27
Graphic display no. 5.2.1-4 Online platform ... 28
Graphic display no. 5.2.1. – 5 Information on the platform ... 29
Graphic display no. 5.2.1-6 Access to the online platform ... 30
Graphic display no. 5.2.1-7 Online platform usage ... 31
Graphic display no. 5.2.2.-1 Need for innovation in products or services ... 32
Graphic display no. 5.2.2.-2 Need for innovation in organizational structure and functioning
... 33
Graphic display no. 5.2.2.-3 Opportunities from innovation ... 34
Graphic display no. 5.2.2.-4 Reasons for lack of innovation ... 35
Graphic display no. 5.2.2.-5 Innovative ideas ... 36
Graphic display no. 5.2.2.-6 Work on innovative ideas ... 37
Graphic display no. 5.2.2.-7 A team for innovation ... 38
Graphic display no. 5.2.2.-8 Workshops ... 39
Graphic display no. 5.2.2.-9 Supporting innovative ideas... 40
Graphic display no. 5.2.2.-10 Training system ... 41
Graphic display no. 5.2.2.-11 Realization of trainings... 42
Graphic display no. 5.2.2.-12 Analysis of the achievements of innovation ... 43
Graphic display no. 5.2.2.-12 Analysis of the achievements of innovation ... 43
Graphic display no. 5.2.2.-13 Educational programs ... 44
Graphic display no. 5.2.2.-14 Patent application ... 45
Graphic display no. 5.2.2.-15 Making decisions ... 46
Graphic display no. 5.2.2.-16 Funding for trainings ... 47
7
LIST OF TABLES
Table no. 5.2.1.-1 ... 26
Table no. 5.2.1.-2 Terms used in Relation to the initiatives related to knowledge ... 27
Table no. 5.2.1-3 Where does knowledge reside in the organization ... 28
Table no. 5.2.1.-4 Online platform ... 29
Table no. 5.2.1.-5 Information on the platform ... 30
Table no. 5.2.1.-6 Access to online platform ... 31
Table no. 5.2.1.-7 Online platform usage ... 32
Table no. 5.2.2.-1 Need for innovation in products or services ... 33
Table no. 5.2.2.-2 Need for innovation in organizational structure and functioning ... 33
Table no. 5.2.2.-3 Opportunities from innovation ... 34
Table no. 5.2.2.-4 Reasons for lack of innovation ... 35
Table no. 5.2.2.-6 Work on innovative ideas ... 37
Table no. 5.2.2.-7 A team for innovation ... 38
Table no. 5.2.2.-8 Workshops ... 39
Table no. 5.2.2.-9 Supporting innovative ideas ... 40
Table no. 5.2.2.-10 Training system ... 41
Table no. 5.2.2.-11 Realization of trainings... 42
Table no. 5.2.2.-13 Educational programs ... 44
Table no. 5.2.2.-14 Patent application ... 45
Table no. 5.2.2.-15 Making decisions ... 46
Table no. 5.3.1.-1 Descriptive indicators - common ... 49
Table 5.3.1.1.-1 Basic descriptive indicators of knowledge acquisition processes -
organizations classified according to the number of employees ... 50
Table 5.3.1.2.-2 Basic descriptive indicators of knowledge-gathering processes -
organizations classified according to years of existence ... 52
Table no. 5.3.2.-1 Descriptive indicators - common (storage and transfer of knowledge) ... 54
Table no. 5.3.2.1.-1 Basic descriptive indicators for storing and transferring knowledge -
classified by the number of employees in organizations ... 56
Table no. 5.3.2.2.-2 Basic descriptive indicators from the processes for storing and
transferring knowledge - organizations classified according to the years of existence .. 58
Table no. 5.3.3.-1 Descriptive indicators - common ... 60
Table no. 5.3.3.1.-1 Basic descriptive indicators for the effective management of knowledge
and innovation - organizations classified by the number of employees ... 61
8
Table no. 5.3.3.-2 Basic descriptive indicators for the effective management of knowledge
and innovation - organizations classified according to the years of existence ... 63
Table no. 5.4.1.-1 Rank correlation in the processes of collecting knowledge among the
respondents according to the number of employees ... 64
Table no. 5.4.1.-2 Differences in rank correlations in the processes of collecting knowledge
among the respondents according to the number of employees ... 65
Table no. 5.4.1.-3 Rank correlation in the processes of collecting knowledge among the
respondents according to the years of existence of the organization ... 65
Table no. 5.4.1.-4 Differences in rank correlation in the processes of collecting knowledge
among the respondents according to the years of existence of the organization ... 66
Table no. 5.4.2.-1 Rank correlation in the storage and transfer of knowledge according to
the number of employees in the organizations ... 67
Table no. 5.4.2.-2 Differences in rank correlation in the storage and transfer of knowledge
according to the number of employees in the organizations ... 68
Table no. 5.4.2.-3 Rank correlation in the storage and transfer of knowledge according to
the years of existence of the organization ... 68
Table no. 5.4.2.-4 Differences in rank correlation in the storage and transfer of knowledge
according to the years of existence of the organization ... 69
Table no. 5.4.3.-1 Rank correlation in the effective knowledge management and innovation
among the respondents according to the number of employees in the organizations .. 70
Table no. 5.4.3.-2 Differences in rank correlation in the effective knowledge management
and innovation among the respondents according to the number of employees in the
organizations ... 71
Table no. 5.4.3.-3 Rank correlation in the management of processes and investments among
the respondents according to the years of existence of the organization ... 71
Table no. 5.4.3.-4 Differences in rank correlation in the processes and investment
management of the respondents according to the years of existence of the organization
... 72
Table no. 5.5.1.-1 Relation in the processes for collecting and creating knowledge in micro
organizations ... 74
Table no. 5.5.1.-2 Relation in the processes for collecting and creating knowledge in small
organizations ... 75
Table no. 5.5.1.-3 Relation in the processes for collecting and creating knowledge in the
medium and large organizations ... 76
Table no. 5.5.1.-4 Relation in the processes for collecting and creating knowledge in
9
Table no. 5.5.1.-579 Relation in the processes for collecting and creating knowledge in
organizations by years of existence - from 11 to 20 years ... 79
Table no. 5.5.1.-6 Relation in the processes for collecting and creating knowledge of
organizations by years of existence - over 21 years ... 80
Table no. 5.5.2.-1 Relation in the processes for storing and transferring knowledge to micro
organizations ... 82
Table no. 5.5.1.-2 Relation in the processes for storing and transferring knowledge to small
organizations ... 83
Table no. 5.5.1.-3 Relation in the processes of storage and knowledge transfer in the
medium and large organizations ... 84
Table no. 5.5.2.-4 Relation in the processes for storage and retrieval of knowledge in
organizations by years of existence - up to 10 years ... 86
Table no. 5.5.2.-5 Relation in the processes of merging and transferring knowledge to
organizations by years of existence - from 11 to 20 years ... 87
Table no. 5.5.2.-6 Relation in the processes for storing and transferring knowledge to
organizations by years of existence - over 21 years ... 88
Table no. 5.5.3.-1 Relation in processes for effective knowledge management and innovation
in micro organizations ... 90
Table no. 5.5.3.-2 ... 91
Relation in processes for effective knowledge management and innovation in small
organizations ... 91
Table no. 5.5.3.-3 Relation in processes for effective knowledge management and innovation
in middle and large organizations ... 92
Table no. 5.5.3.-4 Relation in processes for effective knowledge management and innovation
in organizations by age - up to 10 years ... 94
Table no. 5.5.3.-5 Relation in processes for effective knowledge management and innovation
in organizations by age - from 11 to 20 years ... 95
Table no. 5.5.3.-6 Relation in processes for effective knowledge management and innovation
10
1. INTRODUCTION
Knowledge Management, which can also be found in the literature under ‘Management of the intellectual capital of an organization’ is a field of study that has progressed from simply being an academic theory to now representing a vital component of all existing organizations.
In this decade, organizations are increasing their focus on knowledge as a resource. The question of many researchers still remains in the line of why this science field emerged in the first place and why did organizations need many years to recognize its real value?
Several world trends have had a significant impact on the development of this science, such as: • The globalization of the economy, which has made strong pressure on companies in
increasing their adaptability, innovation and reaction to change;
• Increased awareness about the importance of specialized knowledge embedded in organizational processes and practices;
• Increased awareness about the importance of knowledge as an obvious source of competitive advantage.
Existing in an era of rapid technical and technological development, rapid change and selective customers, one of the main prerequisites in gaining a competitive advantage is in the ‘know how’ of the companies. In today’s business environment, the knowledge a company possesses, along with the ability to transfer, multiply and utilize that knowledge, all play a significant role in where the company stands on the market.
The process of innovating today is a product of effective and efficient group work. An effective work that is fundamentally a result of shared knowledge on how the machines operate, how can their work be improved, what are the requirements and demands of the consumers, and how can services be improved to fit the consumer needs and wants.
It is not uncommon for organizations in the Balkan region to have extremely valuable knowledge that is not been stored properly or at all. It often gets to a point that they forget knowledge is being possessed in the first place. In fact, lost information throughout the organizational archives and knowledge left behind in the minds of the employees is a problem that many companies share - a problem that in the long run costs them both money and market power. In order to prevent knowledge of becoming obsolete, knowledge management is necessary. The issue of organizational knowledge management is treated in a variety of ways. Some organizations look at knowledge management in a traditional way by focusing on the collection and organization of knowledge, with high emphasis on measuring and planning how to utilize it. While others view this on a much deeper level, by dealing with numerous questions in relation to the following: circulation of knowledge in the organization; transfer of knowledge; knowledge growth and multiplication; collection of new knowledge; storage of knowledge; as well as questions about what happens to the knowledge of individuals that have left or are leaving the organization.
11 Knowledge is the only resource that can be sold, re-used, shared, and again available to be traded in any way and yet to still remain in possession of the initial owner. It is also the only resource that grows when being shared.
Regardless of how we treat knowledge management, theorists agree that there is a strong link between knowledge and power. Dating back to the oldest theories on knowledge management, power cannot be practiced without knowledge and it is impossible for knowledge not to cause power. So as long as knowledge and power are interconnected, knowledge management will result in social and economic power. [Michel Foucault, 1969]
The aim of this paper is to combine the theory and practice in the fields of knowledge management and knowledge management systems. The main goal is to identify the relation between the application of information systems for knowledge management and organizational effectiveness and innovation. The focus is put on manufacturing companies of the Balkan region due to the interest in how they embrace Knowledge Management today.
In the Balkan region many organizations in the manufacturing industry have non-serial production. Many times, due to the size of the country of origin of the individual organization, the only way to stay in business is by having tailored production. This by itself increases the need for Knowledge Management and is the reason why it is important to get a better perspective on how Knowledge Management is understood and embraced.
The paper is structured in the following parts: an introduction, a literature review, methodology, research results with interpretation and a conclusion.
12
2. THEORETICAL FOUNDATIONS
Knowledge sharing is not a new behavior. History shows an endless aspiration and a basic need of the human race for knowledge circulation. It is a behavior old not centuries but millenniums. One of the first undertakings in the field of knowledge collecting and sharing takes place in the beginning of the third century of the new era when the Egyptian King Ptolemy I Soter built a library in Alexandria. His goal was to gather copies of all that was ever written, all over the world, until that time. In fact, there is no major difference in the core idea of knowledge
management in organizations today and the knowledge management behind the purpose of this library that is rightfully considered to be the first center of knowledge.
2.1.
K
NOWLEDGEM
ANAGEMENT(KM)
Defining the term knowledge management with a single definition has been and is still almost impossible. There are hundreds of definitions used in the literature today, all being adapted to an environment and discipline.
In a more recent publication, [“Defining knowledge management: Toward an applied
compendium” 2015], the authors have tried to record the depth and scope of applied knowledge management definitions written by researchers and practitioners. Collectively the definitions characterize the thoughts of authors across 13 countries and 23 different domains. The
collection includes over 100 definitions, confirming the true depth and multidisciplinary nature of knowledge management. By analyzing the words used in each of the hundreds of definitions with a word parsing tool, a list of words was created.
At the top of the list of words that are mostly used to define knowledge management were: knowledge; organization; process; information; use; share; create; manage; assets; people; practice; improve; systematic; capture; value; resources; organizing.
Therefore, if we only take into account the words that appear most often, the definition of knowledge management would be one of the following:
“Knowledge Management is the process of creating, sharing, using and managing the knowledge and information of an organization. “
“Knowledge Management is the management process of creating, sharing and using organizational information and knowledge.”
Although the concept of knowledge management is not new, the approach that managers today are beginning to use is different. Parallel to the rapid changes on the market, successful
managers are taking advantage of knowledge and its value. However, in order to ensure an effective working organization, even those who managed to catch up with the technological changes and informational revolution, still remain to find the right system and approach that will enable knowledge management and information understanding.
Organizations need good practices, new ideas, creative thinking and collaboration. All this, can be ensured only through effective management and use of knowledge.
13
2.2.
D
ATA,
I
NFORMATION,
K
NOWLEDGEThere are numerous interpretations that can be found through the literature on knowledge and the importance of knowledge (in epistemology, in sociology, in psychology).
As stated by Polany, there is no certain definition for both knowledge and knowledge management [Polany, 1966].
However, the ideas behind data and information are very different from that of knowledge. Holsapple points out that, while data is seen as a collection of unprocessed, non-actualized facts, numbers and events, the information is organized and processed data that is time-accurate [Holsapple, 2003].
Data as a general concept commonly associated with scientific research, refers to the fact that some information or knowledge is represented or coded in a form suitable for usage or processing. Data represents a set of values of qualitative or quantitative variables.
Data is a unique set of symbols representing a perception of raw facts. (Zinz, 2007 citing Nicolae Dragulanescu) Data is measured, collected, reported, analyzed, and can be visualized using graphs, tables, images or other tools for analysis. It exists on its own; it does not constitute a basis for action, and is a physical, solid, item with an objective existence. Data only describes what is happening, it does not interpret the events or the cause of those events.
Unlike data, information has meaning, purpose and relevance. Information is an entity/form that reduces uncertainty and provides an answer to a certain question.
Information is corpuscular, quantifiable, commoditized, objective and ‘out there,’ transferable, interconvertible, transparent, autonomous and measurable. It has shape and can be processed and accessed, generated and created, transmitted, stored, sent, distributed, produced and consumed, searched for, used, compressed and duplicated. Information can also be of different types with different attributes. It can be sensitive information, qualitative or quantitative information. Modern uses even extend its use to biological cells using and transmitting
information, with cancers, for example, seen as spreading misinformation. [Jonathan Hey, 2004] The understanding of knowledge seems to be quite different in comparison to both data and information. Knowledge can be implicit (practical skill/expertise) or explicit (theoretical
understanding of a topic) and is usually personal and subjective. On an organizational level - it is found in the people. Knowledge is formed and shaped by the individual perceptions and
experiences of the holder.
According to literature covering knowledge management, there are two different types of knowledge: tacit and explicit.
Tacit knowledge is the kind of knowledge that is difficult to transfer from one person to another by Mean of writing or verbalizing. It is a type of knowledge that is hard to encode and
communicate. [Polany,1966]. Furthermore, tacit knowledge is subjective, personal, context-specific and difficult to formalize [Nonaka and Takeuchi, 1995].
On the contrary, explicit knowledge is the type that can be easily transferred from one person to another. It can be encoded and is able to be communicated in language. This is in fact the type of
14 knowledge that Knowledge Management practices are able to more easily capture, create, retain, control, codify, store, transfer, share and multiply.
2.3.
T
HEV
ALUE OFK
NOWLEDGE TO THEO
RGANIZATIONIn an age when data and information have a significant impact on competitive advantage, it gets even more frequent for knowledge to be seen as a corporate asset.
In many organizations, however, the economic value of that asset is like beauty, it is in the eye of the beholder. Knowledge itself seems to hardly ever be in the focus of managers. They feel it is too abstract and academic, so they usually do not see the economic benefit it offers. But, they do have understanding of its importance in terms of organizational performance. Whether it is for educated decision making, recognizing the causal relationships that affect organizational processes, or for predictions of the future, knowledge plays a necessary role.
Overall, the accumulated body of data, information, and knowledge generated in the course of an organization's life, is organizational memory and refers to products, production, raw materials, customers, marketing strategy, financial performance, strategic plans, goals of the organization and much more. By utilizing knowledge, organizations constantly increase their power by adjusting and adequately responding to the external environmental, social, political, and market changes as well as consumer needs and demands.
Placing knowledge in the focus of the organization leads to positive changes in several areas, such as:
• Improved response to organizational change; • Improved products and services;
• Increase in revenues by improving the placement of products and services; • Increased market presence;
• Improved work operations and reduced costs by eliminating insignificant and/or unnecessary processes.
2.4.
F
OUR-
PROCESS MODELS OF KNOWLEDGE MANAGEMENTWhat is mutually found in most definitions is that knowledge management is a compound activity that contains multiple processes. Different people have explained these processes in a different manner.
To begin with, the area of knowledge management, according to Suresh, includes: management, business processes, information technologies, business strategy and the individual potential of people [Suresh, 2005].
In general, knowledge management can be viewed as a process that is closely related to organizational goals, the processes of an organization, competitive advantage, the practice of
15 cooperation and the sharing of lessons learned. It is very often associated with the idea of
learning organizations. Organizations encourage employees to learn by promoting the exchange of information in order to create a workforce that is using knowledge efficiently and on an increasing rate. In order to deliver the right information to the right user, knowledge
management includes data mining, information systems and methods for delivering information. Furthermore, knowledge management is a constant process of organizational knowledge
renewal, which significantly differs from business process reengineering or total quality management (TQM).
Jeff Angus and Jeetu Patel have described a four-process view of knowledge management. Their model consists of: (1) Gathering, the collection of knowledge that encompasses: data entry, optical character recognition (OCR) , Scanning Voice input, collecting information from various sources and searching for information to be included; (2) Organizing, knowledge organization which includes: categorization, indexing, filtering and linking; (3)Refining, a process that includes: contextualizing, collaborating, compacting, projecting and mining; (4) Disseminating, which includes: flow of knowledge, sharing, alert and push. [Jeff Angus & Jeetu Patel, 1998] In the literature, however, there is also another model with four basic processes. (1) Developing new knowledge - a process that can be supported by organizational memory and encompasses continuous upgrading of knowledge through creative ideas, studies, daily experiences, and similar. (2) Protection of existing and new knowledge - a process of continuous collection of individual knowledge, storage and its proper indexing, in order to make it readily available to all in the organization in need of that knowledge. (3) Distribution of knowledge - the process of allocating knowledge to all those who benefit from it. (4) Combining the knowledge of the organization - a process that allows the knowledge acquired at different departments to be accessed from different places, with aim to make it easily available for use in multidisciplinary teams.
Finally, there is the model that is most vastly studied. Alavi & Leidner, have set up a system framework for analyzing the impact of information technology in knowledge management. The basis of this framework was set by Berger and Luckman in 1967, continued by Gurvitch in 1971 and by Holzner and Marx in 1979 [Berger & Luckman, 1967; Gurvitch 1971; Holzner & Marx, 1979] and it is based on the understanding that the organization is a social community and that it is a system of knowledge. According to this framework, organizational knowledge
management consists of four processes: (1) Capture and Creation; (2) Storing / retrieval ; (3) Transfer ; (4) Application. [Holzner & Marx, 1979; Pentland, 1995]
16
3. INFORMATION SYSTEMS FOR KNOWLEDGE MANAGEMENT
In the past few decades, the interest on knowledge inside organizations has grown enormously. Many organizations are continuously increasing their awareness of the value of knowledge, and the fact that if it is not shared and utilized within the organization, it loses all of its value. In the words of Polanyi "we all know a lot more than what we say". [Polanyi, 1966]
An organization on its own cannot know anything without the knowledge of its employees. The organization serves only as a "guardian" of the knowledge of its employees and facilitates the access to that knowledge when the employees need it. In order to facilitate the use of the
knowledge, it is necessary to make it available. In this area of enabling knowledge to be available to employees, whenever they need it, in the appropriate form they need it; organizations have to figure out a proper way of how to deliver the required solution.
Today, by choosing, introducing and applying different information technologies, companies are able to improve the quality and scope of many processes.
Information technologies are recognized as tools that deliver an exceptional opportunity for improving processes at different stages of knowledge management. When speaking of information technologies, it is referred to the technological aspect of the information system, especially the hardware, the communication technology, the operating system, the database management system, the network software and other information components.
Knowledge management is a methodology rather than a technology or a product, but
information technologies are the key to a successful knowledge management. The emphasis is no longer only on people and the organizational culture, but on technology and how it can impact today’s modern organizations.
Knowledge Management Systems are systems used for applying and using principles of knowledge management. They contain data-driven objectives in terms of business strategies, business model, business intelligence analysis etc.
A Knowledge Management System is an application designed to capture and collect all the information that lies within an organization and make it available to the employees. It is a knowledge repository software system, made up of diverse software modules served by a central user interface. In other words, it represents an "information hub" where information can be created, organized, redistributed and easily accessible through search tools and added features that allow users to find the needed information in the needed time.
Some of these features can allow for data mining on consumer input and history, alongside the provision or/and sharing of electronic documents. Knowledge management systems can not only support many work achievements such as better sales and management, but they also assist business leaders to make critical decisions and can be of great support in terms of staff training and orientation.
A Knowledge Management System is a system considered to be only one part of the overall concept of Knowledge Management, then again, a very important part.
17 Knowledge Management Systems can be of many different types, serving numerous different purposes. However, the purpose they share is the one of storing and retrieving important data, information, and knowledge.
3.1.
T
HEI
MPORTANCE OFK
NOWLEDGEM
ANAGEMENTS
YSTEMS(M
ANUFACTURINGI
NDUSTRY)
Every day, organizations obtain an enormous amount of data and information. While some of this data might not be of any relevance, other information or knowledge could be vital to the future of the organization.
Knowledge management prevents employees from constantly having to reinvent the wheel. In the manufacturing industry it is considered to be highly important since it provides a reference point for progress measurement, decreases the need of supervisory opinion, makes visual thinking tangible, and effectively manages big volumes of information in order to support the work of individuals.
In organizations with tailored manufacturing, it is of even higer importance for employees to be able to access information on old practices and sproduct solutions and not having to reinvent and start from scratch again.
This is exactly where the significance of knowledge management systems can be realized. It is the knowledge management systems that enable organizations to store, manage and distribute the data.
Most common benefits of using Knowledge Management Systems: • Improved distribution of knowledge
• Improved information accuracy and consistency • Increased employee satisfaction
• Increased productivity, less time spent searching for answers • Quicker training of new employees
• Retention of knowledge of employees leaving the organization
One of the highest benefits of having a knowledge management system is that it helps the learning process by making learning part of a routine. When learning is a routine in one
organization, it creates a type of a culture which is motivated towards constant empowerment, self-assessment and self-improvement. The possibility to learn through the use of knowledge management systems makes users more eager to learn, and can improve loads of processes. Furthermore, it makes way for innovation and workplace changes. With regular and active management of knowledge, employees tend to express their ideas and use creativity more often. When transparency is increased, and information is readily available, it gets easier to see the problems and think of solutions. Hence, it also enables informed-decision making.
18
4. METHODOLOGY
4.1.
R
ESEARCHP
ROBLEMMany of the organizations in the Balkan Peninsula still value the traditional way of working. They are putting their focus on tangible capital, while neglecting the meaning and leaving their intellectual capital unexploited.
In the manufacturing industry where companies also have non-serial manufacturing, keeping the ‘know-how’ protected is of high importance.
The problem of this research will be the integration of knowledge management in the processes of creating, identifying, collecting, sharing, practicing and applying knowledge, which will enable organizations to keep the ‘know-how’ protected and increase competitiveness.
4.2.
R
ESEARCH GOALS AND OBJECTIVES4.2.1. Main purpose
The main purpose of this research is to examine the impact of knowledge management systems on organizational efficiency and innovation in manufacturing companies in the Balkan Region.
4.2.2. Research Assignments
• Determine the extend to which knowledge management is valued in organizations; • Determine how the process of creating, identifying, collecting, sharing, practicing and
applying knowledge functions in organizations;
• Determine how and if organizations enable continuous learning, that is, whether they allow the acquisition of new knowledge and experience, as well as sharing of knowledge between employees;
• Determine whether organizations have a system that fosters individual and team development;
• Identify the relationship of innovation with the age of the organization;
• Determine whether there is a link between knowledge management and the age and size of the organization;
• Define the area of the processes of management of knowledge occurring in the organizations;
• Determine whether knowledge is integrated in the organization's strategy;
• Determine how organizations encourage employees to be innovative, search for new ideas, try out new processes, or develop new products and services.
19
4.3.
H
YPOTHESESWithin this part of the research the main hypothesis and several specific hypotheses will be elaborated.
4.3.1. General hypothesis
X-0 The application of Knowledge Management Systems implicitly influences the organizational
efficiency and innovation in the manufacturing companies.
4.3.2. Specific hypotheses
X-1 The better the circulation of knowledge - the greater the degree of innovation in the organization;
X-2 There is an interrelation between the organization's strategy and knowledge management; X-3 The size of an organization affects its knowledge management;
X-4 The age of an organization affects its knowledge management; X-5 The age of the organization affects the level of innovation;
X-6 The effectiveness of the organization is enhanced by sharing new knowledge; X-7 The education of employees encourages effectiveness;
Х-8 For a successful completion of work tasks it is necessary to have an individual plan for the development of the employees;
X-9 The shared experience of employees affects the overall performance of the organization.
4.4.
R
ESEARCHT
YPE ANDD
ESIGNAccording to the general criteria for classifying research work and according to the
methodological nature of it, this can be placed as research in which there is a valorization of certain phenomena in different conditions. According to the time frame, it is classified as
transversal research, and according to the degree of general belonging - operational research, or more precisely, developmental research, based on finding and developing better solutions. In the realization of this paper, the following research methods have been applied:
• Analytical-synthetic and inductive methods have been applied as general introductory methods;
• From the explicit methods, the empirical method was used;
• In order to process data from the survey, statistical method was used.
The survey was conducted in the first half of 2018. The course and the organization of the research was carried out in the following order: firstly, all the necessary information on this topic was collected, and then followed by the surveying of the respondents. Data collection was carried out electronically.
20 The gathering of data took place in a centralized manner, planning the research and all other preparations take one place. In the final phase of the research, data compilation was carried out through appropriate programs for statistical processing.
4.5.
R
ESEARCH RESPONDENTSFor the needs of this research, more micro, small, medium and larger organizations were covered. The survey involved 98 (ninety-eight) respondents (top managers, middle managers and employees). During the research, there were three samples of respondents according to the number of employees in the organizations and three samples of respondents according to the years of existence of the organization.
According to the number of employees in the organization:
• First sample, micro - up to 10 employees (31 respondents);
• Second sample, small - from 11 to 50 employees (31 respondents); • Third sample, medium and large - over 51 employees (31 respondents).
According to the years of existence of the organization:
• First sample, up to 1 year – (29 respondents);
• Second sample, from 11 to 20 years – (39 respondents); • Third sample, over 21 years – (30 respondents).
4.6.
E
XAMPLE OF VARIABLES AND METHOD OF THEIR MEASUREMENTThe variables applied in this research can be divided according to their measured nature of qualitative and quantitative and methodological nature in two groups - dependent and independent variables.
With qualitative – also known as attributive variables, certain descriptive categories of statements are given.
With quantitative - or numerical variables, an assessment was made on the overall area of the processes of knowledge management and the effectiveness of the management of knowledge and innovation. The estimate is made by a numerical scale (1- not applicable / I do not know; 2- to degree or less than one third, 33.3%; to a stronger degree or 33.3% -66.6%; strongly agree or 66 , 6% -100%).
Dependent variables - or criterion variables are in function or participate in the definition of knowledge management and innovation development.
Independent variables - in the group of independent or predictor variables are those that define processes of knowledge management, information about strategies and approaches related to the creation, collection, storage, transfer, etc.
21 The used data collection research technique was survey, a questionnaire, which, in addition to the demographic data, consisted of three parts:
• The first part was composed of attributive and numerical indicators that define information about the strategies, approaches and processes associated with collecting knowledge.
• The second part was made up of numerical indicators that define information about the strategies, approaches and processes related to storing and disseminating knowledge. • The third part was composed of attributive and numerical indicators related to
information on the effective knowledge management and innovation.
4.7.
D
ATAA
NALYSISDescriptive and comparative statistics were used in the data processing.
The descriptive procedures for each variable determine the frequency distribution, and for each continuous series, the central tendencies and the dispersion measures (arithmetic mean,
standard deviation, variance, rank, variation width) are calculated, and the distribution of the values of the Gaussian curve (Skewness and Kurtosis).
In the area of comparative statistics, parametric and non-parametric procedures were also used.
From the area of discriminatory procedures, was used:
• Kruskal-Wallis Test, which sets the difference in the sum of the ranks between the sub-samples defined by the number of employees in the organizations and the age of the organizations.
From the space of causal procedures, the following were used:
• Square test (χ2 - square test) for the quality of eligibility in the attributes (top managers, middle management, employees) among the respondents
• Factor analysis- used to describe variability among observed
• The determination of the link between the indicators that define the processes of management was calculated using the Pearson correlation coefficient
For the processing of the data, Excel application programs and the Statistics and SPSS program packages were used.
22
5. RESEARCH RESULTS
In the presentation of the survey results, besides the explanations for the obtained indicators, graphic displays, histograms and spreadsheets were used.
Qualitative and quantitative statistic procedures were used in data processing. With the help of descriptive statistics, the distribution of frequencies in certain findings was determined, the measures of the central tendency and dispersion measures were calculated. From comparative statistics, causal statistical procedures were used. In the field of non-parametric procedures, the Chi-Square Test and the Kruskal-Wallis Test were used, while from parametric procedures - factor analysis and correlation matrix.
5.1.
B
ASIC DEMOGRAPHIC INDICATORS OF THE RESPONDENTSFrom the total number of companies in this survey, almost half of them are multinational (47%), followed by global companies (28%) and national companies (25%).
Figure 5.1. – 1 Geographical area in which the organization operates
The total number of respondents in the survey is 98 (figure 5.1.-2). From which, 12% of respondents are top (general) managers, 26% are part of the middle management, while the remaining 62% are employees.
23 In this survey (figure no. 5.1.-3), the largest amount of organizations are with a number of employees between twenty one and fifty (33%) and organizations with up to twenty employees (31%). Seventeen percent of organizations have from 51 to 100 employees, eleven percent has a number of employees between 501 and 1000 and the fewest number of organizations are those with a number of employees between 101 and 500 employees (8%). Although in the
questionnaire there is a category for companies with over a thousand employees, there were no survey responses from such organization.
In the further procedure, in order to enable a more detailed data processing, an additional classification of the organizations was made (figure 5.1.-3a), according to the number of employees, classifying the organizations as: micro organizations; small; medium and large organizations (micro - under 20 employees, small – under 50 employees; medium and large - over 50 employees).
Figure 5.1.-3 Number of employees in the organization
24 According to the obtained results (figure 5.1.-4), the largest number of organizations have between eleven and twenty years of existence (39%). Followed by organizations with six to ten years of existence (21%), twenty-one to thirty years of existence (19%), and over forty-one years of experience (11%).
In the further procedure, and in order to enable more detailed data processing, again, an additional classification of the organizations had been made (Figure 5.1.-4a), according to the years of existence. The organizations have been classified into: up to ten years; eleven to twenty years and over twenty-one years of existence.
Figure 5.1.-4 Organizations by years of existence
25
5.2.
R
ESULTS ABOUTS
TRATEGIES,
A
PPROACHES ANDP
ROCESSESThe number of answers given by the respondents varies, taking into consideration the possibility to give more answers to one question, as well as the incomplete speech on all questions.
5.2.1. Information on strategies, approaches and processes related to the
collection and creation of knowledge from attributive indicators
According to the obtained results from the performed analysis in which the chi-square test for determining the quality of eligibility between the observed and the expected frequencies was noted that there are significant differences in all seven indicators.
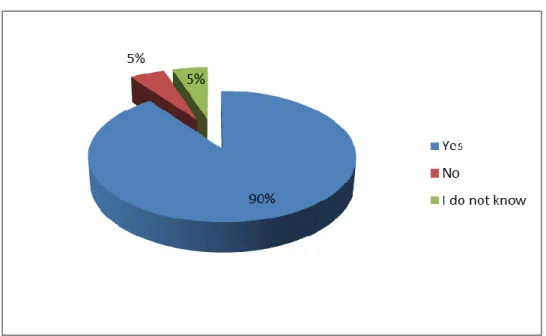
Question: 1. If your organization does not use the term "Knowledge Management", do you have any other definitions or names for knowledge-related initiatives?
Possible answers: a) Yes b) No c) I do not know
From the analyzed results (Graphic Display No. 5.2.1.-1 and Table 5.2.1.-1) it can be noted that the largest number of respondents gave a confirmed answer regarding the use of the term knowledge management.
With a chi-square test for determining the distribution of the attribute statements of the examinees, it was concluded that there are statistically significant differences between the expected and the empirical (observed) frequencies of the statements (χ2 = 140,592; df = 2; n = 98; = 0.000).
26 Table no. 5.2.1.-1
Application and use of the term "knowledge management"
VAR00002 Observed N Expected N Residual VAR00002 Intellectual capital 56 44,5 11,5 Chi-Square 5,944b Learning Organization 33 44,5 -11,5 df 1 Total 89 Asymp. Sig. ,015
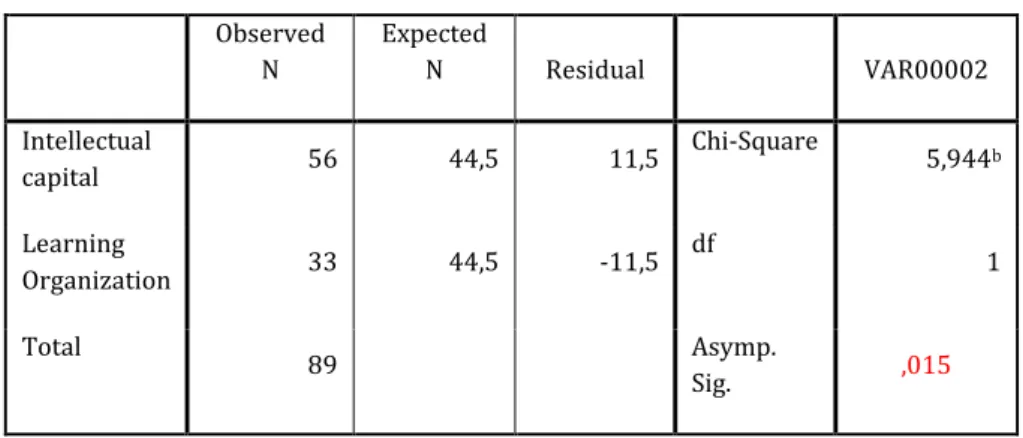
Question 2: If you answered the previous question with Yes, then which of the following terms do you use in Relation to the initiatives related to knowledge?
Possible answers: a) Intellectual capital b) Patent management c) Learning organization The analyzed results (Graphic Display No. 5.2.1.-2 and Table 5.2.1.-2) indicate that the most commonly used term related to knowledge is intellectual capital, many respondents connect it to the term learning organization while no respondents answered with patent management.
From the chi-square test for determining the distribution of the attribute statements of the examinees, it was concluded that there are statistically significant differences between the expected and the empirical (observed) frequency of statements (χ2 = 5.944; df = 1; n = 89; = 0.015).
27 Table no. 5.2.1.-2 Terms used in Relation to the initiatives related to knowledge
VAR00002 Observed N Expected N Residual VAR00002 Intellectual Capital 56 44,5 11,5 Chi-Square 5,944b Learning Organization 33 44,5 -11,5 df 1 Total 89 Asymp. Sig. ,015
Question 3: Most often, where can you say that the knowledge of your organization resides? Possible answers: a) In the memory of the people; b) On paper documents; c) In
the memory of computers; d) It's built-in in products and services; e) Other
From the analyzed results (Graphic Display No. 5.2.1.-3 and Table 5.2.1.-3), it can be noted that the opinion of the respondents about where the knowledge is in the organization is that it is mostly in the memory of computers.
According to the chi-square test for determining the distribution of the attribute statements of the respondents, it was concluded that there are statistically significant differences between the expected and the empirical (observed) frequency of statements (χ2 = 28,122; df = 3; n = 98; = 0.000).
Graphic display no. 5.2.1-3 Where does knowledge reside in the organization
28 Table no. 5.2.1-3 Where does knowledge reside in the organization
VAR00003
Observed N Expected N Residual VAR00003 In the memory of
the people 26 24,5 1,5 Chi-Square 28,122c On paper documents 10 24,5 -14,5 In the memory of computers 45 24,5 20,5 df 3 Built-in in products & services 17 24,5 -7,5 Total 98 Asymp. Sig. ,000
Question 4: Does your organization have an online platform for employees? Possible answers: a) Yes b) No
According to the analysis (Graphic Display No. 5.2.1-4 and Table 5.2.1.-4), it can be noticed that a very high percentage of organizations have their own online platform.
By applying a chi-square test to determine the distribution of attribute statements of the respondents, it was found that there are statistically significant differences between the
expected and the empirical (observed) frequency of statements (χ2 = 86,367; df = 1; n = 98; Sig. = 0.000).
29 Table no. 5.2.1.-4 Online platform
VAR00004
Observed N Expected N Residual VAR00004 Yes 95 49,0 46,0 Chi-Square 86,367d No 3 49,0 -46,0 df 1 Total 98 Asymp. Sig. ,000
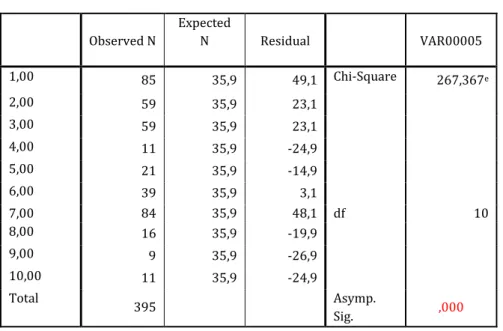
Question 5: If your organization has an online platform, what information does it have on it? (You can select multiple answers)
Possible answers: a) Information on products and technology b) Information on organizational structure c) Market analysis reports d) Academic and scientific research e) History of the firm f) Archive of good practices g) Procedures, rules and standards of the organization h) Innovative ideas of employees j) Online training k) News
According to the results (Graphic Display No. 5.2.1-5 and Table 5.2.1.-5), it can be noted that the largest number responded that the platform has information on products and technology as well as procedures, rules and standards in the organization.
With a chi-square test for determining the distribution of attribute statements of the examinees, it was found that there are statistically significant differences between the expected and the empirical (observed) frequency of the statements (χ2 = 267,367; df = 10; n = 395; = 0.000).
30 Table no. 5.2.1.-5 Information on the platform
VAR00005 Observed N Expected N Residual VAR00005 1,00 85 35,9 49,1 Chi-Square 267,367e 2,00 59 35,9 23,1 3,00 59 35,9 23,1 4,00 11 35,9 -24,9 5,00 21 35,9 -14,9 6,00 39 35,9 3,1 7,00 84 35,9 48,1 df 10 8,00 16 35,9 -19,9 9,00 9 35,9 -26,9 10,00 11 35,9 -24,9 Total 395 Asymp. Sig. ,000
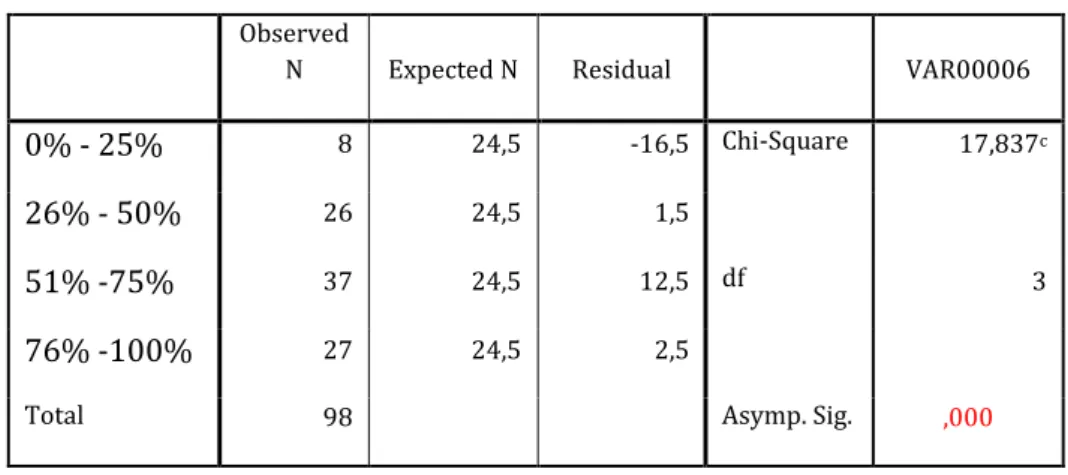
Question 6: What percentage of employees have access to the organizational online platform? Possible answers: a) 0% - 25% b) 26% - 50% c) 51% -75% d) 76% -100%
There is a division in the attitude of the respondents regarding the access to the organizational platform (Graphic Display No. 5.2.1-6 and Table 5.2.1.-6).
According to the chi-square test for determining the distribution of the attribute statements of the respondents, it was found that there are statistically significant differences between the expected and the empirical (observation) frequencies of the statements (χ2 = 17,837; df = 3; n = 98; = 0.000).
31 Table no. 5.2.1.-6 Access to online platform
VAR00006
Observed
N Expected N Residual VAR00006
0% - 25% 8 24,5 -16,5 Chi-Square 17,837c
26% - 50% 26 24,5 1,5
51% -75% 37 24,5 12,5 df 3
76% -100% 27 24,5 2,5
Total 98 Asymp. Sig. ,000
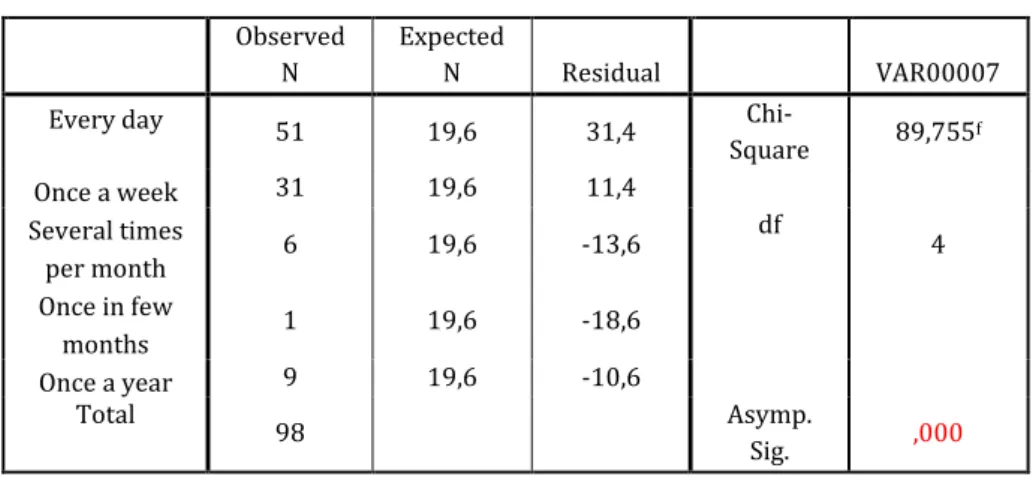
Question 7: How often do you personally use the organizational online platform?
Possible people: a) Every day b) Once a week c) Several times per month d) Once in few months e) Once a year f) Never
According to the results of the analysis (Graphic Display No. 5.2.1-7 and Table 5.2.1.-7), it can be noticed that the online platform is visited daily by more than half of the respondents.
By applying a chi-square test to determine the distribution of attribute statements of the examinees, it was found that there are statistically significant differences between the expected and the empirical (observed) frequency of statements (χ2 = 89,755; df = 4; n = 98; Sig. = 0.000).
32 Table no. 5.2.1.-7 Online platform usage
VAR00007 Observed N Expected N Residual VAR00007 Every day 51 19,6 31,4
Chi-Square 89,755f Once a week 31 19,6 11,4 Several times per month 6 19,6 -13,6 df 4 Once in few months 1 19,6 -18,6 Once a year 9 19,6 -10,6 Total 98 Asymp. Sig. ,000
5.2.2. Information about effective knowledge management and innovation
from attributive indicators
According to the obtained results from the performed analysis in which the chi-square test shows the quality of eligibility between the observed and the expected frequencies, it is noted that there are significant differences in all sixteen indicators.
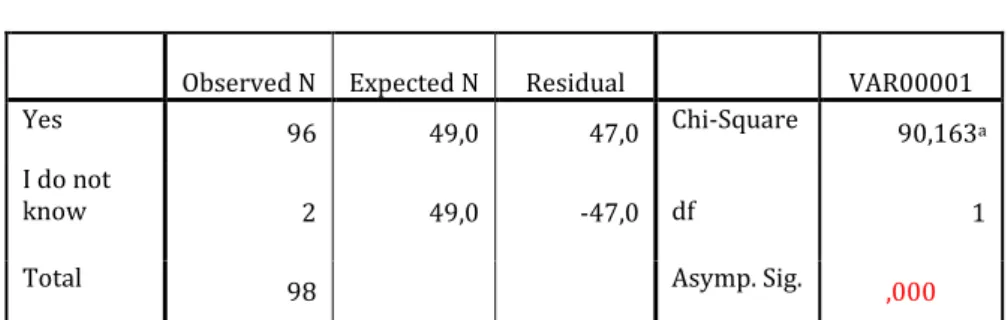
Question 1: Do you think that your organization needs innovation in terms of the products or services it offers?
Possible answers: a) Yes b) No c) I do not know
From the analyzed results in the survey (Graphic Display No. 5.2.2.-1 and Table 5.2.2.-1), it can be noted that a very high percentage of respondents point to the need for innovation in terms of products and services.
With a chi-square test for determining the distribution of attribute statements of the respondents, it was founded that there are statistically significant differences between the expected and the empirical (observed) frequency of statements (χ2 = 90,163; df = 1; n = 98; = 0.000).
33 Table no. 5.2.2.-1 Need for innovation in products or services
VAR00001
Observed N Expected N Residual VAR00001 Yes 96 49,0 47,0 Chi-Square 90,163a I do not
know 2 49,0 -47,0 df 1 Total 98 Asymp. Sig. ,000
Question 2: Do you think that your organization needs innovation in organizational structures and functioning?
Possible answers: a) Yes b) No c) I'm not informed
From the analyzed results in the survey (Graphic Display No. 5.2.2.-2 and Table 5.2.2.-2), it can be noted that a very high percentage of respondents point to the need for innovation related to organizational structures and functioning.
By applying a chi-square test for determining the distribution of attribute statements of the examinees, it was concluded that there are statistically significant differences between the expected and the empirical (observed) frequency of statements (χ2 = 167,286; df = 2; n = 98; Sig. = 0.000).
Graphic display no. 5.2.2.-2 Need for innovation in organizational structure and functioning
Table no. 5.2.2.-2 Need for innovation in organizational structure and functioning
VAR00002
Observed N Expected N Residual VAR00002 Yes
93 32,7 60,3 Chi-Square 167,286b No 1 32,7 -31,7 df 2 Not
informed 4 32,7 -28,7 Total 98 Asymp. Sig. ,000
34 Question 3: Which of the following opportunities do you consider that innovation in an
organization can offer? (You can select multiple answers)
Possible answers: a) Better working atmosphere; b) Increased employee focus on company development; c ) Improved operations due to technology; d) New customers; e) More satisfied existing customers; f) Improved brand image of the business; g) Greater competitiveness on the market; i) Increased profits; j) Shared knowledge
According to the analyzed results (Graphic Display No. 5.2.2.-3 and Table 5.2.2.-3), it can be noted that the largest number of respondents favor the technology that facilitates work, as well as the focus on employees for company development; increased profits and greater
competitiveness.
From the results of the applied quadrature test for determining the distribution of attributive statements of the examinees, it was concluded that there are statistically significant differences between the expected and the empirical (observed) frequency of statements (χ2 = 82,143; df = 8; n = 461 ; Sig. = 0.000).
Graphic display no. 5.2.2.-3 Opportunities from innovation
Table no. 5.2.2.-3 Opportunities from innovation VAR00003
Observed N Expected N Residual VAR00003 1,00 57 51,2 5,8 Chi-Square 82,143c 2,00 71 51,2 19,8 3,00 78 51,2 26,8 4,00 54 51,2 2,8 5,00 38 51,2 -13,2 df 8 6,00 25 51,2 -26,2 7,00 59 51,2 7,8 8,00 70 51,2 18,8 9,00 9 51,2 -42,2
35 Question 4: Which of the following do you think is the main reason for lack of innovation?
Possible answers: a) Lack of finances b) Lack of knowledge c) Lack of ideas d) Other
Research analysis (Graph 5.2.2.-4 and Table 5.2.2.-4) indicates that over half of respondents see the lack of finances as a main reason, but a good percentage indicates that lack of ideas is a good reason as well.
With a chi-square test for determining the distribution of attribute statements of the examinees, it was found that there are statistically significant differences between the expected and the empirical (observed) frequency of statements (χ2 = 55.061; df = 3; n = 98; = 0.000).
Graphic display no. 5.2.2.-4 Reasons for lack of innovation
Table no. 5.2.2.-4 Reasons for lack of innovation VAR00004
Observed N Expected N Residual VAR00004 Lack of finances 53 24,5 28,5 Chi-Square 55,061d Lack of knowledge 11 24,5 -13,5 Lack of ideas 28 24,5 3,5 df 3 Other 6 24,5 -18,5 Total 98 Asymp. Sig. ,000
36 Question 5: The innovative ideas in your company come from? (multiple answers are possible) Possible answers: a) Market research b) Group generating new ideas c) Previous knowledge storing d) Knowledge gained from educational programs e) Employee surveys f) Archived ideas g) Continuous learning of employees h) Other
According to the obtained statements from the respondents (Graphic Display No. 5.2.2.-5 and Table 5.2.2-5), most of the respondents were noted, but innovative ideas are most often derived from market research, group generating ideas, such as and continuous learning of employees. From the obtained results of the applied chi-square test for determining the distribution of attributive statements of the examinees, it was concluded that there are statistically significant (significant) differences between the expected and the empirical (observed) frequency of statements (χ2 = 116,210; df = 5; n = 286; Sig. = 0.000).
Graphic display no. 5.2.2.-5 Innovative ideas
Table no. 5.2.2.-5 Innovative ideas
VAR00005
Observed N Expected N Residual VAR00005 1,00 92 47,7 44,3 Chi-Square 116,210e 2,00 67 47,7 19,3 3,00 48 47,7 ,3 4,00 13 47,7 -34,7 6,00 5 47,7 -42,7 df 5 7,00 61 47,7 13,3
37 Question 6: Are there employees working on innovative projects in your organization?
Possible answers: a) Yes b) No c) I'm not informed
According to the obtained results of the survey (Graphic Display No. 5.2.2.-6 and Table 5.2.2.- 6) it can be noted that the largest number of respondents or over 60% reported that there are employees working on innovative projects , while the rest have no information.
With a chi-square test for determining the distribution of attribute statements of the examinees, it was concluded that there are statistically significant (significant) differences between the expected and the empirical (observed) frequency of statements (χ2 = 4,939; df = 1; n = 98; = 0.000).
Graphic display no. 5.2.2.-6 Work on innovative ideas
Table no. 5.2.2.-6 Work on innovative ideas VAR00006 Observed N Expected N Residual VAR00006 1,00 60 49,0 11,0 Chi-Square 4,939a 3,00 38 49,0 -11,0 df 1 Total 98 Asymp. Sig. ,026
38 Question 7: Is there an innovation team?
Possible answers: a) Yes b) No c) Only when needed d) I'm not informed
From the analysis of the obtained results in the survey (Graphic Display No. 5.2.2.-7 and Table 5.2.2.- 7), it can be noticed that the largest number of respondents reported that there is an innovation threshold, about a third do not have information, an interesting statement is that it is formed depending on the needs of the organization. The number of organizations that do not have innovation teams is insignificant.
By applying a quad-square test to determine the distribution of attribute statements of the respondents, it was found that there are statistically significant (significant) differences between the expected and the empirical (observed) frequency of statements (χ2 = 28,612; df = 3; n = 98; Sig. = 0.000).
Graphic display no. 5.2.2.-7 A team for innovation
Table no. 5.2.2.-7 A team for innovation
VAR00007 Observed N Expected N Residual VAR00007 Yes 35 24,5 10,5 Chi-Square 28,612d No 2 24,5 -22,5 Only when needed 28 24,5 3,5 df 3 Not informed 33 24,5 8,5 Total 98 Asymp. Sig. ,000