Changes in Cash Holdings: transition between AIM and MM in UK
Tiago João Castelo de Morais PimentelDissertation Master in Finance
Supervisor:
Nuno Domingues Mateus Pedroso Soares, PhD
i
Acknowledgements
Closing this cycle was only possible thanks to the support provided by some people. I would like to express my profound gratitude and appreciation to my supervisor Professor Nuno Soares. His patience and good advice were crucial for being able to produce and deliver this dissertation.
I would like to thank Carla Costa for supporting me throughout these years and for always encouraging me to push myself to the limit.
Another person that deserves a special thank you note is my brother. For being there when I need and for being a good listener when the time comes.
Lastly, I would like to thank my parents who taught me that quitting is the option of last resort and for supporting and providing the best conditions for my growth and development, both personally and academically.
ii
Abstract
In this study we explore the effect on cash holdings on firms transition between the Alternative Investment Market (AIM) and the Main Market (MM) on the London Stock Exchange. The study uses data from 2000 to 2014, collected for the two markets. The mean industry adjusted cash holdings after the move reports a 18.47% decrease for moves from the MM to the AIM, while a 62.10% decrease for the moves from the AIM to the MM. Overall, findings suggest there is a decrease in cash holdings when firms transition from the Main to the AIM market, but not from the AIM to the Main.
The study also explores the impact that bankruptcy proximity has on companies’ cash holdings. Firms that are closer to bankruptcy drive the results for the MM to AIM transition.
Keywords: Cash holdings; Alternative Investment Market; Main Market.
iii
Resumo
Este estudo explora o impacto na liquidez das empresas que mudam entre o Alternative Investment Market (AIM) e o Main Market (MM) da Bolsa de Valores de Londres. Os dados recolhidos para os dois mercados dizem respeito aos períodos 2000 até 2014. A média ajustada para a indústria da posse de liquidez após a mudança de mercado reporta uma queda de 18,47% para as mudanças do MM para o AIM e simultaneamente uma redução de 62,10% para as mudanças do AIM para o MM. Os resultados demonstram uma redução de liquidez quando as empresas mudam do MM para o AIM, mas não no caso inverso.
O estudo também avalia a influência que a proximidade da falência tem sobre a posse de liquidez das empresas analisadas. Os resultados demonstram que são as empresas mais próximas da falência que originam, os resultados da transição do MM para o AIM.
Palavras-chave: Liquidez; Alternative Investment Market; Main Market.
iv
Table of Contents
Introduction ... 1
1. Cash holdings ... 3
1.1. Motives for holding cash ... 3
1.1.1. Precautionary Motive ... 3
1.1.2. Transaction Motive ... 4
1.1.3. Speculative Motive ... 4
1.1.4. Corporate Governance ... 5
2. AIM vs. MM ... 7
2.1. Successful moves from AIM to MM ... 9
3. Hypothesis ... 11
4. Sample, methodology and summary statistics ... 12
4.1. Data and sample ... 12
4.2. Model ... 13 4.3. Variables ... 14 4.3.1. Dependent variable ... 14 4.3.2. Independent variables ... 14 4.3.3. Observations ... 17 4.4. Descriptive Statistics ... 17 5. Results ... 21 5.1. MM to AIM ... 21
v
5.1.1. Market change impact in companies cash holdings ... 21
5.1.2. Regressions Analysis ... 22
5.2. AIM to MM ... 26
5.2.1. Market change impact in companies cash holdings ... 26
5.2.2. Regressions Analysis ... 27
5.3. Z-score ... 30
6. Conclusion ... 32
References ... 34
vi
List of Tables
Table 1. Sample numbers (firms and observations) ... 13
Table 2. Descriptive Statistics ... 19
Table 3. Correlation Matrix ... 20
Table 4. MM to AIM [-1,+1] ... 21
Table 5. MM to AIM [-2,+2] ... 21
Table 6. Regression results MM to AIM [-1,+1] ... 24
Table 7. Regression results MM to AIM [-2,+2] ... 25
Table 8. AIM to MM [-1,+1] ... 26
Table 9. AIM to MM [-2,+2] ... 26
Table 10. Regression results AIM to MM [-1,+1] ... 28
Table 11. Regression results AIM to MM [-2,+2] ... 29
1
Introduction
Moving between the Alternative Investment Market (AIM) of the London Stock Exchange and the Main Market (MM) is a process that might have an impact on the firm’s behaviour and performance. As suggested by Brisker et al. (2013) it is important to note that firm index addition should not be considered an information-free event. Accessibility to credit can be one of the major drivers for boosting firm performance and expansion, where credibility and transparency, among other variables, will play a fundamental role in obtaining these investment instruments. For this reason, it is expected that a change in the market of listing has an impact on the cash holding policy followed by firms. To the best of our knowledge, there are no studies regarding the transition of the AIM to the MM (and vice versa) for the UK and its relationship with cash holdings policies.
The aim of this dissertation is to study the impact of the transition between the AIM and the MM on the company’s cash holdings policies using data from 2000 up to 2014. Opler et al. (1999) defines that firms with strong growth opportunities, riskier cash flows and smaller size hold more cash than firms with a greater access to the capital market and similarly with a larger size. Therefore, it is interesting to analyse what happens in the transition process and how cash holding policies alter along the way. To capture this transition effect, it will be necessary to account for several variables affecting the sample. These will range from the specific characteristics of the markets in which the companies trade in, such as, the regulatory flexibility of the AIM of the London Stock Exchange compared with the MM and firm specific characteristics regarding the decision-making process, specifically, corporate governance changes and its impact.
The study will be divided into sections. Section 1 will explore the meaning of some important terms related to the topic focusing on the understanding of cash holdings together with its importance and possible impact in the firm global decision making. Additionally, a description of the two markets is provided in section 2. This section will also provide a comparison regarding the requirements needed to enter each market. This intends to show the different regulatory systems the AIM and the MM run. It is expected to allow a better understanding of the company’s decisions. Since, the AIM is a recent market, a framework of its history will be provided to raise awareness to the increasing importance it has developed. Section 2 also provides some examples of successful changes that have occurred
2
in the past. Additionally, this section will explore the motives behind a company’s decision to move from the MM to the AIM which are expected to be related with the properties of the markets. Section 3 outlines the hypothesis explored in this study. Section 4 provides a brief description of the methodological approach used together with information on the data used to conduct the study. In this section a detailed description of the dependent and independent variables used to produce the results is also provided. Section 5 presents the results and their respective discussion. Finally, section 6 concludes the dissertation and displays further ideas for research.
3
1. Cash holdings
Cash held by a firm is dependent on the relationship between the marginal benefit and marginal cost associated with the operation (Opler et al., 1999), which comes directly from the static trade-off model. Therefore, defining the amount of liquidity the company will count with is always influenced by this relation. The marginal cost and benefit regarding holding cash are consequently the main areas influencing liquidity in the balance sheet of firms. As highlighted by Opler et al. (1999) firms with strong growth opportunities, riskier cash flows and smaller size hold more cash when compared with firms who have greater access to the capital market and a larger dimension. On the one hand, we can relate these conclusions to the costs and benefits assuming large firms, with a facilitated access to the capital markets, have a minor benefit and a significant cost to hold cash and therefore decide not to. On the other hand, companies in the opposite scenario, smaller size, restrict access to the capital markets, among other characteristics will have a higher benefit and presumably a lower cost, proportion wise. Under these two main areas (benefits and costs) there are a range of other reasons that can always be reduced to a cost and benefit analysis. The following are all reasons and motives that drive firms to hold cash and will be thoroughly described in the section below.
1.1. Motives for holding cash
In his book, “The General Theory of Employment, Interest and Money”, John Maynard Keynes (1936) identified three major motives that influence companies to hold cash: precautionary, transaction and speculative motive. Since then they have been identified as the most predominant and general motives for holding cash. However, these are not the only motives that drive and condition firms cash holding levels. Other factors influencing companies cash holding policies (analysed in sections below) are corporate governance and the regulation of the market in which the company operates in. For this case the regulatory systems analysed are the AIM and the MM of the London Stock Exchange.
1.1.1. Precautionary Motive
As the name suggests the first outlined reason for managers to hold cash is as a means of protection. In other words, their incentive to hold cash is to settle for future contingencies. These might include the most diverse types, ranging from taxes to unexpected conditions
4
such as, natural disasters (this last case reports to one of the most extreme and less probable situations). This means that firms will need “liquid assets to finance its investments and acquisitions in cases when other sources of funding are unavailable or very costly” (Brisker et al., 2013).
As a substitute of cash, firms use external funds. There are some problems with this type of financing, such as, information asymmetry and agency conflicts. The first is thoroughly described in Myers & Majful (1984) where it is even suggested that to increase liquidity, firms could issue stock in periods where managers have no information advantage. These information asymmetry problems arise from agency conflicts (Jensen, 1986) which will directly influence the amount of cash held by the company (Dittmar et al., 2003). Therefore, following the idea expressed in the previous study, managers see cash as the best alternative to cover possible investments when external financing is too costly (Nason and Patel, 2016).
1.1.2. Transaction Motive
The term “transaction motive” was first suggested by Keynes (1936) as one of the main causes for holding cash. Firms need cash to finance their daily operations and therefore it is essential (in varying proportions) that firms have the adequate amount of liquidity. As it was already mentioned above, the main advantage of holding cash is the ability to avoid the transaction costs associated with external financing (Brisker et al., 2013). The transaction costs previously mentioned, are directly related with the inefficient conversion of assets which are less liquid than cash to comply with the firms’ operational activities.
1.1.3. Speculative Motive
Firms can also hold cash to account for the possibility of future gains. This allows a direct relationship with Opler et al. (1999) where it is stated that companies with higher growth opportunities are the ones that hold more cash. These firms are therefore looking forward and always ready for a new incursion on the market, either through acquisitions or other investments. Cash accessibility allows them to operate fast and catch the best opportunities available in the market.
5
The main problem for these growth firms is related to the cost of holding the assets, when there is no investment to cancel out the costs. These can be related to the lower rate of return of the assets and some tax disadvantages (Brisker et al., 2013).
1.1.4. Corporate Governance
Amongst the motives that explain the levels of cash held by firms is corporate governance structure. A wide variety of authors have studied the impact of corporate governance structure in cash holding policies, all from different perspectives. Harford et al. (2008) and Kalcheva & Lins (2007) identified a negative relation between corporate governance and cash holdings. In Harford et al. (2008), by analysing companies with strong and others with weak governance it was possible to depict that the firms in the second tier (weak governance) held less cash due to high levels of capital expenditure and frequent acquisitions. The ones in the first tier opt for an increase dividend policy committing the company to higher payouts in the future. The study was conducted for the US market. Kalcheva & Lins (2007) conducted a study compiling empirical evidence from a total of 31 countries and found that firm values are lower when controlling managers hold more cash and external country-level shareholder protection is weak. Following the shareholder protection approach there is also Dittmar et al. (2003) highlighting that when low levels of shareholder protection are verified, investment opportunities and asymmetric information become secondary when it comes to settling the firm’s cash holding policies. In this study, it was also shown that in countries (their sample included 45 countries) with lower shareholder protection, companies held higher levels of cash.
Moreover, an issue thoroughly described in the literature and with many applications to the corporate governance structure approaches is management entrenchment. Managers have an incentive to invest the firm’s resources in assets whose value is higher under them than under any other manager (Shleifer & Vishny, 1989). This practice (entrenchment) is vastly affected by high levels of cash holdings (Harford et al., 2008; Kalcheva & Lins, 2007) which contribute, in lower shareholder protection environments, to non-market value maximisation investments, in most cases. It was then concluded that in cases where shareholders have more rights and control over companies tended to store less cash than otherwise (Harford et al., 2008).
6
Agency problems are another factor affecting firms cash holding policies. It is known that agency conflicts tend to have a higher impact on firms with a high free cash flow (Jensen, 1986). This happens together with the already mentioned impact of poor investor protection policies on cash holdings (Pinkowitz et al., 2006; Kalcheva & Lins, 2007; Harford et al., 2008).
7
2. AIM vs. MM
The Alternative Investment Market (AIM) of the London Stock Exchange (LSE) was created in 1995 with the purpose of serving growing companies in the UK that could not afford the access to capital through the Main Market (MM). It started, according to the LSE AIM Factsheet, with 10 British companies and currently counts with 995 firms, where 815 have their headquarters in the United Kingdom and the remaining 180 being international firms. Accompanying this growth was the overall market value, which increased from £82.2 million (June 1995) to £80,883.4 million (October 2016)1 in 21 years of existence. This market value rise is an indicator of the increasing importance this market has been acquiring and therefore makes it appealing to study. As a consequence of its success and popularity the AIM format has been adopted by other countries, such as, Japan with “Tokyo AIM” being launched in April 2009 and Italy with “AIMItalia” being launched in December 2008 (Gerakos, 2013).
The London Stock Exchange MM is one of the “world’s most international market for the admission and trading of equity, debt and other securities”2. This is one of the oldest markets in the world as it was founded in 1801. Data collected on the 30th December 2016 reveals that the MM comprises a total of 2,267 companies with an overall market value of £4,582,465 million.
As it is mentioned by the London Stock Exchange, AIM’s success has “underpinned by its regulatory framework” 3. This means that the regulation applied to the companies included in the AIM is one of the features, determinant for the market’s success. Belonging to the AIM can therefore be expected to be a simpler task when it comes to restrictions and barriers of entry.
The first identifiable barrier has to do with the fee’s companies pay to be admitted in such markets. These fees are dependent on the firms required market capitalisation and, as it is conveyed below, these fees are substantially higher for companies willing to join the MM
1 Source: LSE AIM Factsheet
2 Source: London Stock Exchange 3 London Stock Exchange: Guide to AIM
8
than for those willing to join AIM. Companies applying to the MM will according to the London Stock Exchange Fees for Issuers file (1st April 2016) have to pay a maximum of £475,000 (plus VAT) as admission fee for new issues, whilst further issues will be charged an amount to the new issues with the exception of a 25 per cent discount for issuers with a market capitalisation at the time of issue of £500m and below4 (see table A.1. in the annexes). Companies willing to enter AIM will pay a maximum admission fee of £92,000 (dependent on the firm’s market capitalisation), whereas companies reporting a less than £5 million market capitalisation are not submitted to any other further issues (see table A.2. in the annexes). Firms above the £5 million market capitalisation level requiring further issues will be subject to a maximum fee of £46,250 also dependent on the market capitalisation. Additionally, since 1st April 2016 all AIM companies must pay an annual fee of £6,5005. This means that the most expensive company joining AIM (>£250 million market capitalisation) is charged £92,000 (plus VAT) in admission fees plus the £6,500 annual fee, which is subject to a pro-rata update depending on the date of admission.
Another distinct restriction when joining the two markets has to do with the trading history companies must withhold. For firms joining the MM it is required that they already have a 3-year trading period, while for the AIM no restriction applies in this point. This is an important feature as it makes a clear division regarding the purpose of each market. By not requiring any previous trading period we can depict the openness of the AIM towards small and mid-sized companies.
Regulation is, as already stated, the great difference between the AIM and MM. The MM is an EU Regulated Market where companies need to produce and deliver a full Prospectus to be approved by the UK Listing Authority (UKLA)6. Companies joining the AIM are regulated by Nominated Advisers (Nomads)7, which are regulated by a specific team within the LSE. This team is formed by lawyers, accountants and corporate financiers that
4 London Stock Exchange: Fees for Issuers
5 London Stock Exchange: Fees for companies and nominated advisers 6 LSE: Rules and Regulations
7 Firms who have practiced corporate finance for a minimum of two years prior to application, responsible for guiding AIM companies through the admission process (all the due diligence and admission documents preparation) and its subsequent life as a public company (regulating the company through AIM rules). These are usually investment banks or corporate financing firms.
9
among other tasks, develop the AIM rules, monitor indexed companies’ compliance with regulations and approve and monitor the Nomads. The AIM therefore provides a customized regulation administered through the private sector (Gerakos, 2013).
And interesting difference between the two markets, stated in Vismara, Paleari, and Ritter (2012) and Farinha et al. (2018) is the fact that firms incorporating the AIM are characterised by higher bid-ask spreads, and lower share turnover when compared with Main Market firms.
2.1. Successful moves from AIM to MM
The following study looks at the impact of cash holdings when a company moves between the AIM and the MM. As such it is interesting to show that there are already some examples of companies that grew inside the AIM and then transitioned to the MM with success. This emphasizes the importance of studying the resemblance and differences between these two markets.
The first analysed example is Domino’s Pizza UK & IRL plc. This is one of the most mediatic examples of a successful transition to the MM. The pizza delivering company listed in the AIM in 1999 and by their MM listing press release had 501 stores in the UK and Ireland back in 2008. The last value comes from the 2015 Annual Report and states a total of 916 stores in the same territory. During their time in the AIM Domino’s Pizza registered a significant increase of their pre-tax profits, reportedly going from £1.8 million in 1999 to £18.7 million by the end of 2007. By this time the company registered a £308 million enterprise value, approximately8. It was a growing company that moved to the MM for a wide range of reasons, with Domino’s Chief Financial Officer of the time, Lee Ginsberg, in 2010 pointing that “US funds preferred us on the Official List to AIM, because there is a stronger perception of corporate governance”. This statement shows that one of the advantages of the AIM, mentioned in the previous section (lower regulation when compared
8 Amadeus Database
10
to MM), can work as a disadvantage as well. By the end of 2015 Domino’s Pizza enterprise value stood at roughly £2,325 million9.
Another successful case is Booker Group Plc. This is the largest wholesale company in the United Kingdom. The firm was founded in 1835 by George and Richard Booker. Later in 2000 it was purchased by the Big Food Group10. Then in 2004 the company joined the AIM, remaining for almost 5 years after leaving the index in 2009 for the MM being incorporated in the FTSE250 with an enterprise value of approximately £459 million11. By the end of 2015 Booker Group Plc. presented a £2,288 million12, approximate enterprise value showing the value increase it had gone through the latter years.
9 Amadeus Database
10 Booker Plc was bought by Iceland Supermarkets which belonged to the Big Food Group. In 2005 Booker Plc was separated from Iceland Supermarkets by the Big Food Group.
11 Amadeus Database 12 Amadeus Database
11
3. Hypothesis
Following the previous literature review (sections 1 and 2) and discussion we now turn our attention to the definition of the hypothesis explored in this study.
Looking at the wide diversity of motives companies have to hold cash it is understandable that a change in company cash holdings will not be due to one single factor. The definite reason behind the market movement is complex to capture as it ranges from corporate governance policies to strategic and management-based decisions. Together with the motives, we have to account for, the existing differences between the AIM and the MM as possible causes for changes in firm’s cash holding policies. Additionally, the financial moment of each firm can be a determinant in the interpretation of the decision to move. Financial distress is expected to work as a conditional characteristic influencing management decision-making on the future listing market, which is expected to affect the cash holding policies adopted from that moment onward.
Companies that move from the MM to the AIM are expected to face less access to capital, therefore it is expected their level of cash holdings to increase following the market change. Companies moving from AIM to Main are expected to decrease their level of cash holdings. This is because they will be moving to a market where they will have better access to capital, which will then reduce the company’s necessity to hold cash. Hence, the two hypotheses are as follows:
H1: Companies moving from Main to AIM will tend to increase their cash holdings as they will enter a market with less liquidity and less growth opportunities.
H2: Companies moving from AIM to Main will tend to decrease their cash holdings as they will enter a market with more liquidity and more growth opportunities.
12
4. Sample, methodology and summary statistics
4.1. Data and sample
This study used financial information collected from the companies comprising the AIM and the MM. Financial data was collected from Worldscope and Datastream database and accounts for the period 2000 to 2014. Data comprising the changes between markets was manually retrieved. The process meant that yearly information of the AIM and Main market was individually collected from the London Stock Exchange13 for the sample period. To obtain the changes between each market we matched the companies in both datasets using their SEDOL codes, which were obtained manually by matching the firm name with its SEDOL. Then in order to verify our dataset we used the match between the company ID’s (denoted by their DSCD code) and matched them with the SEDOL code for each company. Then by merging the financial information with the market change database we obtained the full sample for the study. This period was chosen since AIM is a relatively recent market and therefore the existing data for the initial years would comprise a low sample and some incomplete information which would not allow for a solid analysis.
The sample was then conditioned to eliminate companies with ICBIC 8000, as this corresponds to financial firms, which, due to their operations would not produce reliable results regarding their management of cash holdings. The control variables used in the test were then winsorized at 1% in order to eliminate the outliers. To produce the regression results we used the two-way clustering following the positive results obtained by this method described in the available literature (Petersen, 2008; Gow, Ormazabal, and Taylor, 2010; Thompson, 2011).
The main source used in this study for measuring the impact of the cash holdings changes between markets was the Brisker et al. (2013) approach. One major difference considering both studies is the composition of sample. Brisker et al. (2013) studied the impact, S&P 500 indexation had in cash holdings from 1971 to 2006. Due to the constraints already pointed out above, this was conducted for a smaller period. Brisker et al. (2013) also
13
developed a [-5] to [+5] year analysis, with [-5] being the 5 years prior to inclusion and [+5] the 5 years after inclusion. This study considers two different approaches. It measures what happens to companies in a five-year period divided in two analysis, from [-2] to [+2] and from [-1] to [+1]14. Another difference is that companies were forced to be within this range. So, companies present in the sample have to be in the analysed periods. This means that the number of observations is the same within each period.
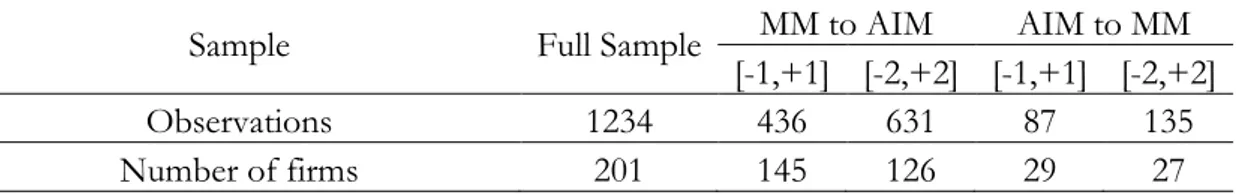
After proceeding with the data cleaning processes expressed above we ended up with a sample comprising 201 companies corresponding to 1234 observations. In the analysis we managed to gather 145 companies (436 observations) and 126 companies (631 observations) for the companies moving from the MM to AIM for periods [-1,+1] and [-2,+2], respectively. While, for companies moving from AIM to MM we accounted for 29 companies (87 observations) and 27 companies (135 observations) for the periods [-1,+1] and [-2,+2], respectively (see table 1).
Table 1. Sample numbers (firms and observations) Sample numbers (firms and observations)
Sample Full Sample MM to AIM AIM to MM
[-1,+1] [-2,+2] [-1,+1] [-2,+2]
Observations 1234 436 631 87 135
Number of firms 201 145 126 29 27
4.2. Model
This study aims at finding the impact a market transition has on companies’ cash holdings. To depict this impact, the following model was used:
𝐶𝑎𝑠ℎ𝑖,𝑡 = 𝛽0+ ∑ 𝛽𝑗× 𝑋𝑗,𝑖,𝑡 9
𝑗=1
+ 𝑓𝑖𝑟𝑚 𝑒𝑓𝑓𝑒𝑐𝑡𝑠 + 𝑦𝑒𝑎𝑟 𝑒𝑓𝑓𝑒𝑐𝑡𝑠 + 𝜇𝑖,𝑡 (1)
14 -1 corresponds to the year company changed market, 0 corresponds to the year immediately after market change (for both periods)
14
The dependent variable is Cash and the independent (explanatory) variables include measures that intend to control the impact a market change has on cash holdings, such as, Inventory amount, debt amount through Leverage, among others. A more detailed version of the variables is provided below. The descriptive statistics of these variables is provided in table 2, while in table 3 we provide the correlation matrix between the analysed variables together with the respective statistical significance.
4.3. Variables
4.3.1. Dependent variable
As our dependent variable, Cash Holdings are measured as cash and cash equivalents over assets (Ozkan and Ozkan, 2004). Later, this variable was conditioned to find its the industry adjusted features (Brisker et al., 2013).
4.3.2. Independent variables
This study focused on the independent variables widely suggested in the literature. The set of firm specific variables used were the following:
a. Acquisitions
Acquisitions was computed as the level of acquisitions (per fiscal year) scaled by assets, Brisker et al. (2013).This variable is expected to have a negative correlation with a company’s cash reserves. This will happen as companies moving from the AIM to MM will tend to have less cash reserves as they have access to easier capital and therefore with leverage increase their level of acquisitions. The inverse relation is expected to happen with companies moving from MM to AIM, as the access to external financing can be expensive (Jensen, 1986; Myers and Majluf, 1984).
b. After
The variable After is a dummy variable that equals 1 for the years after the move to the AIM/MM and 0 for the years prior to the market change.
15 c. Cash flow
This variable was determined by Net Income Before Preferred Dividends + Depreciation and Amortization, scaled by total assets. The following variable, considering the previous literature, provides a reliable measure of a company’s financial health, (Farinha et al., 2018). Also due to the pecking order theory (Myers & Majluf, 1984) when there is an increase in asymmetric information the cost of capital will increase. This is one of the differences between the AIM and the MM, where companies in the AIM are expected to have difficult access to capital making them rely on their internal resources.
d. Expenditures
This variable is computed as the total Capital Expenditures (CAPEX) over total assets. The inclusion of this variable has the purpose of showing the amount of long term investment a company can produce in the respective fiscal year. The impact of cash holdings can be seen in Expenditures as the dependent variable is expected to have a negative correlation with Expenditures (Denis and McKeon, 2017).
e. Inventory
This variable is composed by the level of Inventories over the total assets. Companies moving from the AIM to the MM may present lower levels of their inventories as they are expected to present a decrease in their investment opportunities (Brisker et al., 2013). This could drive inventories to also decrease. When looking at the move from the MM to the AIM a different result might arise.
f. Leverage
Leverage depicts the impact the debt structure of the company has on its cash holdings. This variable computed as the Short term debt + Long term debt, scaled by total assets. The literature shows that there is not a linear relationship between leverage and cash holdings (Guney, Ozkan & Ozkan, 2007), as different levels of leverage can report the same impact on cash holdings.
16 g. Market to Book
This variable is used as a valuation figure of the company’s growth opportunities as it represents the difference between the market value of equity and the book value equity. The valuation inherent to this ratio allows for a statement on the under or over valuation of the respective firms, therefore capturing the possibility of more or less growth opportunities. We expect firms with greater growth opportunities (Opler et al., 1999) to have larger reserves of cash. However, it also possible for firms with greater growth opportunities to register less cash reserves as they can have incentives to profit from the better access to good financing opportunities.
h. Net Equity Issue (NEI)
The Net Equity Issue depicts the difference between the Total Equity Issue and the Total Equity Purchased, scaled by total assets (Brisker et al., 2013). This variable captures the proportion of new issuances for each fiscal year. It is foreseen by the previous literature that companies with a high level of equity issuance will tend to be looking for financing opportunities (Denis and McKeon, 2017). Companies seeking for more growth opportunities may benefit from an incorporation in the MM, provided the better access to financing opportunities. It is therefore expected that companies with a higher positive difference in this variable would also be the ones with lower cash holdings, as they have easier access to different financing types (for companies moving from AIM to MM). Moreover, the inverse is expected for companies moving from the MM to AIM.
i. Net Working Capital (NWC)
Net Working Capital is interpreted as a measure of a company’s operational efficiency or as its short term financial health. It comprises the difference between the current assets and liabilities, and was computed by Total Receivables + Total Inventories – Accounts Payable, scaled by total assets, Brisker et al. (2013). Companies moving from AIM to MM are expected to have a marginal decrease of their investment opportunities which can lead them to a reduction of their NWC (Riddick and Whited, 2009). Movements from MM to AIM may present different results as their motives to move market are uncertain.
17 j. Research and Development (R&D)
This variable shows the total investment directed by the company towards R&D for each fiscal year with respect to total assets. The literature shows that companies with a higher cash holdings level will tend to allocate more expenditure towards their R&D (Opler et al., 1999). Companies with high growth opportunities tend to hold more cash to total non-cash assets (Opler et al., 1999).
k. Firm and year dummies
In order to control for time and industry effects dummies are included in the model, namely the Year Fixed Effect and the Firm Fixed Effect.
4.3.3. Observations
In our analysis we also decided to include the variable Distributions which tested whether companies made any cash distributions during the measured years. To do this we introduced a dummy variable where 1 meant the firm had paid a dividend and 0 otherwise. Companies that pay dividends on a regular basis would face a negative reaction from financial markets when they decide to cut the dividend, which could lead them to hold more cash to fulfil this self-obligation (Farinha et al., 2018). However, firms in the sample were not paying dividends for the period being analysed, and hence this variable was excluded from the analysis.
4.4. Descriptive Statistics
Table 2. displays the summary statistics respecting to the full sample of all the variables used in the analysis. It can be perceived, in the table, that the variable Cash Holdings on average accounts for 18% of total assets and that the market value is 1.67 times the average book value of the firms. Acquisitions represent 2.7% of total assets, while Leverage accounts for 15.8% of total assets. Inventories stand for 11.7% of total assets, while Expenditures represent 4.2% of total assets. Finally, R&D accounts for 3.7% of total assets.
The correlation matrix for the whole sample and all the variables used in the analysis is presented in table 3. We can depict from the table that there is an obvious high and positive correlation between the variables Cash and Adjusted Cash. This is strictly because Adjusted Cash
18
is computed based on the variable Cash. Other than Adjusted Cash the variable Cash is positively correlated with R&D and Market-to-book and both statistically significant at 1%. Hence, the variable Cash is negatively correlated with the other variables, being all statistically significant at 1%.
When we analyse the relationship between the cash adjusted to the operating industry we can denote that, just like Cash the only positive correlation is with R&D and Market-to-book. All the other variables also report a negative correlation with Adjusted Cash. The only difference arises with the variable Expenditures, where it registers a 1% statistical significance for its correlation with Cash and a 5% statistical significance when correlated with Adjusted Cash.
19 Table 2. Descriptive Statistics
Descriptive Statistics
Variables Nº Observations Mean Standard Deviation p25 Median p75
𝐶𝑎𝑠ℎ 𝐻𝑜𝑙𝑑𝑖𝑛𝑔𝑠 𝐴𝑠𝑠𝑒𝑡𝑠 1234 0.180 0.211 0.026 0.101 0.250 𝐶𝑎𝑠ℎ 𝐹𝑙𝑜𝑤 𝐴𝑠𝑠𝑒𝑡𝑠 1234 -0.032 0.270 -0.072 0.045 0.108 𝐴𝑐𝑞𝑢𝑖𝑠𝑖𝑡𝑖𝑜𝑛𝑠 𝐴𝑠𝑠𝑒𝑡𝑠 1234 0.027 0.075 0 0 0.008 𝐼𝑛𝑣𝑒𝑛𝑡𝑜𝑟𝑦 𝐴𝑠𝑠𝑒𝑡𝑠 1234 0.117 0.126 0.006 0.074 0.203 𝐸𝑥𝑝𝑒𝑛𝑑𝑖𝑡𝑢𝑟𝑒𝑠 𝐴𝑠𝑠𝑒𝑡𝑠 1234 0.042 0.053 0.012 0.025 0.050 𝑁𝑊𝐶 𝐴𝑠𝑠𝑒𝑡𝑠 1234 0.225 0.165 0.093 0.218 0.334 𝑅&𝐷 𝐴𝑠𝑠𝑒𝑡𝑠 1234 0.037 0.097 0 0 0.022 𝑀𝑇𝐵 1234 1.670 3.855 0.656 1.180 2.329 𝐿𝑒𝑣𝑒𝑟𝑎𝑔𝑒 𝐴𝑠𝑠𝑒𝑡𝑠 1234 0.158 0.172 0.003 0.115 0.258 𝐴𝑠𝑠𝑒𝑡𝑠 1234 91665.47 233055.50 12522.00 29807.50 64602.00
20
Table 3. Correlation Matrix
Correlation Matrix
Cash Adjusted Cash Cash Flow Acquisitions Inventory Expenditures NWC R&D MTB Leverage Assets Cash 1.0000 Adjusted Cash 0.9147 1.0000 0.0000 Cash Flow -0.2259 -0.1323 1.0000 0.0000 0.0000 Acquisitions -0.0880 -0.1103 0.0608 1.0000 0.0020 0.0001 0.0328 Inventory -0.3479 -0.2391 0.1030 -0.0926 1.0000 0.0000 0.0000 0.0003 0.0011 Expenditures -0.0999 -0.0698 0.0336 -0.0436 -0.0698 1.0000 0.0004 0.0141 0.2387 0.1259 0.0143 NWC -0.3365 -0.2662 0.1770 -0.1120 0.6402 -0.1357 1.0000 0.0000 0.0000 0.0000 0.0001 0.0000 0.0000 R&D 0.3641 0.2099 -0.4445 -0.0474 -0.1868 -0.1077 -0.0784 1.0000 0.0000 0.0000 0.0000 0.0957 0.0000 0.0002 0.0059 MTB 0.1426 0.0975 0.0244 0.0676 -0.0629 0.0650 -0.0050 0.1034 1.0000 0.0000 0.0006 0.3924 0.0176 0.0271 0.0223 0.8621 0.0003 Leverage -0.4110 -0.3653 -0.0625 0.0619 0.0548 0.0797 -0.0043 -0.0470 -0.1692 1.0000 0.0000 0.0000 0.0281 0.0297 0.0544 0.0051 0.8810 0.0000 0.0987 Assets -0.1282 -0.1214 0.0923 0.0615 -0.0965 0.1836 -0.1581 -0.1087 -0.0001 0.2356 1.0000 0.0000 0.0000 0.0012 0.0308 0.0007 0.0000 0.0000 0.9967 0.0000 0.0001
21
5. Results
5.1. MM to AIM
5.1.1. Market change impact in companies cash holdings
The first analysis focuses on the change in the variable cash scaled by assets for the different periods. Tables 3 and 4 show the change in this variable for the companies moving from MM to AIM. It is reported that cash level is, on average, higher on the first fiscal year after the change, seeing a drop in the subsequent years. This conclusion applies to both periods ([-1, +1]; [-2,+2]). For the first case there is a 6.10% increase from period [-1] to period [0]. The second case reports a slight 0.43% decrease from period [-2] to period [-1] and a 9.52% surge from period [-1] to period [0] (the fiscal year immediately after the market change). This means that companies tend to increase their cash holdings when moving from the MM to the AIM (following what was predicted in H1). Motives, such as, the precautionary motive expressed in the “The General Theory of Employment, Interest and Money” Keynes (1936) and confirmed by subsequent authors may be one of the causes for such result. The different characteristics of the two markets, described in section 2, is also a factor that can be perceived as responsible for these results. Companies moving to the AIM will be entering a market with less liquidity and therefore can respond to this adversity by holding cash to finance future investments or to even run their business operations.
Table 4. MM to AIM [-1,+1]
MM to AIM [-1,+1]
Non-Industry Adjusted Industry Adjusted
Periods Cash Cash
-1 0.185 0.067
0 0.196 0.079
1 0.169 0.052
Table 5. MM to AIM [-2,+2]
MM to AIM [-2,+2]
Non-Industry Adjusted Industry Adjusted
Periods Cash Cash
-2 0.178 0.060
-1 0.178 0.060
0 0.194 0.077
1 0.163 0.047
22
In the second year after moving to the AIM it is visible that companies cash holdings decrease by 14.17% for the period [-1, +1], and 19.23% for the period [-2, +2]. To our best knowledge, there is no empirical support or evidence on these results. However, this outcome can be justified by the possibility of bankruptcy proximity following the move to a market with less liquidity. It is important to outline this occurrence as it is common to both analysed periods.
This analysis is consistent with the industry adjusted results present in tables 4 and 5, as the changes follow the same direction of the ones presented in the cash holdings variable analysis. So, when controlling for the industry factor, industry adjusted cash holdings for the period [-1,+1] increased in 17.85% from period [-1] to [0] and for the period [-2,+2] increase in 0.81% from period [-2] to [-1] and 21.39% from period -1 to 0.
When looking at the industry adjusted results, in table 4 and 5 it is also possible to depict that the mean industry adjusted cash in the years after the move to the AIM is decreasing. For instance, for the period [-2, +2] in the fiscal year immediately after the move ([0]) the industry adjusted cash reports a co-efficient of 0.077 while two years after it is already 0.049. This means that as companies spend longer time in the AIM they tend to adjust to the levels of the companies operating in the same industry. This mean reversion shows that the amount of cash held by companies is also affected by their peer’s behaviour and decision making.
5.1.2. Regressions Analysis
As described in section 3 we estimated a model that aims at capturing the effect a market change has on companies cash holdings.
When analysing the regressions (see tables 6 and 7) close attention should be drawn to the variable After. This variable was computed according to the method used in Brisker et al. (2013). This contemplates a dummy variable that equals 1 for the years after the move to the AIM/MM and 0 for the years spent in the MM/AIM before the move, for the regression models estimated in the study. Following Brisker et al. (2013) we decided to control for firm and year fixed effects, by creating dummy variables for the sampled years and companies.
The variable After has a negative coefficient significant at 5% level for the period [-1,+1] and a negative coefficient significant at 1% level for the period [-2,+2]. This shows
23
that companies tend to hold less cash after moving from the MM to the AIM. Giving consistency to these results is the fact that when we control for the firm and year fixed effects the sign of the coefficient remains negative and the statistical significance remains at 1%, except for the result achieved in table 6 columns (2) and (3) where it goes to 5% and 10%, respectively. This result is also consistent with the drop visible in table 4 and 5 analysed in the previous section. Albeit, demonstrating an increase in cash holdings immediately after the move, verified that this variable suffered a significant decrease for the years following the market change.
As witnessed in, Brisker et al. (2013), the industry a company operates in has an impact on the amount of cash held by the firm. We can see evidence of this in tables 4 and 5, where cash is converging to zero15 following the maturity of the company in the market. For this reason, we decided to adjust the dependent variable Cash to the industry. The results reported in columns (4), (5) and (6) of tables 6 and 7 enforce the results achieved in the non-industry adjusted section. For the two analysed periods the variable After also features a negative coefficient with the significance level ranging from 1% to 10%.
15 Given that the industry adjusted cash is computed comparing the median of each industry with the median of each firm, the closer the coefficient is to zero means the closer the firms cash holdings is to that of the industry.
24
Table 6. Regression results MM to AIM [-1,+1]
Regression results MM to AIM [-1,+1] Independent
Variables Non-industry adjusted Industry adjusted
(1) (2) (3) (4) (5) (6) Intercept 0.394*** 0.532 0.438*** 0.252*** 0.411 0.334** (0.028) (.) (0.141) (0.027) (.) (0.136) After -0.029** -0.031** -0.035* -0.031* -0.031** -0.040** (0.012) (0.012) (0.018) (0.016) (0.012) (0.017) Cash Flows -0.093 -0.025 -0.027 -0.041 -0.034 -0.035 (0.066) (0.062) (0.068) (0.062) (0.069) (0.075) Acquisitions -0.318*** -0.569*** -0.540*** -0.310*** -0.566*** -0.549*** (0.068) (0.123) (0.132) (0.064) (0.120) (0.132) Inventory -0.334*** -0.280 -0.282 -0.212*** -0.252 -0.277 (0.095) (0.199) (0.213) (0.070) (0.205) (0.219) Expenditures -0.614*** -0.516** -0.535** -0.508*** -0.558*** -0.580*** (0.194) (0.204) (0.211) (0.159) (0.198) (0.204) Net Working Capital -0.305*** -0.880*** -0.889*** -0.274*** -0.814*** -0.813*** (0.083) (0.193) (0.192) (0.068) (0.201) (0.197) R&D 0.421*** -0.387* -0.403* 0.192 -0.429* -0.465* (0.129) (0.211) (0.229) (0.144) (0.252) (0.253) Market-to-book 0.002 0.001 0.000 0.002 0.000 -0.000 (0.003) (0.002) (0.002) (0.003) (0.002) (0.002) Leverage -0.461*** -0.065 -0.061 -0.398*** -0.068 -0.060 (0.073) (0.134) (0.145) (0.065) (0.142) (0.154) Observations 436 436 436 436 436 436 Nº Companies 145 145 145 145 145 145 R-squared 0.436 0.828 0.833 0.320 0.772 0.777
Year Fix. Effect No No Yes No No Yes
Firm Fix. Effect No Yes Yes No Yes Yes
Standard errors in parentheses *** p<0.01, ** p<0.05, * p<0.1
25
Table 7. Regression results MM to AIM [-2,+2]
Regression results MM to AIM [-2,+2] Independent
Variables Non-industry adjusted Industry adjusted
(1) (2) (3) (4) (5) (6) Intercept 0.386*** 0.529*** 0.636*** 0.246*** 0.418*** 0.549*** (0.035) (0.067) (0.089) (0.034) (0.070) (0.099) After -0.032*** -0.036*** -0.023*** -0.035*** -0.037*** -0.022*** (0.012) (0.013) (0.005) (0.013) (0.012) (0.006) Cash Flows -0.080* -0.007 -0.005 -0.034 0.000 0.003 (0.045) (0.031) (0.032) (0.041) (0.036) (0.036) Acquisitions -0.269*** -0.355*** -0.343*** -0.301*** -0.366*** -0.351*** (0.080) (0.122) (0.122) (0.057) (0.119) (0.116) Inventory -0.253** -0.198 -0.217 -0.118 -0.110 -0.139 (0.101) (0.159) (0.162) (0.083) (0.154) (0.157) Expenditures -0.493*** -0.296** -0.296** -0.404*** -0.268* -0.266* (0.161) (0.135) (0.130) (0.151) (0.149) (0.145) Net Working Capital -0.347*** -0.837*** -0.843*** -0.303*** -0.792*** -0.795*** (0.083) (0.170) (0.167) (0.077) (0.174) (0.172) R&D 0.388*** -0.246 -0.239 0.165 -0.302 -0.293 (0.109) (0.184) (0.183) (0.107) (0.194) (0.193) Market-to-book 0.002 -0.001 -0.001 0.001 -0.001 -0.001 (0.003) (0.002) (0.002) (0.002) (0.002) (0.002) Leverage -0.464*** -0.139* -0.137* -0.424*** -0.135* -0.132* (0.084) (0.076) (0.077) (0.075) (0.075) (0.076) Observations 631 631 631 631 631 631 Companies 126 126 126 126 126 126 R-squared 0.412 0.770 0.780 0.293 0.719 0.731
Year Fix. Effect No No Yes No No Yes
Firm Fix. Effect No Yes Yes No Yes Yes
Standard errors in parentheses *** p<0.01, ** p<0.05, * p<0.1
26 5.2. AIM to MM
5.2.1. Market change impact in companies cash holdings
After testing what happens to companies’ cash holdings when moving from a more regulated and liquid market to a market with barriers of entry but less liquidity and regulation, we decided to test the effect of the opposite move.
As seen by the examples mentioned in Section 2.1. a move from the AIM to the MM is expected to be performed by companies seeking for growth opportunities, which can be reached by the credibility and leverage (credit availability) environment provided by the MM. Tables 8 and 9 show the evolution of cash holdings means through time for the periods [-1,+1] and [-2,+2]. These tables also contemplate a comparison between cash holdings adjusted and non-adjusted to their operating industry. For the 3-year period it is noticeable that cash holdings tend to decrease following the market change. From [-1] to [+1] non-industry adjusted cash decreased by 7.15% and from [-2] to [+2] it decreased 23.85%. Results were also collected for the industry adjusted cash. For the period [-2,+2] detailed in table 9, it is possible to confirm the reliability of the results as a 62.10% decrease is conveyed for the mean industry adjusted cash holdings for the year before the market change compared with the coefficient reporting to three years after this change.
Table 8. AIM to MM [-1,+1]
AIM to MM [-1,+1]
Non-Industry Adjusted Industry Adjusted
Periods Cash Cash
-1 0.190 0.024
0 0.185 0.016
1 0.176 0.026
Table 9. AIM to MM [-2,+2]
AIM to MM [-2,+2]
Non-Industry Adjusted Industry Adjusted
Periods Cash Cash
-2 0.229 0.060
-1 0.179 0.011
0 0.180 0.012
1 0.182 0.033
27
Albeit, being consistent with the hypothesis that companies moving from the AIM to the MM would have incentives to decrease their cash holdings levels (following H2), results are not statistically significant. The main reason, and one of the limitations of this study is related to the considerably small sample used. This is mainly due to the fact that the AIM is a relatively recent market, which did not comport many moves to the MM as it would be desired for achieving a more reliable result. As it can be verified by the information available in tables 10 and 11 for the period [-1,+1] we only collected 87 observations corresponding to 29 companies, while for the period [-2,+2] we collected 135 observations which corresponds to 27 moving companies.
5.2.2. Regressions Analysis
The variable After, as in the previous regressions analysis is the variable to which we draw more attention. This is because this dummy variable accurately measures the impact market move has on cash holdings.
Despite being non-statistically significant we can see that for both scenarios in period [-1,+1] the information collected by the regressions not controlling for the year and firm fixed effects reports a negative coefficient for this variable (see table 10). This means that companies reported a lower cash holding level after moving to the AIM, and the same remains constant for this period.
However, looking at the regression computed for the period [-2,+2] the outcome portrays different results (see table 11). The most interesting result is the one present in column (6) where we can see that the coefficient for the variable After is positive at a 5% statistical significance level. This means that when we control for the firm and year fixed effects and adjust cash holdings for their operating industry the data suggests that companies moving from the AIM to the MM have a higher level of cash holdings.
28
Table 10. Regression results AIM to MM [-1,+1]
Regression results AIM to MM [-1,+1] Independent
Variables Non-industry adjusted Industry adjusted
(1) (2) (3) (4) (5) (6) Intercept 0.222*** 0.093 0.369*** 0.029 0.049 0.414*** (0.052) (0.063) (0.058) (0.076) (0.066) (0.037) After -0.023 -0.008 -0.028 -0.001 0.005 -0.025 (0.036) (0.036) (0.077) (0.034) (0.041) (0.077) Cash Flows 0.135 -0.222 -0.023 0.012 -0.259 -0.017 (0.126) (0.211) (0.089) (0.174) (0.238) (0.117) Acquisitions -0.145 0.048 0.087 -0.062 0.052 0.105 (0.242) (0.206) (0.191) (0.227) (0.240) (0.196) Inventory -0.832*** -1.545 -2.089** -0.756*** -1.508 -2.158* (0.268) (0.941) (0.911) (0.215) (1.077) (1.086) Expenditures 0.126 -0.500* -0.298 0.315 -0.575** -0.494 (0.228) (0.268) (0.872) (0.264) (0.282) (0.989) Net Working Capital -0.118 -0.060 -0.773** -0.136 0.107 -0.792* (0.177) (0.312) (0.380) (0.243) (0.346) (0.398) R&D 1.055** -0.665 -0.550** 0.611 -0.646 -0.534** (0.427) (0.488) (0.229) (0.385) (0.541) (0.234) Market-to-book 0.007 0.001 -0.012 0.007 0.000 -0.013 (0.008) (0.004) (0.007) (0.006) (0.004) (0.008) Leverage -0.322*** -0.103 -0.022 -0.160 -0.119 -0.052 (0.092) (0.206) (0.241) (0.098) (0.246) (0.245) Observations 87 87 87 87 87 87 Companies 29 29 29 29 29 29 R-squared 0.476 0.860 0.924 0.286 0.791 0.898
Year Fix. Effect No No Yes No No Yes
Firm Fix. Effect No Yes Yes No Yes Yes
Standard errors in parentheses *** p<0.01, ** p<0.05, * p<0.1
29
Table 11. Regression results AIM to MM [-2,+2]
Regression results AIM to MM [-2,+2]
Independent Variables Non-industry adjusted Industry adjusted
(1) (2) (3) (4) (5) (6) Intercept 0.221*** 0.106 0.174 0.053 0.063 0.190* (0.045) (0.072) (0.112) (0.064) (0.062) (0.103) After -0.014 -0.006 0.057 0.003 0.016 0.073** (0.025) (0.022) (0.035) (0.033) (0.024) (0.036) Cash Flows 0.100 0.036 0.006 -0.009 0.005 -0.025 (0.061) (0.172) (0.185) (0.081) (0.178) (0.196) Acquisitions -0.257* -0.129 -0.081 -0.264** -0.147 -0.051 (0.142) (0.157) (0.141) (0.109) (0.170) (0.149) Inventory -0.223 0.113 0.358 -0.324 0.091 0.354 (0.237) (0.390) (0.395) (0.238) (0.378) (0.369) Expenditures 0.048 -0.012 0.152 0.201 -0.014 0.177 (0.126) (0.312) (0.379) (0.200) (0.373) (0.426) Net Working Capital -0.265** -0.263 -0.467 -0.242 -0.127 -0.382 (0.118) (0.241) (0.281) (0.154) (0.236) (0.289) R&D 0.838** 0.011 -0.047 0.406 -0.059 -0.109 (0.323) (0.452) (0.502) (0.255) (0.439) (0.508) Market-to-book 0.011*** 0.006 -0.003 0.010** 0.007 -0.003 (0.004) (0.006) (0.006) (0.005) (0.006) (0.006) Leverage -0.299*** -0.180 -0.216 -0.195** -0.215 -0.294 (0.092) (0.244) (0.304) (0.096) (0.230) (0.288) Observations 135 135 135 135 135 135 Companies 27 27 27 27 27 27 R-squared 0.434 0.760 0.805 0.252 0.679 0.753
Year Fix. Effect No No Yes No No Yes
Firm Fix. Effect No Yes Yes No Yes Yes
Standard errors in parentheses *** p<0.01, ** p<0.05, * p<0.1
30 5.3. Z-score
As it can be seen from the latter analysis cash holdings are sensible to a variety of factors. One factor identified and widely explored in the literature is the financial distress caused by bankruptcy probability (Acharya et al., 2012). To understand the impact this phenomenon has on our sample we used the measure equation developed by Altman (1968). This measure was also used as a robustness test.
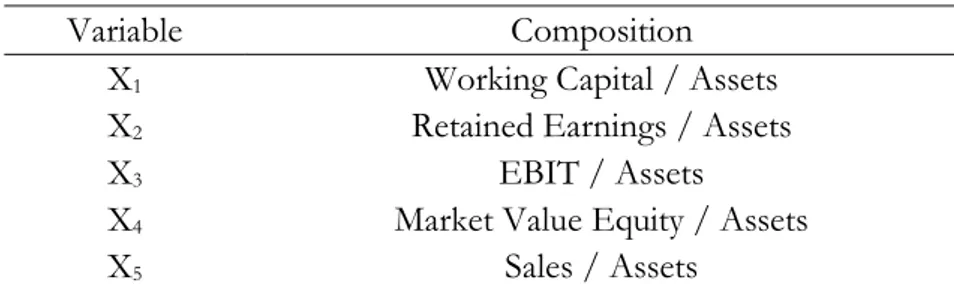
The Altman Z-Score is therefore an equation that computes the probability of a firm going bankrupt. This is measured as:
𝐴𝑙𝑡𝑚𝑎𝑛 𝑍′𝑠 = 1.2𝑋
1+ 1.4𝑋2+ 3.3𝑋3+ 0.6𝑋4+ 0.999𝑋5
Table 12 outlines the detail of each variable.
Table 12. Altman Z-Score detailed variables
Altman Z-Score detailed variables
Variable Composition
X1 Working Capital / Assets
X2 Retained Earnings / Assets
X3 EBIT / Assets
X4 Market Value Equity / Assets
X5 Sales / Assets
This equation will produce a score and the greater a firm’s bankruptcy potential, the lower its score (Altman, 1968). To measure the impact bankruptcy proximity has on cash holdings we divided the sample according to the median. Then the regression model was produced for the same variables presented in the regression analysis of Sections 4.1.2. and 4.2.2. The sample was divided according to their Altman Z-Score and we were therefore able to identify the impact bankruptcy proximity has on company cash holdings. The results following the regression conditioned by the Z-Score are presented in the annexes in tables A.3., A.4., A.5. and A.6.
First, we analyse the impact Z-Score has on the companies cash holdings when they change from the MM to the AIM (see tables A.3. and A.4.). The results achieved by the model depict that companies closer to bankruptcy will tend to report a significant reduction on their cash holdings when they move from the MM to the AIM. This outcome is significant to 1% for all the coefficients of the variable After, except for when both firm and year fixed
31
effects are present (significance level drops to 10% and 5% for the periods 1,+1] and [-2,+2], respectively. Interestingly, the same negative coefficient is obtained (overall) for the variable After when looking at companies that are further from bankruptcy. Suggesting that when companies move from the MM to the AIM there is in fact a tendency for their cash holdings to decrease, despite the probability of the firm going bankrupt. However, it was attainable that there is a stronger relationship between firms closer to bankruptcy and the cash holdings reduction. Therefore, it was expected that companies closer to bankruptcy and moving to a market with less liquidity would tend to turn their reliance on internal reserves to cope for financial casualties and regular business operations, therefore increasing cash holding levels. This however was not verified by the regression. The only problem with the regression results for the companies present in the top-tier is the lack of statistical significance.
Second, we analyse the impact of Z-Score on cash holdings for companies changing from the AIM to the MM (see tables A.5. and A.6.). When accounting for the companies in the low-tier (closer to bankruptcy) it is possible to understand that these companies cash holdings tend to decrease following the move to the MM. When looking at companies with a lower tendency to go bankrupt we can depict that, in general, their cash holdings tend to increase following the market change. This could suggest that although companies have less financial distress and moved to a market with better access to capital still maintained increasing their cash holdings (when we expected them not too). This result, however, contradicting the results achieved in the latter regression analysis lacks statistical significance for the outcome gathered for the companies present in the top-tier of the Altman Z-Score analysis.
32
6. Conclusion
The study analysis the variability in UK companies cash holdings following the fluctuation between the Alternative Investment Market and the Main Market. The 15-year analysed data suggests that a market change has a significant impact on firm cash holdings and that this variable is considered by the corporate structure of the firms in the decision-making process.
The results achieved by this paper are both conclusive and inconclusive. They are conclusive in the way that they allow for a better comprehension of the behaviour cash holdings have when firms change from the MM to the AIM. Following the cash means’ and the regression analysis we can conclude that moving from the MM to the AIM is a decision that will increase companies cash holdings in the year immediately after their move. This is due to the less access to credit and the necessity to rely on internal reserves following the move to a less liquid market. This study also concludes that the years prior to the immediate change will follow a deep decrease in companies cash holdings. This is believed to be driven by the adjustment companies may suffer when settling down in a different market and is present in the industry adjusted analysis. The longer companies spent in the AIM the closer to zero their industry adjusted cash holdings were. Meaning their resemblance with already existing firms (operating in the same industry) revealed a significant decrease of the industry adjusted cash mean from 0.077 (immediate after change) to 0.049 (3 years after the change). The results are inconclusive when it comes to the move from the AIM to the MM. This is mainly due to the small sample, which limits the study to non-statistically significant results. The size of the sample was conditioned by the fact that the AIM is a recent market with a small number of moves to the MM that fulfil the requirements imposed by this study. The impact bankruptcy proximity has on firm cash holdings is also tested in this study. Bankruptcy plays, according to the results, an interesting role when evaluating the amount of cash held by companies. It denotes that the impact of bankruptcy on changes from the MM to the AIM has the same direction when the different level of bankruptcy is compared (negative coefficient for companies in the top and lower tiers). With more conclusive results achieved for companies closer to bankruptcy. For companies that moved to the MM the results are more inconclusive and one of the factors contributing to this is the small sample problem described in the latter paragraph.
33
Overall these results allow for a better comprehension of cash holdings behaviour when applied to a market change between AIM and MM. With maturity adding up to the AIM and with companies graduating from this market to the MM we believe more conclusive outcomes may surge from future analysis. Moreover, an analysis of the macroeconomic impact in cash holdings evaluating the price of money (i.e. interest rates) together with other variables can be computed to develop a better understanding of the relationship between cash holdings and the two UK markets.
34
References
Acharya, V., Engle, R., & Richardson, M. (2012). Capital shortfall: A new approach to ranking and regulating systemic risks. American Economic Review, 102(3), 59-64.
Altman, E. I. (1968). Financial ratios, discriminant analysis and the prediction of corporate bankruptcy. The journal of finance, 23(4), 589-609.
Brisker, E. R., Çolak, G., & Perterson, D. R. (2013). Changes in cash holdings around the S&P 500 additions. Journal of Banking & Finance, 37(5), 1787-1807. doi:
http://dx.doi.org/10.1016/j.jbankfin.2013.01.021
Denis, D. J., & McKeon, S. B. (2017). Persistent operating losses and corporate financial policies.
Dittmar, A., Mahrt-Smith, J., & Servaes, H. (2003). International corporate governance and corporate cash holdings. Journal of Financial and Quantitative analysis, 38(01), 111-133.
Farinha, J., Mateus, C., & Soares, N. (2018). Cash holdings and earnings quality: evidence from the Main and Alternative UK markets, International Review of Financial Analysis 56 (2018), 238-252.
Gerakos, J., Lang, M., & Maffett, M. (2013). Post-listing performance and private sector regulation: The experience of London's Alternative Investment Market. Journal of Accounting and Economics, 56(2), 189-215.
Gow, I. D., Ormazabal, G., & Taylor, D. J. (2010). Correcting for cross-sectional and time-series dependence in accounting research. The Accounting Review, 85(2), 483-512.
Guney, Y., Ozkan, A., & Ozkan, N. (2007). International evidence on the non-linear impact of leverage on corporate cash holdings. Journal of Multinational financial management, 17(1), 45-60.
Harford, J., Mansi, S. A., & Maxwell, W. F. (2008). Corporate governance and firm cash holdings in the US Journal of Financial Economics, 87, 535–555.
35
J. M. Keynes (1936), The General Theory of Employment, Interest and Money, Cambridge: Macmillan Cambridge University Press
Jensen, M. C. (1986). Agency cost of free cash flow, corporate finance, and takeovers. Corporate Finance, and Takeovers. American Economic Review, 76(2).
Kalcheva, I., & Lins, K. V. (2007). International evidence on cash holdings and expected managerial agency problems. Review of Financial Studies, 20(4), 1087-1112.
Myers, S. C., & Majluf, N. S. (1984). Corporate financing and investment decisions when firms have information that investors do not have. Journal of Financial Economics, 13(2), 187-221.
Nason, R. S., & Patel, P. C. (2016). Is cash king? Market performance and cash during a recession. Journal of Business Research.
Opler, T., Pinkowitz, L., Stulz, R., & Williamson, R. (1999). The determinants and implications of corporate cash holdings. Journal of Financial Economics, 52(1), 3-46.
Ozkan, A., & Ozkan, N. (2004). Corporate cash holdings: An empirical investigation of UK companies. Journal of Banking & Finance, 28(9), 2103-2134.
Petersen, M. A. (2009). Estimating standard errors in finance panel data sets: Comparing approaches. The Review of Financial Studies, 22(1), 435-480.
Pinkowitz, L., Stulz, R., & Williamson, R. (2006). Does the contribution of corporate cash holdings and dividends to firm value depend on governance? A cross‐country analysis. The Journal of Finance, 61(6), 2725-2751.
Riddick, L. A., & Whited, T. M. (2009). The corporate propensity to save. The Journal of Finance, 64(4), 1729-1766.
Shleifer, A., & Vishny, R. W. (1989). Management entrenchment: The case of manager-specific investments. Journal of Financial Economics, 25(1), 123-139.
Thompson, S. B. (2011). Simple formulas for standard errors that cluster by both firm and time. Journal of financial Economics, 99(1), 1-10.
36
Vismara, S., Paleari, S., & Ritter, J. R. (2012). Europe's second markets for small companies. European Financial Management, 18(3), 352-388.
37
Annexes
Table A.1. MM admission fees for UK and international companies
Source: LSE: Fees for Issuers
Table A.2. AIM admission fees
![Table 4. MM to AIM [-1,+1]](https://thumb-eu.123doks.com/thumbv2/123dok_br/15142591.1012024/28.892.210.725.768.882/table-mm-to-aim.webp)
![Table 9. AIM to MM [-2,+2]](https://thumb-eu.123doks.com/thumbv2/123dok_br/15142591.1012024/33.892.208.729.969.1119/table-aim-to-mm.webp)