Return and Liquidity Relationships on Market and Accounting Levels
in Brazil*
Fernanda Finotti Cordeiro Perobelli
Universidade Federal de Juiz de Fora, Faculdade de Economia, Juiz de Fora, MG, Brazil
Rubens Famá
Universidade de São Paulo, Faculdade de Economia, Administração e Contabilidade, Departamento de Administração, São Paulo, SP, Brazil
Luiz Claudio Sacramento
Fundação Getúlio Vargas, Escola Brasileira de Administração Pública e de Empresas, Rio de Janeiro, RJ, Brazil
Received on 01.12.2015 – Desk acceptance on 02.12.2015 – 4th version approved on 04.15.2016.
ABSTRACT
This article discusses profitability-liquidity relationships on accounting and market levels for 872 shares of publicly-traded Brazilian com-panies, observed between 1994 and 2013. On the market level, the assumption is that share liquidity is able to reduce some of the risks incurred by investors, making them more willing to pay a higher price for liquid shares, which would lower expected market returns. On the accounting level, the basic hypothesis argues that a firm’s holding more liquid assets is related to a conservative investment policy, possibly reducing accounting returns for shareholders. Under the assumption of financial constraint, however, more accounting liquidity would allow positive net present value investments to be carried out, increasing future accounting returns, which would positively affect market liquidity and share prices in an efficient market, resulting in a lower market risk/expected return premium. Under the assumption of no financial constraint, however, more accounting liquidity would only represent a carry cost, compromising future accounting returns, which would adversely affect market liquidity and share prices and result in a higher market risk/expected return premium. Among the hypotheses, the presence of a negative market liquidity premium was verified in Brazil, with shares that traded more exhibiting a higher expected market return. On the margins of the major theories on the subject, only two negative relationships between excess accounting liquidity and market liquidity and accounting return, supporting the carry cost assumption for financially unconstrained firms, were ve-rified. In terms of this paper’s contributions, there is the analysis, unprecedented in Brazil as far as is known, of the relationship between liquidity and return on market and accounting levels, considering the financial constraint hypothesis to which the firms are subject.
Keywords: market liquidity, accounting liquidity, market risk/expected return, accounting return, financial constraints.
1 INTRODUCTION
proposed by Fama and French (1993). They concluded that expected return is negatively correlated to the rate of turnover, supporting the results obtained by Amihud and Mendelson (1986). In Brazil, Machado and Medei-ros (2012), using shares listed on the São Paulo Stock Exchange (BM&FBOVESPA) between June 1995 and June 2008, sought to price assets in function of the beta measured by the CAPM (Capital Asset Pricing Model) model from Sharpe (1964), passing through Fama and French (1993), and by the Keene and Peterson (2007) model, which considers, in the pricing of expected ma-rket return, the beta factors size, book-to-mama-rket, and market liquidity. This last model, according to its au-thors, was – compared to the others – the one with the greatest predictive ability. Minardi et al. (2005) also sou-ght to verify the presence of a premium for liquidity in Brazil; highlighting the friction that exists in this market and the irrelevance of market-maker actions, the authors concluded that a premium for negative liquidity exists in the market in question, with more liquid shares exhibi-ting systematically higher returns.
These results bring about reflections regarding the market liquidity versus expected market risk/return relationship in Brazil. Considering the extensive time-frames and range of assets, comprising all non-financial company shares traded on the BM&FBOVESPA during the 20 years of financial stability after the implementa-tion of the Plano Real in 1994, the first aim of this paper is to analyze the market liquidity versus expected ma-rket risk/return relationship for the 872 shares monito-red quarterly between 1994 and 2013. But not only this; innovatively, as far as is known, and assuming that the behavior of share prices in the market can reflect the economic-financial situation of the issuing companies, cross-relationships (and potential trade-offs) between liquidity and accounting return and liquidity and ex-pected market risk/return will be theoretically discussed and estimated for the companies that compose the sam-ple, with joint analysis of the four indicators being the second, and main aim of this paper.
In accounting terms, what is discussed in the litera-ture is a possible trade-off between accounting liquidity and profitability caused by the assumption that com-panies that carry more liquid assets would be less apt to generate greater accounting returns for shareholders (commonly defined as net income per unit of net equity, or return on equity, or simply ROE).
Higher accounting returns would be the natural compensation for an increase in operational risk brou-ght on by greater immobilization of capital (lower ac-counting liquidity), as argued by Walker (1964). This author explores the accounting liquidity and accounting returns relationship for a business, elaborating a the-ory on working capital that postulates that accounting profitability would be a function of the ratio between One important aim of Accounting and Finance
re-search is to provide elements that allow for improved analysis of financial reports, predictability of firms’ fu-ture results (Fairfield, Whisenant, & Yohn, 2001), and ultimately help in agent decision making.
In informationally efficient markets (Fama, 1970, 1991), it is expected that information released relating to firms is quickly and correctly passed on into their share prices. However, researchers such as Eberhart, Maxwell, and Siddique (2004) find evidence that even the most active and developed markets, such as in the US, are slow in correctly identifying and evaluating accounting infor-mation. At times, sluggishness in transmission can result from the difficulty itself of recognizing a piece of infor-mation as positive or negative. Take, for example, the (potential) trade-off between liquidity and profitability. In the stock market setting, more liquid shares would represent lower investment exit risk for the investor. Therefore, they should be recognized as more attractive assets, enjoying a higher price and lower market risk/ expected return.
Authors such as Amihud and Mendelson (1986, 2000) argue that less liquid shares in the market need to be traded with a discount in the current price that attracts investors – or, in other words, they need to offer a risk premium in order to attract investors to hold the asset in the long run. According to Demsetz (1968) and Amihud and Mendelson (1986), market liquidity can be described as the cost of immediate execution of a buy or sell order. Not unusually, market liquidity is measu-red by the bid-ask spread, or the difference between the price of buying and the price of selling an asset on the market, as originally proposed by Demsetz (1968). Au-thors who use a similar concept are: Chordia, Roll, and Subrahmanyan (2000) and Gopalan, Kadan, and Pevzner (2012); and, in Brazil, Minardi, Sanvicente, and Montei-ro (2005), and Correia and Amaral (2012).
For Pastor and Stambaugh (2001), liquidity is the abi-lity to quickly trade large quantities of assets, at a low cost and without this altering the price of the asset much. For Rösch, Subrahmanyam, and Dijk (2013), greater liqui-dity, represented by trading volume, implies decreased friction – or transaction costs – in the market, making it more distribution efficient. Examples of authors who used trading volume or turnover (volume in terms of the amount of securities issued) as a proxy for market liqui-dity in their articles are: Demsetz (1968), Datar, Naik, and Radcliffe (1998), Chordia, Roll, and Subrahmanyan (2011), and, in Brazil, Correia and Amaral (2012).
working capital held and fixed capital. If the ratio be-tween working capital and fixed capital increased, this would mean that a company would be more liquid, that is, assuming lower operational risks, and as a result of this reduction in risk, it would also be generating lower accounting returns.
Authors such as Lazaridis and Tryfonidis (2006), using the cash conversion cycle (CCC) concept – which is defined as equal to the sum of the average timefra-me for receiving paytimefra-ments from client and the average timeframe for storage minus the average timeframe for paying for purchases -, conclude that, in fact, there is a negative relationship between CCC and profitability, measured by the authors via gross operational return. The authors observed that low gross operational returns are associated with an increase in the number of days for accounts payable. This leads them to the conclusion that companies with lower accounting profitability wait longer to meet their obligations with suppliers, accumu-lating funds. The same effect is verified in the negative relationship between receivables and company accoun-ting profitability, which would be: the higher the liquidi-ty stored in receivables, requiring more working capital, the lower the accounting profitability.
There are, however, authors such as Chan (2010) who argue in favor of a positive relationship between accoun-ting liquidity and profitability in a context of financial constraint, consistent with the idea postulated by Hiri-goyen (1985) and verified both by Baghiyan (2013) and by Ding, Guariglia, and Knight (2010) for developing markets. Baños-Caballero, García-Teruel, and Martínez--Solano (2013) are authors who find a U-shaped rela-tionship for the two indicators, showing that both little working capital and excess working capital can be preju-dicial to firm performance.
In Brazil, Pimentel (2008) found a positive rela-tionship between accounting liquidity and profitability in the long run. Using a sample composed of companies listed among the “500 Biggest and Best” in the Revista
Exame, between 2000 and 2005, the concepts of current
liquidity (current assets divided by current liabilities) and return on assets (net income divided by total assets) and the panel data methodology, the author found that current liquidity was positively related to return on as-sets, supporting the hypothesis from Hirigoyen (1985).
Following on from the paper by Pimentel (2008), Vieira (2010) also sought to verify whether there was a negative relationship between accounting liquidity and profitability in the short run, and a positive one in the long run. The sample was global, composed on 48 airli-ne companies, observed between 2005 and 2008. Again using current liquidity as a measure of liquidity, and re-turn on assets for profitability, the author concluded that accounting liquidity and profitability exhibited a posi-tive relationship, contrary to the idea usually presented in the literature under the assumption of no financial constraint.
More recently, Pimentel and Lima (2011) related,
over time series, dry liquidity indicators (current assets minus stock divided by current liabilities) and the pro-fitability of companies from the textiles sector traded on the BM&FBOVESPA between March 1995 and Mar-ch 2009. They concluded that, in the medium to long run, there was, in fact, a positive relationship between liquidity and profitability; that is, companies with low accounting profitability would also be those with low accounting liquidity, which would again contradict a po-tential trade-off between liquidity and return on the ac-counting level. The authors, however, could not establish a causal relationship between liquidity and profitability, with an inverse relationship being observed, for most of the companies analyzed, between profitability and liqui-dity. In other words, liquidity ends up resulting from the observed profitability (self-funding), and not being a de-terminant of this profitability.
The concepts of current and dry liquidity, however, treat different investments and financing in the same way, whether they are of a permanent nature (operatio-nal) or of a seasonal nature (financial), and greater dis-crimination between these items is necessary. Fleuriet, Kehdy, and Blanc (2003) argue that in order to define excess accounting liquidity, i.e., that which is really able to destroy accounting profitability, it is first necessary to reclassify current assets and liabilities. The cash balance, according to Fleuriet et al. (2003), represents a residual value obtained from the difference between Net Working Capital (long term funds raised by the company in ex-cess of its long term investments, or simply long term liabilities minus long term assets) and the Working Ca-pital Requirement (requirements of a permanent nature or clients plus stock minus suppliers). If Net Working Capital is not enough to fund the Working Capital Re-quirement, there will be a negative Cash Balance. This situation indicates that a company is funding part of its permanent requirements with short term funds, whi-ch may cause its risk of insolvency to increase. In this model, a company that has a positive cash balance finds itself in a state of greater financial security; however, if this balance is very high, the company ends up incurring liquidity carry costs, possibly generating lower accoun-ting returns for shareholders, with many funds ceasing to be allocated to more risky assets, which could gene-rate higher accounting profitability, respecting the the-oretical relationship between risk and return. The cash balance value therefore has to be calculated, as well as its quadratic version, in order to consider, in a more precise way, excess accounting liquidity – taken care of in this paper, unlike in the others found in the literature.
as Deloof (2003) and Howorth and Westhead (2003). Therefore, it would be interesting to verify not only the relationship between market liquidity and market risk/ expected return and between accounting liquidity and accounting return, but also cross-relationships between the four indicators.
Cross-checking accounting and market liquidity, Gopalan et al. (2012) observe that papers such as those from Chordia, Roll, and Subrahmanyam (2007) and Fo-ley, Hartzell, Titman, and Twite (2007) show a simulta-neous growth in market liquidity and in the accounting liquidity of firms in a context of constraint. In the un-folding of the subprime mortgage crisis of 2008, a joint decline in the liquidity of the assets of financial compa-nies and in the liquidity of their shares was observed. The question that naturally arises from observation of this fact is whether there is a relationship between ac-counting (firm) liquidity and market liquidity (of the securities that concede rights over firms’ assets). And, moreover, it questions – observing the arguments from Amihud and Mendelson (1986, 2000) – whether firms with greater accounting and market liquidity trade at a higher price, reflecting greater accounting returns in a context of constraint and enjoying a lower market risk/ expected return.
The first hypothesis from Gopalan et al. (2012) is that there is a relationship between accounting liquidity and market liquidity, but that this relationship may be both positive and negative. More accounting liquidity redu-ces the uncertainty related to future investments, via a reduction in financial constraint, which would increase the liquidity of shares. On the other hand, more accoun-ting liquidity allows more discretionary future invest-ments and implies carry costs, increasing investor risk and reducing share liquidity. The results found by the authors indicate that the two dimensions are positively related and that this relationship is more positive in fir-ms with few growth opportunities, that is, those with less discretion in choosing projects and which face greater financial constraint. The authors measure growth op-portunities using the market-to-book (MTB) ratio and capital expenditures (CAPEX). As proxies for financial constraint, the authors consider size, lack of credit ratin-gs, and a high likelihood of default.
Gopalan et al. (2012) also argue that in markets wi-thout friction and operating according to the assump-tions from Modigliani and Miller (1958), investments are independent from the source of funding. However, in markets with financial constraints and without so many investment opportunities capable of leading to overinvestment or exacerbating the constraint problem, the holding of liquid assets can bring value to firms and, according to Diamond and Verrecchia (1991), raise their price – which would reduce their market risk/expected return and cost of capital. Almeida and Eid (2014) also remind us that for financially constrained companies, greater accounting liquidity can increase the likelihood of firms implementing projects with positive net present
value, which would be abandoned under the hypothesis of not maintaining accounting liquidity. For firms that are not subject to this restriction, however, this benefit would simply not exist.
In Brazil, the study by Correia and Amaral (2012), in agreement with Gopalan et al. (2012), observes that ac-counting liquidity – measured by financial flexibility of cash flow – is reflected in the market liquidity of shares. According to the authors, more cash in hand diminishes the uncertainty associated with future cash flow and this improves the market liquidity of shares, making them more attractive, more expensive, and with a lower ma-rket risk/expected return.
Almeida and Eid (2014), using a sample of Brazilian companies listed on the BM&FBOVESPA, between 1995 and 2009, found evidence that an increase in the level of working capital at the start of the financial year redu-ces the value of company shares, increasing their market risk/expected return.
Outside the context of financial constraint, another explanation for the negative relationship between ac-counting liquidity and market risk/expected return is provided by Hirshleifer, Hou, Teoh, and Zhang (2004). For these authors, as information is vast and the abili-ty to process it is limited, investors end up using rules of thumb for decision making that lead to suboptimal choices. In their paper, the authors argue that the level of accounting liquidity (defined as operational assets mi-nus operational liabilities divided by total assets) is not fully evaluated in terms of effects on future accounting returns. In a simple way, investors evaluate information of more accounting liquidity as always being positive, so that there is never conflict between accounting liquidi-ty and accounting return. They then go on to overvalue shares in firms with greater accounting liquidity and de-mand a lower market risk premium for these shares.
For a potentially positive relationship between ac-counting return and expected market return, a similar explanation is given by Anderson and Garcia-Feijoo (2006) and Cooper, Gullen, and Schill (2008). These au-thors claim that growth of assets (measured by the an-nual variation in total assets) raises share prices – again, without a complete evaluation of the long term effects of such growth – and, therefore, depresses market risks/ expected returns. Considering that total assets, or the portion of these assets funded by shareholder equity, are the most common denominators in accounting re-turn measurements, their growth, unaccompanied by a proportional increase in profitability brought about by investments, would also reduce companies’ accounting return. Therefore, there may be a positive relationship between market risks/expected returns and accounting returns in a context of incomplete evaluation of informa-tion on the part of investors.
with risk and with expected company performance and that of their shares.
That said, the second aim of this paper is not only to evaluate the trade-off between accounting return and li-quidity, but also the way these two indicators are percei-ved by the market in terms of variation in prices, market risk/expected return, and market liquidity of company shares. As far as is known, joint observation of the four indicators (return and liquidity, at the accounting and market levels) is unprecedented in the literature.
Considering the wide set of theoretical relationships related to the issue, the results found for developed ca-pital markets, and the still few papers relating to develo-ping countries – which do not jointly evaluate the (po-tential) trade-off between liquidity and profitability at the accounting and market levels -, the theoretical con-cepts discussed will be tested paying special attention to the role performed by the financial constraint the firms are subject to, which will be considered via the proxies: size, market-to-book ratio (Gopalan et al., 2012), divi-dends per share, dividend payout, and dividend yield (Almeida & Campello, 2010), self-funding, the financial leverage multiplier, and cost and quality of debt – Table 1 contains the operational description of all of the varia-bles used.
The hypotheses of interest, according to the theories exposed and under the assumption of no financial cons-traint, are:
H1a: there is a negative relationship between market risk/expected return and market liquidity;
H2a: there is a positive relationship between market risk/expected return and accounting liquidity;
H3a: there is a negative relationship between
accoun-ting return and accounaccoun-ting liquidity;
H4a: there is a positive relationship between accoun-ting return and market liquidity;
H5a: there is a negative relationship between market risk/expected return and accounting return;
H6: there is a negative relationship between market liquidity and accounting liquidity.
That is, under no constraint, companies do not need to carry more liquid assets as a liquidity reserve; if they do so, they sacrifice accounting returns, are less traded in the market, have lower prices, and enjoy a higher ma-rket risk/expected return premium.
Under the assumption of financial constraint, we have:
H2b: there is negative relationship between market risk/expected return and accounting liquidity;
H3b: there is a positive relationship between accoun-ting return and accounaccoun-ting liquidity;
H6b: there is a positive relationship between market liquidity and accounting liquidity.
That is, under constraint, companies would need to carry more liquid assets as reserve liquidity; when they do so, they guarantee higher accounting returns, are more traded in the market, have higher prices, and enjoy a lower market risk/expected return premium.
Hypotheses 1, 4, and 5 are not related to carrying ac-counting liquidity to alleviate potential financial cons-traints, and therefore do not change with regards to the two scenarios considered.
Under the assumption of failure in evaluating infor-mation on the part of investors:
H5b: there is a positive relationship between market risk/expected return and accounting return.
2 METHODOLOGY
With the aim of investigating the proposed hypo-theses, a database was elaborated based on the Eco-nomática® software – containing accounting and sha-re price data for all of the companies listed on the BM&FBOVESPA, observed between the third quarter of 1994 and the third quarter of 2013. As the “market” level is important in this study, the prices and volumes traded for ordinary and preference shares and their combinations (Units) were considered, as well as ac-tive and cancelled shares, observed in order to avoid survival bias. Companies from the financial sector were excluded from the database, since their indicators are interpreted in a specific way. The final sample was composed of a maximum of 77 quarters under obser-vation and 872 shares.
The database was constructed in panel form, or ra-ther, predicting the variability of shares and the change in their values over time. They were piled in obser-vational units, as suggested by Wooldridge (2010). In order to place all of the data in this same scale, the average and standard deviation for each variable was
removed from the original values, returning all of the data in terms of deviations in relation to the average. In order to avoid the influence of outliers in the esti-mations, observations above and below 3 standard de-viations were ignored.
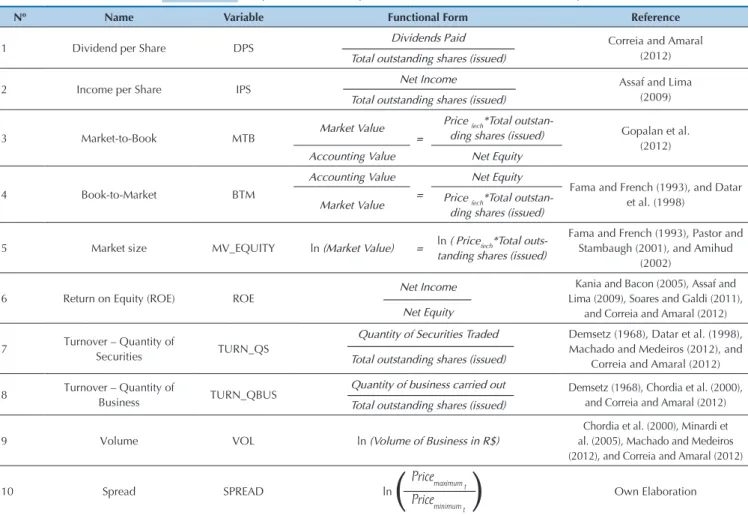
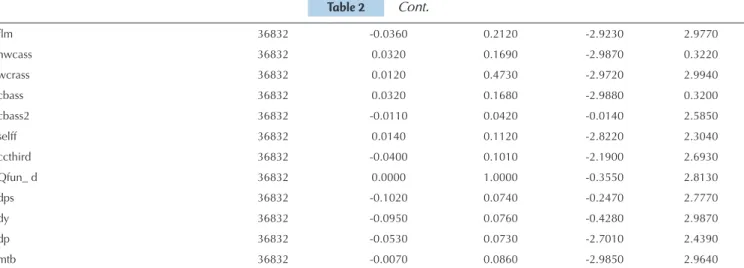
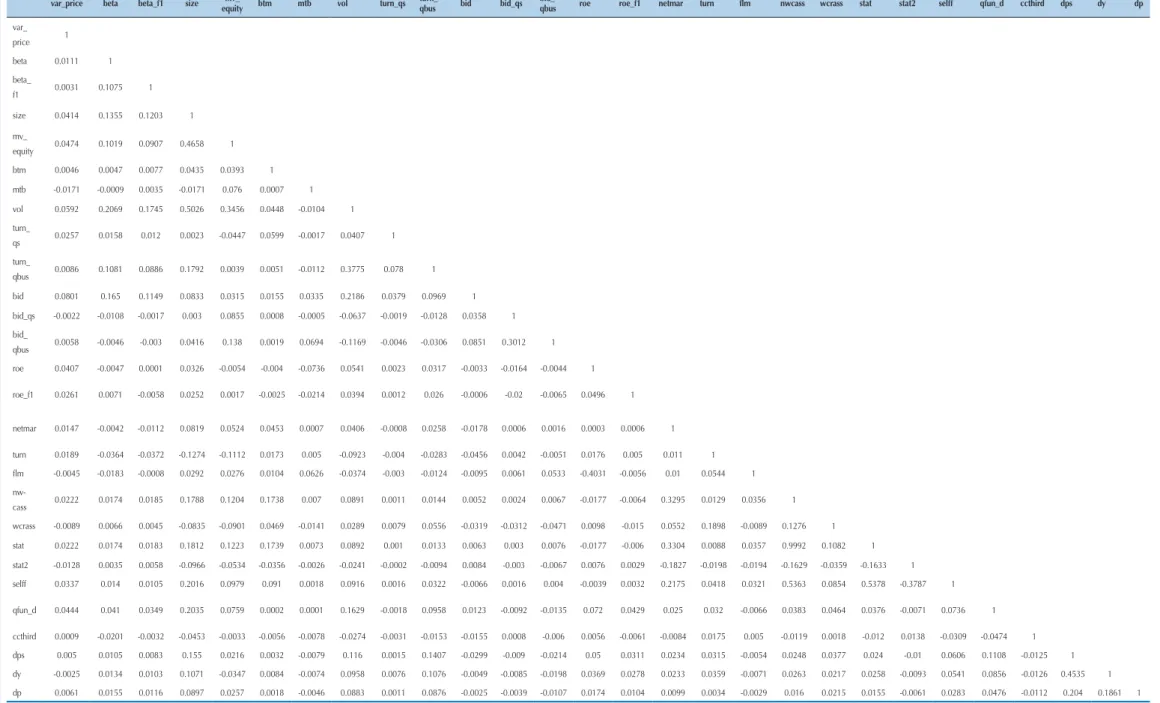
Table 1 presents the operational description of the variables considered in this study. Table 2 presents the descriptive statistics of these variables, while Table 3 presents the correlations between them.
Analyzing the correlations larger than 5% (in mag-nitude) in Table 3, it is possible to verify the following linear relationships for the study sample:
cash balance, practiced greater self-funding, paid more dividends, and contracted loans at lower rates than the operational return from the activity (measured by the EBIT – Earnings Before Interest and Taxes). The re-lationships indicate that large companies with no fi-nancial constraints are concerned. The QBUS_TURN variable – also related to volume traded, but standar-dized by the volume of assets in circulation – brought as additional information the fact that such companies would also be those requiring more working capital. The QS _TURN variable did not contribute any addi-tional information.
2. In relation to the spread in prices: analyzing the SPREAD variable, shares that traded with a bigger di-fference between maximum and minimum price were those that exhibited a greater variation in the prices for the period and a bigger current and future beta; they belonged to larger companies with less turnover, as al-ready indicated by the VOL variable. In other words, this variable also contributed no additional informa-tion in relainforma-tion to that resulting from the analysis of volumes traded.
3. In relation to the variation in prices in the quar-ter (VAR_PRICE) variable and the (current and future) BETA variable, shares that exhibited a greater varia-tion in prices and a bigger beta were those with greater volume traded and spread. They were also those with greater market value and volume of assets. Again, the-re was no new information in the-relation to those pthe-resen- presen-ted in (1) and (2).
4. Analyzing the variables related to company size (accounting/SIZE and in market value of shares/MV_ EQUITY), the two calculated proxies are quite corre-lated (47%). As already shown, the volume of assets held by a company is positively related to the variation in prices and beta, to the volume traded, and to the spread. Companies that were bigger were those that operate with higher margins and lower turnover, more net working capital and cash balance, a lower working capital requirement, a lower quadratic cash balance (excess liquidity), more self-funding, a better quality of funding, and that paid more dividends. These cor-relations indicate that financially unconstrained com-panies are concerned.
5. Observing the BTM and MTB variables, neither is correlated. Companies with higher BTM – such as “value” shares – and shares with higher MTB, such as “growth” companies (Fama & French, 1993), may be concerned. In the sample analyzed, companies with higher BTM traded more, generated more net margin, used more self-funding, and held more net working capital and cash balance. They also had more working capital requirements. Companies with higher MTB ge-nerated lower ROE and were more in debt.
6. In relation to accounting return, companies that generated higher ROE were the least in debt, obtained funding at suitable rates, and paid more dividends. They were those with lower MTB (growth
opportuni-ties) and traded more in the period. The results indica-te that mature companies are concerned.
7. In relation to accounting liquidity, net working capital (NWCASS) and cash balance (CBASS) are per-fectly correlated. The quadratic cash balance (CBASS2) is negatively correlated with both. As already shown, larger companies – with higher BTM, which used more self-funding and practiced bigger margins – presented more net working capital. These companies traded more in the market.
8. Regarding working capital requirements (WCREQ), smaller companies with higher turnover exhibited higher working capital requirements than the rest.
9. In relation to self-funding (SELFF) and the quali-ty of funding obtained (QFUND_D), larger companies with a higher BTM ratio obtained more capital in both ways (they are less constrained). These companies exhibited a higher ROE, margin, more net working ca-pital and working caca-pital requirements, a lower qua-dratic cash balance, and paid more dividends. Their shares traded more.
10. Finally, the companies that paid more dividen-ds (DPS, DY, and DP) were the largest, with a greater capacity for self-funding, a higher quality of funding, and a higher ROE. The shares in these companies were traded more. As indicated in (6), the results signal that mature companies are concerned.
The estimation of the four regressions of interest was carried out with the aim of verifying the liquidity--expected return relationship on the market and ac-counting levels. Moreover, control variables, chosen according to the literature from the area, were used in the four estimated regressions:
important: under the informationally efficient markets hypothesis, favorable information regarding future in-come and cash flow should have the power to increase share prices on date zero and reduce their market risk/ expected return premium, making it necessary to draw a distinction between the two variables, which should be negatively correlated. Thus, an additional variable was considered (VAR_PRICE), which deals with price changes resulting from new information received.
2. “MARKET LIQUIDITY” regression: this variable was related to the market risk/expected return (beta and future beta, size, and book-to-market ratio), to ac-counting liquidity (net working capital, working capi-tal requirement, cash balance, and quadratic cash ba-lance), and accounting return (ROE and future ROE), to price variations, and to the constraint proxies (divi-dend per share, divi(divi-dend yield, and divi(divi-dend payout, market-to-book, self-funding, cost of third-party capi-tal, quality of funding raised). As a dependent variable, the QBUS_ TURN (business turnover over the stock of shares issued) variable was chosen to represent market liquidity, since it is less subject – in comparison to the VOL and SPREAD variables – to the scale effect of the market value of shares. The VOL and SPREAD varia-bles, however, were used as controls in this regression. 3. “ACCOUNTING RETURN” regression: accor-ding to the thoughts of Correia and Amaral (2012), Soares and Galdi (2011), and Matarazzo (2003), sha-reholder accounting return is related to net margin, to
asset turnover, and to the financial leverage multiplier. Additionally, it was the aim of this study to relate it to market risk/expected return (current and future beta, size, and book-to-market ratio), to market liquidity (volume, turnover, and spread in prices), to accoun-ting liquidity (net working capital, working capital requirement, cash balance, and quadratic cash balan-ce), and to the variation in share prices. Moreover, the same constraint proxies were used as controls. As a de-pendent variable, as it is expected that an increase in accounting liquidity at date zero, in a context of cons-traint, has effects on investments and future accoun-ting returns, the ROEF1 variable was worked with, which represents accounting returns 4 quarters ahead.
4. “ACCOUNTING LIQUIDITY” regression: it was the aim of this study to relate it to market risk/expected return (beta and future beta, size, and book-to-market ratio), to market liquidity (volume, turnover, and spre-ad in prices), and to accounting return (ROE and fu-ture ROE), as well as verifying its effects on variations in share prices, these were the independent variables considered in this regression. Moreover, the constraint proxies were again used as controls. As a dependent variable, the NWCASS (net working capital per unit of total assets) variable was chosen to represent ma-rket liquidity, given its perfect correlation with cash balance. Quadratic cash balance was also considered as a control variable in this regression, together with working capital requirement.
Table 1 Operational description of the variables used in the study
Nº Name Variable Functional Form Reference
1 Dividend per Share DPS Dividends Paid Correia and Amaral
(2012)
Total outstanding shares (issued)
2 Income per Share IPS Net Income Assaf and Lima
(2009)
Total outstanding shares (issued)
3 Market-to-Book MTB Market Value =
Pricefech*Total
outstan-ding shares (issued) Gopalan et al.
(2012)
Accounting Value Net Equity
4 Book-to-Market BTM
Accounting Value =
Net Equity
Fama and French (1993), and Datar et al. (1998)
Market Value Pricefech*Total
outstan-ding shares (issued)
5 Market size MV_EQUITY ln (Market Value) = ln (Pricefech*Total
outs-tanding shares (issued)
Fama and French (1993), Pastor and Stambaugh (2001), and Amihud
(2002)
6 Return on Equity (ROE) ROE Net Income
Kania and Bacon (2005), Assaf and Lima (2009), Soares and Galdi (2011),
and Correia and Amaral (2012)
Net Equity
7 Turnover – Quantity of
Securities TURN_QS
Quantity of Securities Traded Demsetz (1968), Datar et al. (1998), Machado and Medeiros (2012), and
Correia and Amaral (2012)
Total outstanding shares (issued)
8 Turnover – Quantity of
Business TURN_QBUS
Quantity of business carried out Demsetz (1968), Chordia et al. (2000),
and Correia and Amaral (2012)
Total outstanding shares (issued)
9 Volume VOL ln (Volume of Business in R$)
Chordia et al. (2000), Minardi et al. (2005), Machado and Medeiros (2012), and Correia and Amaral (2012)
10 Spread SPREAD ln Own Elaboration
Price
maximum t
(
Price)
11 Accounting Size SIZE ln (Total Assets)
Beaver, Kettler, and Scholes (1970), and Oda, Yoshinaga, Okimura, and
Securato (2005)
12 Cost of Debt CSTER Financial Expenses Matarazzo
(2003)
Total ST Loans+Total LT Loans
13 Net Margin NETMAR Net Income Correia and Amaral
(2012)
Net Revenue (Sales)
14 Asset Turnover TURN Net Revenue (Sales) Matarazzo
(2003)
Total Assets
15 Self-funding SELFF Net Income+Depreciation-Dividends Paid Fleuriet et al.
(2003)
Total Assets
16 Dividend Payout DP DPS
IPS
Beaver et al. (1970), Oda et al. (2005) and Kania and Bacon (2005)
17 Dividend Yield DY DPS
Pricefech
Correia and Amaral (2012)
18 Net Working Capital NWCASS Net Working Capital Fleuriet et al.
(2003)
Total Assets
19 Working Capital
Require-ment WCRASS
Working Capital Requirement Fleuriet et al.
(2003)
Total Assets
20 Accounting Liquidity CBASS Cash Balance Fleuriet et al.
(2003)
Total Assets
21 Excess Accounting Liquidity CBASS2 Cash Balance Own Elaboration
Total Assets
22 Financial Leverage
Mul-tiplier FLM
Total Assets Soares and Galdi
(2011)
Net Equity
23 Variation in price VAR_PRICE ln Own Elaboration
24 Quality of Funding Dummy QFUN_D “IF” Function > ccthird = 1 (true) Own Elaboration
25 Market Risk BETA ,with: i=share;
m=market (IBOVESPA)
Sharpe (1964) Price
fecht
( )
Pricefecht-1
(
)
2EBIT Total Assets
Cov(i,m) Var(m)
Note. In the SPREAD variable the maximum value divided by the minimum share quotation was considered, since that way there would be positive values and the natural logarithm could be applied, with the intention of linearizing the measurement. The BETA variable used the returns from 60 months before the quarter of reference. The variables related to dividends, because they contained many missing values, were completed with the average for each share, with the aim of making better use of the database without fundamentally influencing the results obtained.
Table 2 Descriptive Statistics
Variable N Average Standard
Deviation Min. Max.
var_price 36832 -0.0270 0.7270 -2.9920 2.9820
beta 36832 -0.0220 0.1770 -2.8300 2.9710
betaf1 33369 -0.0220 0.1800 -2.8300 2.9710
size 36832 0.0130 0.9550 -2.9840 2.9970
mv_equity 36832 -0.0070 0.9090 -2.9150 2.9970
btm 36832 -0.0100 0.0000 -0.0350 0.0000
vol 36832 0.0010 0.9250 -2.9610 2.5970
qs _turn 36832 -0.0090 0.0010 -0.0090 0.2100
qbus_turn 36832 -0.0120 0.0910 -0.0360 2.2280
spread 36832 -0.3290 0.8420 -1.2730 2.9980
roe 36832 0.0290 0.2040 -2.9980 2.9880
netmar 36832 -0.0180 0.0810 -2.7330 2.1320
turn 36832 -0.2440 0.7230 -1.8740 2.9870
Table 2 Cont.
lm 36832 -0.0360 0.2120 -2.9230 2.9770
nwcass 36832 0.0320 0.1690 -2.9870 0.3220
wcrass 36832 0.0120 0.4730 -2.9720 2.9940
cbass 36832 0.0320 0.1680 -2.9880 0.3200
cbass2 36832 -0.0110 0.0420 -0.0140 2.5850
selff 36832 0.0140 0.1120 -2.8220 2.3040
ccthird 36832 -0.0400 0.1010 -2.1900 2.6930
Qfun_ d 36832 0.0000 1.0000 -0.3550 2.8130
dps 36832 -0.1020 0.0740 -0.2470 2.7770
dy 36832 -0.0950 0.0760 -0.4280 2.9870
dp 36832 -0.0530 0.0730 -2.7010 2.4390
Fernanda Finotti Cor
deir
o P
er
obelli, R
ubens F
amá & Luiz Claudio Sacr
amento
R. Cont. Fin. – USP
, São P
aulo, v
. 27, n. 71, p
. 259-272, mai./jun./jul./ago. 2016
var_price beta beta_f1 size equitymv_ btm mtb vol turn_qs turn_qbus bid bid_qs qbusbid_ roe roe_f1 netmar turn flm nwcass wcrass stat stat2 selff qfun_d ccthird dps dy dp
var_ price 1 beta 0.0111 1 beta_
f1 0.0031 0.1075 1 size 0.0414 0.1355 0.1203 1 mv_
equity 0.0474 0.1019 0.0907 0.4658 1 btm 0.0046 0.0047 0.0077 0.0435 0.0393 1 mtb -0.0171 -0.0009 0.0035 -0.0171 0.076 0.0007 1 vol 0.0592 0.2069 0.1745 0.5026 0.3456 0.0448 -0.0104 1 turn_
qs 0.0257 0.0158 0.012 0.0023 -0.0447 0.0599 -0.0017 0.0407 1 turn_
qbus 0.0086 0.1081 0.0886 0.1792 0.0039 0.0051 -0.0112 0.3775 0.078 1 bid 0.0801 0.165 0.1149 0.0833 0.0315 0.0155 0.0335 0.2186 0.0379 0.0969 1 bid_qs -0.0022 -0.0108 -0.0017 0.003 0.0855 0.0008 -0.0005 -0.0637 -0.0019 -0.0128 0.0358 1 bid_
qbus 0.0058 -0.0046 -0.003 0.0416 0.138 0.0019 0.0694 -0.1169 -0.0046 -0.0306 0.0851 0.3012 1 roe 0.0407 -0.0047 0.0001 0.0326 -0.0054 -0.004 -0.0736 0.0541 0.0023 0.0317 -0.0033 -0.0164 -0.0044 1
roe_f1 0.0261 0.0071 -0.0058 0.0252 0.0017 -0.0025 -0.0214 0.0394 0.0012 0.026 -0.0006 -0.02 -0.0065 0.0496 1
netmar 0.0147 -0.0042 -0.0112 0.0819 0.0524 0.0453 0.0007 0.0406 -0.0008 0.0258 -0.0178 0.0006 0.0016 0.0003 0.0006 1
turn 0.0189 -0.0364 -0.0372 -0.1274 -0.1112 0.0173 0.005 -0.0923 -0.004 -0.0283 -0.0456 0.0042 -0.0051 0.0176 0.005 0.011 1
lm -0.0045 -0.0183 -0.0008 0.0292 0.0276 0.0104 0.0626 -0.0374 -0.003 -0.0124 -0.0095 0.0061 0.0533 -0.4031 -0.0056 0.01 0.0544 1
nw-cass 0.0222 0.0174 0.0185 0.1788 0.1204 0.1738 0.007 0.0891 0.0011 0.0144 0.0052 0.0024 0.0067 -0.0177 -0.0064 0.3295 0.0129 0.0356 1 wcrass -0.0089 0.0066 0.0045 -0.0835 -0.0901 0.0469 -0.0141 0.0289 0.0079 0.0556 -0.0319 -0.0312 -0.0471 0.0098 -0.015 0.0552 0.1898 -0.0089 0.1276 1 stat 0.0222 0.0174 0.0183 0.1812 0.1223 0.1739 0.0073 0.0892 0.001 0.0133 0.0063 0.003 0.0076 -0.0177 -0.006 0.3304 0.0088 0.0357 0.9992 0.1082 1 stat2 -0.0128 0.0035 0.0058 -0.0966 -0.0534 -0.0356 -0.0026 -0.0241 -0.0002 -0.0094 0.0084 -0.003 -0.0067 0.0076 0.0029 -0.1827 -0.0198 -0.0194 -0.1629 -0.0359 -0.1633 1 selff 0.0337 0.014 0.0105 0.2016 0.0979 0.091 0.0018 0.0916 0.0016 0.0322 -0.0066 0.0016 0.004 -0.0039 0.0032 0.2175 0.0418 0.0321 0.5363 0.0854 0.5378 -0.3787 1
qfun_d 0.0444 0.041 0.0349 0.2035 0.0759 0.0002 0.0001 0.1629 -0.0018 0.0958 0.0123 -0.0092 -0.0135 0.072 0.0429 0.025 0.032 -0.0066 0.0383 0.0464 0.0376 -0.0071 0.0736 1
ccthird 0.0009 -0.0201 -0.0032 -0.0453 -0.0033 -0.0056 -0.0078 -0.0274 -0.0031 -0.0153 -0.0155 0.0008 -0.006 0.0056 -0.0061 -0.0084 0.0175 0.005 -0.0119 0.0018 -0.012 0.0138 -0.0309 -0.0474 1 dps 0.005 0.0105 0.0083 0.155 0.0216 0.0032 -0.0079 0.116 0.0015 0.1407 -0.0299 -0.009 -0.0214 0.05 0.0311 0.0234 0.0315 -0.0054 0.0248 0.0377 0.024 -0.01 0.0606 0.1108 -0.0125 1 dy -0.0025 0.0134 0.0103 0.1071 -0.0347 0.0084 -0.0074 0.0958 0.0076 0.1076 -0.0049 -0.0085 -0.0198 0.0369 0.0278 0.0233 0.0359 -0.0071 0.0263 0.0217 0.0258 -0.0093 0.0541 0.0856 -0.0126 0.4535 1 dp 0.0061 0.0155 0.0116 0.0897 0.0257 0.0018 -0.0046 0.0883 0.0011 0.0876 -0.0025 -0.0039 -0.0107 0.0174 0.0104 0.0099 0.0034 -0.0029 0.016 0.0215 0.0155 -0.0061 0.0283 0.0476 -0.0112 0.204 0.1861 1
3 RESULTS AND ANALYSES
As explained, four panel regressions were estima-ted for market risk/expecestima-ted return (dependent varia-ble = BETAF1); market liquidity (dependent variavaria-ble = QBUS_TURN); accounting return (dependent variable = ROEF1), and accounting liquidity (dependent variable = NWCASS). he Hausman test was then carried out, com-paring the ixed and random efects models and verifying the null hypothesis that there is no systematic diference in the coeicients generated by the two models (Wooldri-ge, 2010). In rejecting the null hypothesis, the use of ixed efects is admitted with the best estimator. All of the tests revealed the presence of ixed efects and these will be the results discussed. he time ixed-efects were also tested, which involved including a dummy variable for each year. However, the results were not afected and, for prudence, we kept only that related to 2008, due to the global cri-sis. Additionally, all of the regressions were estimated with cluster corrections related to the shares, which eliminates the efect of autocorrelation and heteroskedasticity in the panel estimation. he signiicant variables in each regres-sion are shown in Tables 4, 5, 6, and 7 and are discussed following each table.
coefficient four quarters ahead is negatively related to the variation in prices in the current quarter, which allows it to be used as a proxy for market risk/expec-ted return. Statistically, the regression revealed that a higher market risk/expected return was positively rela-ted to a higher volume of trading, turnover, and spread in prices for the assets in the sample and the period in question. Additionally, shares that exhibited higher ma-rket risk/expected return belonged to larger companies, but which paid fewer dividends per share. These shares performed worse in 2008. Thus, no hypotheses relating to market risk/expected return and firms’ accounting return and accounting liquidity (H2 and H5) were sup-ported. The positive relationship between market risk/ expected return and turnover, volume, and spread in prices indicates a negative premium for market liquidity in the Brazilian market, as already verified by Minardi et al. (2005).
Table 4 Regression 1 (Market risk/expected return)
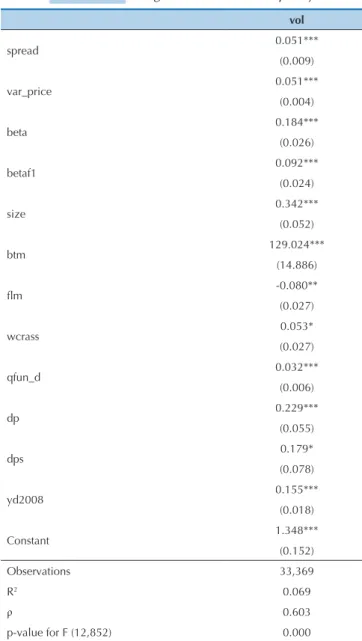
Table 5 Regression 2 (Market Liquidity)
betaf1
var_price -0.002
(0.001)
vol 0.011***
(0.003)
spread 0.009***
(0.002)
size 0.014**
(0.005)
dps -0.028*
(0. 012)
yd2008 -0.013***
(0.003)
Constant -0.021***
(0.001)
Observations 33,369
R2 0.004
ρ 0.116
p-value for F (6,852) 0.000
vol
spread 0.051***
(0.009)
var_price 0.051***
(0.004)
beta 0.184***
(0.026)
betaf1 0.092***
(0.024)
size 0.342***
(0.052)
btm 129.024***
(14.886)
lm -0.080**
(0.027)
wcrass 0.053*
(0.027)
qfun_d 0.032***
(0.006)
dp 0.229***
(0.055)
dps 0.179*
(0.078)
yd2008 0.155***
(0.018)
Constant 1.348***
(0.152)
Observations 33,369
R2 0.069
ρ 0.603
p-value for F (12,852) 0.000
According to the first regression of interest, there is an indication (despite not being statistically significant with fixed effects and correction for autocorrelation and heteroskedasticity, but significant in the estimations for minimum squares and for random effects) that the beta Note. Standard deviations in brackets.
* p < 0.05, ** p < 0.01, *** p < 0.001
Analyzing the regressions related to market liquidi-ty, it was observed that shares with higher turnover per unit of shares issued were of lower market value (scale factor), but also exhibited greater trading volume and higher spread in prices and belonged to companies with more assets. Because they had more assets, these compa-nies turned over less, were less in debt, and carried less net working capital, despite contracting loans at favora-ble rates and paying more dividends. he results indicate that inancially unconstrained companies are concerned. Again, it is veriied that these companies’ shares enjoyed greater market risk/expected return, generating a nega-tive premium for liquidity. he neganega-tive relationship be-tween market and accounting liquidity (NWCASS) sup-ports H6 in a context of no constraint. H4 (relationship between market liquidity and accounting return) cannot be conirmed.
Table 6 Regression 3 (Accounting Return)
Table 7 Regression 4 (Accounting Liquidity)
roef1
lm 0.026*
(0.012)
var_price 0.005**
(0.002)
qfun_d 0.005***
(0.001)
dps 0.032***
(0.009)
dy 0.017*
(0.007)
yd2008 0.012*
(0.005)
mtb -0.053*
(0.022)
wcrass -0.017**
(0.006)
Constant 0.034***
(0.001)
Observações 33,369
R2 0.003
ρ 0.107
p-value for F (8,852) 0.000
nwcass
netmar 0.075
(0.043)
lm 0.005*
(0.002)
wcrass 0.033**
(0.012)
selff 0.423***
(0.068)
ccthird 0.013
(0.008)
dps -0.030***
(0.009)
mtb 0.004***
(0.001)
Constant 0.024***
(0.002)
Observations 36,832
R2 0.113
ρ 0.372
p-value for F (7,871) 0.000
Note. Standard deviations in brackets. * p < 0.05, ** p < 0.01, *** p < 0.001
Note. Standard deviations in brackets. * p < 0.05, ** p < 0.01, *** p < 0.001
Observing the third regression, related to accoun-ting return (ROEF1), it can be verified that companies with higher accounting return 4 quarters ahead were those that held more self-funding, were more in debt,
captured favorable rates, paid more dividends, but were smaller (in total assets and market value) and faced fewer growth opportunities (lower MTB) in the period. In relation to the market variables, their assets expe-rienced greater variations in prices. Again, it appears that unconstrained companies are concerned, but with few growth opportunities. The hypotheses relating ROE to accounting liquidity (H3), to market liquidity (H4), and to market risk/expected return (H5) could not be confirmed.
In the fourth and last regression, related to accounting liquidity (NWCASS), it can be observed that companies that carried more net working capital in the period were those with more working capital requirement, but opted to hold excess liquidity (CBASS2), practicing more self--funding and fewer dividend payments. hey were also the ones that operated with higher margins (NETMAR). hese companies exhibited lower accounting returns and lower market liquidity, supporting H3 and H6. It is belie-ved that the irst order efect in this regression is not one of constraint, but of carrying excess liquidity. he hypo-thesis related to market risk/expected return (H2) cannot be conirmed.
4 FINAL REMARKS
As the first proposed aim, we sought to identify whe-ther more liquid shares exhibited lower market risk/
traded more and with a higher spread in prices, genera-ting a negative market liquidity premium in the sample and period considered, as in Minardi et al. (2005). These shares belonged to companies with more assets and with fewer dividend payments per share.
With regards to market liquidity, it was observed that shares with higher turnover in the period were those with a lower market value of shares (scale factor). These shares also exhibited a higher spread in prices and be-longed to companies with more assets. Because they had more assets, these companies turned over more, were less in debt, and carried more net working capital, des-pite contracting loans at favorable rates and paying more dividends. The results indicate that financially uncons-trained companies are concerned.
The second aim of this paper was to verify whe-ther carrying more liquid assets, or rawhe-ther, more ac-counting liquidity, would entail lower acac-counting re-turn, given that operational risk would decrease with a more conservative investment policy, or whether the presence of financial constraint would make this rela-tionship positive, as well as observing the breakdown of accounting measures regarding return and market liquidity indicators.
In Regression 3, it could be verified that higher future accounting return was observed in companies that held more self-funding, were more in debt, captured favora-ble rates, paid more dividends, but were smaller (in to-tal assets and market value) and faced fewer investment opportunities. In relation to the market variables, their assets experienced greater price variations. It appeared
that mature, unconstrained companies with fewer gro-wth opportunities were concerned. The accounting re-sults of these companies only generated effects on short term price variations, not having a relationship with ac-counting liquidity, with market liquidity, or with market risk/expected return.
Finally, in relation to accounting liquidity, it could be observed that companies that carried more net working capital in the period were those with more working capi-tal requirement, but also those that opted to hold excess liquidity, practicing more self-funding and fewer divi-dend payments. They were also those that operated with higher margins. These companies exhibited a lower ac-counting return and lower market liquidity. It is believed that both effects result from choosing excess accounting liquidity and not from potential financial constraints, supporting hypothesis H3 (negative relationship betwe-en accounting return and excess accounting liquidity) and H6 (negative relationship between market liquidity and excess accounting liquidity).
No relationship between market risk/expected re-turn and accounting rere-turn and liquidity could be es-tablished in the – still underdeveloped – Brazilian ma-rket, with investors preferring to trade shares in larger and less constrained companies enjoying a negative li-quidity premium.
Correspondence Address:
Fernanda Finotti Cordeiro Perobelli
Universidade Federal de Juiz de Fora, Faculdade de Economia Rua José Lourenço Kelmer, s/n – CEP: 36036-900
São Pedro – Juiz de Fora – MG
Email: [email protected]
References
Almeida, H., & Campello, M. (2010). Financing Frictions and the Substitution between Internal and External Funds. Journal of Financial and Quantitative Analysis, 45(03), 589-622.
Almeida, J., & Eid, W., Jr. (2014). Access to inance, working capital management and company value: evidences from Brazilian companies listed on BM&FBOVESPA. Journal of Business Research, 67(5), 924-934. Amihud, Y. (2002). Illiquidity and stock returns: cross-section and
time-series efects. Journal of Financial Markets, 5(1), 31-56.
Amihud, Y., & Mendelson, H. (1986). Asset pricing and the bid-ask spread. Journal of Finance Economics, 17(2), 223-249.
Amihud, Y., & Mendelson, H. (2000). he liquidity route to a lower cost of capital. Journal of Applied Corporate Finance, 12(4), 7-25.
Anderson, C., & Garcia-Feijoo, L, (2006). Empirical evidence on capital investment, growth options, and security returns. Journal of Finance, 61(1), 171–194.
Assaf, A. A., Neto, & Lima, F. G. (2009). Curso de administração inanceira. Atlas.
Baghiyan, F. (2013). Working capital management, investment and inancing constraints in companies listed on the Tehran, Iran stock exchange. International Journal of Business and Economics Research, 2(6), 130-133. Baños-Caballero, S. García-Teruel, P., & Martínez-Solano, P. (2013). Working
capital management, corporate performance and inancial constraints. Journal of Business Research, 67(3), 332-338.
Beaver, W., Kettler, P., & Scholes, M. (1970). he association between market determined and accounting determined risk measures. he Accounting Review, 45(4), 654-682.
Chan, R. (2010). Financial constraints, working capital and the dynamic
behavior of the irm. World Bank Policy Research. Working Paper,
(6797).
Chordia, T., Roll, R., & Subrahmanyam, A. (2000). Market liquidity and trading activity. Journal of Finance, 56(2), 501-530.
Chordia, T., Roll, R., & Subrahmanyam, A. (2007). Why Has Trading Volume Increased? Working Paper, University of California at Los Angeles. Chordia, T., Roll, R., & Subrahmanyam, A. (2011). Recent trends in trading
activity and market quality. Journal of Financial Economics, 101(2), 243-263.
Cooper, M., Gulen, H., & Schill, M. (2008). Asset growth and the cross-section of stock returns. Journal of Finance, 63(4), 1609–1651.
Correia, L. F., & Amaral, H. F. (2012). Determinantes da liquidez de mercado de ações negociadas na Bovespa. 12º Encontro brasileiro de inanças, São Paulo: SBFIN, Vol. 12, (pp. 1-39).
Datar, V. T., Naik, N. Y., & Radclife, R. (1998). Liquidity and stock returns: an alternative test. Journal of Financial Markets, 1(2), 203-219. Deloof, M. (2003). Does working capital management afect proitability
of Belgian irms? Journal of Business Finance and Accounting, 30(3–4), 573–587.
Demsetz, H. (1968, February). he cost of transaction. Quarterly Journal of Economics, 82, 33-53.
Diamond, D, & Verrecchia, R. (1991). Disclosure, liquidity, and the cost of capital. Journal of Finance, 46(4), 1325–1359.
Ding, S., Guariglia, A., & Knight, J. (2010). Investment and inancing constraints in China: does working capital management make a diference? Working paper, (521)
Eberhart, A., Maxwell, W., Siddique, A. (2004). An examination of long-term abnormal stock returns and operating performance following R&D increases. Journal of Finance, 59(2), 623-650.
Fairield, P., Whisenant, S., & Yohn, T. (2001). Accrued Earnings and Growth: Implications for Earnings Persistence and Market Mispricing. Working paper. Disponível em SSRN 249311.
Fama, E. F. (1970). Eicient Capital Markets: A review of theory an empirical work. he Journal of Finance, 25(2), 383-417.
Fama, E. F. (1991, December). Eicient capital markets: II. he Journal of Finance, 46(5), 1575-1617.
Fama, E. F., & French, K. R. (1993). Common risk factors in returns on stocks and bonds. Journal of Financial Economics, 33(1), 3-56. Fleuriet, M., Kehdy, R., & Blanc, G. (2003). A Dinâmica Financeira das
Empresas Brasileiras: um novo método de análise, orçamento e
planejamento inanceiro. Elsevier.
Foley, C., Hartzell, J., Titman, S., & Twite, G. (2007). Why do irms hold so much cash? A tax-based explanation. Journal of Financial Economics, 86(3), 579–607.
Gopalan, R., Kadan, O., & Pevzner, M. (2012, April). Asset liquidity and stock liquidity. Journal of Financial and Quantitative Analysis, 47(2), 333-364.
Hirigoyen, G. (1985). Rentabilité et solvabilité. Direction et Gestion, 3, 13-26. Hirshleifer, D., Hou, K., Teoh, S., & Zhang, W. (2004). Do investors overvalue
irms with bloated balance sheets? Journal of Accounting and Economics, 38, 297–331.
Howorth, C., & Westhead, P. (2003). he focus of working capital management in UK small irms. Management Accounting Research, 14(2), 94–111.
Kania, S. L., & Bacon, F. W. (2005). What factors motivate the corporate dividend decision. ASBBS E-Journal, 1(1), 97-107.
Keene, M. A., & Peterson, D. R. (2007). he importance of liquidity as a factor in asset pricing. Journal of Financial Research, 30(1), 91-109. Lazaridis, I., & Tryfonidis, D. (2006). he relationship between working
capital management and proitability of listed companies in the Athens Stock Exchange. Journal of Financial Management and Analysis, 19(1). Retrieved from http://ssrn.com/abstract=931591.
Machado, M. A. V., & de Medeiros, O. R. (2012). Existe o efeito liquidez no mercado acionário brasileiro?. BBR-Brazilian Business Review, 9(4), 28-51.
Matarazzo, D. C. (2003). Análise inanceira de balanços (p. 457). São Paulo: Atlas.
Minardi, A. M. A. F., Sanvicente, A. Z., & Monteiro, R. C. (2005). Spread de compra e venda no mercado acionário brasileiro, liquidez, assimetria de informação e prêmio por liquidez. In Anais do V Encontro Brasileiro de Finanças da Sociedade Brasileira de Finanças. V Encontro Brasileiro de Finanças, Rio de Janeiro.
Modigliani, F., & Miller, M. H. (1958). he cost of capital, corporation inance and the theory of investment. he American Economic Review, 48(3), 261-297.
Oda, A. L., Yoshinaga, C. E., Okimura, R. T., & Securato, J. R. (2005). Análise da relação entre indicadores contábeis e betas de mercado das empresas brasileiras negociadas na Bolsa de Valores de São Paulo no período 1995-2003. ENCONTRO ANUAL DA ANPAD, 29.
Pastor, L., & Stambaugh, R. F. (2001). Liquidity Risk and Expected Stock
Returns. CRSP Working Paper. n. 531. Retrieved from http://ssrn.com/
abstract=279804.
Pimentel, R. C. (2008). Dilema entre liquidez e rentabilidade: um estudo empírico em empresas brasileiras. In Anais..., XXXII ENANPAD, Rio de Janeiro. Retrieved from http://www.anpad.org.br/admin/pdf/ CON-A598.pdf.
Pimentel, R. C., & Lima, I. S. (2011). Relação trimestral de longo prazo entre indicadores de liquidez e de rentabilidade: evidência de empresas do setor têxtil. Revista de Administração (FEA-USP), 46(3), 275-289. Rösch, D. M., Subrahmanyan, A., & Dijk, M. A. van. (2013). Is here
Systematic Variation in Market Eiciency? Retrieved from http://subra.
x10host.com/cef6.pdf.
Sharpe, W. F. (1964). Capital asset prices: a theory of market equilibrium under conditions of risk. he Journal of Finance, 19(3), 425–442. Soares, E. R., & Galdi, F. C. (2011). Relação dos modelos DuPont com o
retorno das ações no mercado brasileiro. Revista Contabilidade & Finanças, 22(57), 279-298.
Vieira, R. S. (2010). he relationship between liquidity and proitability: An explanatory study of airline companies between 2005 and 2008. (Dissertação de Mestrado), Umea Universitet, Umea, Suécia. Retrieved from http://202.154.59.182/ejournal/iles/he%20relationship%20 between%20liquidity%20and%20proitability.pdf.
Walker, E. W. (1964). Toward a theory of working capital. he Engineering Economist: A Journal Devoted to the Problems of Capital Investment, 9(2), 21-35.