A Work Project, presented as part of the requirements for the Award of a Master’s degree in Finance from the NOVA School of Business and Economics.
M&A VALUE CREATION IN FAMILY BUSINESSES:
EVALUATING THE IMPACT OF MACROECONOMIC
EVENTS AND QUALITY OF INSTITUTIONS
OVER TIME
GONÇALO TAVARES DA SILVA MARQUES
#25963
Work project carried out under the supervision of: Professor IREM DEMIRCI
1
M&A VALUE CREATION IN FAMILY BUSINESSES:
EVALUATING THE IMPACT OF MACROECONOMIC
EVENTS AND QUALITY OF INSTITUTIONS
OVER TIME
GONÇALO TAVARES DA SILVA MARQUES
Abstract
This paper investigates how family ownership, control and management influence market reaction to M&A, both under different economic conditions and under distinct institutional backgrounds. Using a database of 381 acquisitions, performed by firms from 11 European and North American countries between 2005-2015, I conclude, through univariate and multivariate analyses, that family firm resilience is not observed in M&A, with acquisitions being perceived as opportunistic in bad times. On the contrary, I observe that family firms significantly outperform their non-family peers in good times and that shareholder protection is a key determinant of M&A value when acquirors have distinct ownership structures.
Key Words: Family Business, Mergers and Acquisitions, Economic Cycles, Institutional Environment
2
1. Introduction
Mergers and acquisitions (M&A) are integral components of corporate strategy. Companies often engage in deals with a common goal – to increase shareholder wealth. However, in practice, acquiring firms do not necessarily create value with M&A transactions (Jensen and Ruback 1983) and there is even evidence of acquiror value destruction in the period around announcement date (Andrade, Mitchell and Stafford 2001).
Such results can be partly explained by the underlying motivation for M&A. Literature suggests that firms pursue transactions based on different factors, namely capturing synergies to increase market power (Seth, Song and Pettit 2002), equity overvaluation of the acquiring firm (Shleifer and Vishny 2001), managerial hubris (Roll 1986), etc. Other important aspect is the propensity to engage in negotiations. Industry characteristics naturally influence M&A propensity. On the other hand, ownership structure, and, more specifically, family control also have a significant impact on both the probability of pursuing takeovers and on their respective success.
Family firms are substantially different from non-family firms, either in strategic orientation or in terms of value and performance. According to Berrone, et al. (2012), socioemotional wealth (SEW) plays a major role in family businesses (FB). In fact, in FB exist duality of goals, meaning that not only financial goals matter, but also non-financial goals like continuity, reputation and influence are relevant for family shareholders. SEW denotes the benefits that family members extract from these non-economic aspects. Then, family owners are SEW-loss averse rather than only risk-averse, framing actions in terms of how they will impact SEW (Gomez-Mejia, et al. 2011). Therefore, FB valuation results from the combination of the explicit financial value with the socioemotional value entrenched in the SEW.
Several other theories (e.g. agency theory, stewardship theory, resource-based view of a company) reinforce the contrast between family and non-family firm performance. Hence, and
3
given the contribution of M&A to the overall performance of the firm, one can expect M&A value creation to be significantly different between family and non-family firms. Taking this into account, some authors have investigated the relationship between these two variables. Ben-Amar and André (2006) studied M&A performance of Canadian FB between 1998 and 2002. Bouzgarrou and Navatte (2013) investigated the role of family control in acquisitions of French firms between 1997 and 2006. Feito-Ruiz and Menendez-Requejo (2010) and Caprio, et al. (2011) developed similar studies for the periods 2002-2004 and 1998-2008, but focusing in large European countries, rather than in a single geography. Unfortunately, there is a lack of consensus in the literature (Worek 2017), with findings ranging from FB outperforming their non-FB counterparts to evidence of value destruction when FB acquire other firms. One possible explanation for the issue might be the definition of FB employed by authors. As suggested by Villalonga and Amit (2006), value discount or premium is influenced by the way researchers incorporate family ownership, control and management into the notion of FB. Note as well that, to evaluate the impact of ownership on acquiror performance, most authors elected to control, mainly, for transaction and firm-wide characteristics. With the exception of the investigations conducted by Ben-Amar and André (2006) and Feito-Ruiz and Menendez-Requejo (2010), research tended to ignore the impact of external conditions on FB performance in M&A. Furthermore, researchers mostly evaluated performance with the commonly accepted short-term event study methodology. However, as Zollo and Meier (2007) point out, short-term performance does not accurately reflect creation of economic value. Instead, it corresponds to the “collective bet” of the market at the moment of the announcement of the deal.
Considering this, it makes sense to develop a new methodology which does not exclusively rely on transaction and firm specificities, but that also accounts for the impact of easily identifiable factors, external to deals, such as economic conditions and institutional quality within a country. This is precisely the purpose of my study: to examine how economic cycles and the mechanisms
4
associated to distinct legal systems shape the market reaction to the announcement of acquisitions by family-controlled firms vis-à-vis non-family firms.
In addition to this, I observed that comparable studies tend to focus on M&A that occurred before the 2008 financial crisis. Researchers systematically ignored adverse economic conditions to study M&A activity of FB in normal times. Thus, I provide a fresh take on the literature by studying acquisitions that were announced between 2005 and 2015, either in large European countries or in North America. This way, I am able to test if family firms earn positive and significant abnormal returns with acquisitions and if, in fact, FB are more resilient than non-FB, as suggested by Kachaner, et al. (2012).
Hence, using a sample of 381 deals performed by acquirors of 11 countries, I concluded that, on average, acquisitions produced a positive ex-ante market reaction. Furthermore, I found that whereas in economic downturns FB significantly underperform against non-FB, and even destroy short-term value, in good times family firm shareholders tend to earn positive and significant returns, higher than those generated by non-FB. Finally, I found evidence that the institutional framework significantly influences market reaction to M&A, as, in fact, there is a positive relation between the level of shareholder protection and acquiring firm returns.
That being said, this paper is organised in the following way. In section 2, I review the relevant literature and define the hypotheses of the study. In section 3, I describe the methodology and justify the choice of variables. Then, in section 4, I present and analyse results and lastly, in section 5, I provide a conclusion, discuss limitations and offer suggestions for future research.
2. Literature Review
(i) FB vs Non-FB firm performance
Over the years, many theories were developed to explain the differences between family and non-family firms. One of the earliest and more successful is the three-circle model, proposed
5
by Davis and Tagiuri (1989). The authors suggest that the behaviour of family firms results from the interaction between agents that have different stances regarding to family, ownership and management – with the three systems being independent but overlapping. Hence, it is the overlap between systems and the existence of blurred boundaries that can lead to either a better global performance of FB or, instead, to underperformance against non-FB.
Note that, on one hand, researchers found evidence of higher performance associated with family ownership (Anderson and Reeb 2003). James (1999) defended that the long-term orientation of FB, which takes into consideration continuity, family ties, loyalty, insurance and stability, reduces the agency costs that arise when ownership and control are divided. Moreover, SEW preservation combined with the unique set of resources that result from the family involvement in the firm – “familiness” (Habbershon and Williams 1999) – help to explain the “competitive advantage” of FB.
On the other hand, researchers also found contradictory evidence concerning FB and agency costs. Instead of a theoretically natural alignment between managers and owners that minimizes agency costs, empirical studies discovered that factors such as adverse selection, executive entrenchment and goal incongruity undermine FB performance. For example, Claessens, et al. (2002) found that the entrenchment effect in FB, which implies the pursuit of private benefits by family owners to the detriment of minority shareholders, increases with the level of control and is responsible for destroying firm value. Additionally, Johnson, et al. (2000) indicated tunneling as another factor responsible for lower FB performance.
Looking now to M&A, findings are once again non-consensual for FB. The same arguments used in favor of better or worse FB performance are also used to explain M&A results. Feito-Ruiz and Menendez-Requejo (2010) coined the terms “family firm efficiency” and “family firm opportunism” to describe the two positions. Given this, I aim to test the following hypotheses:
6
H 1.1: Family firms generate a positive market reaction when they acquire other businesses. H 1.2: FB significantly outperform their non-family peers when engaging in acquisitions.
(ii) Good times vs Bad times
Andrade, et al. (2001) suggest that mergers occur in waves, and that they tend to cluster by industry within the same wave. The authors elaborate that differences in M&A activity between industries can be attributed to industry-level shocks. These shocks have an unexpected nature and can range from technological innovations to deregulation and economic shocks. One example is the 1970s oil price shocks that served as a lever for the 1980s M&A wave. Then, large economic shocks create imbalances, which will be explored through M&A.
In this study, I evaluate the impact of two concrete shocks: the 2008 financial crisis, with an immediate impact over the US economy and a lagged effect over European economies, and the European sovereign debt crisis, with its ramifications especially in Mediterranean countries. Existing literature suggests that the 2008 global financial crisis negatively affected both the number of transactions and deal values (Reddy, Nangia and Agrawal 2014). Regarding to value creation, Rao-Nicholson and Salaber (2014) noted that short-term performance of acquirors was significantly higher in the post-crisis (bad times) than before the shock (good times). The authors attributed such results to a combination of factors that predominate in periods after crises, particularly, target firm devaluation and stock market crash, that reduce the purchase price (Wan and Yiu 2009), and more objective and accelerated corporate agendas, that envision quick restructurings and, hence, reduce agency costs and increase acquiror return (Campello, Graham and Harvey 2010). So, I will test Rao-Nicholson and Salaber findings that:
H 2.1: Firms are more efficient at exploring market imperfections through M&A in bad times.
Considering now the presence of family control, literature suggests that FB should have a more robust performance than non-FB during crisis. Kachaner, et al. (2012) found that family firms
7
outperformed their non-family peers in recessions, even though the same might not hold for good times. The researchers found that, across business cycles from 1997-2009, average long-term financial performance was superior for FB, illustrating that FB strategy is centred more around resilience rather than performance. Given so, I will test if the same contrast between FB and non-FB during economic downturns also holds when analysing M&A performance: H 2.2: In bad times, FB acquirors outperform non-FB acquirors.
(iii) Impact of the Legal System and Institutional Framework
In their 1998 study, La Porta, et al. (1998) argued that the value of securities is intrinsically connected to the legal rules of the correspondent jurisdiction where they are issued. The authors suggested, likewise, that Law and its enforcement are key determinants of the protection mechanisms that creditors and shareholders have in each country.
Taking this into consideration, the authors proceeded to identify the differences in legal rules between countries and found that these can be organized according to their legal family in Common Law (English-origin) and Civil Law countries. Civil Law countries could be further divided in three subsets, based on their respective origins, as: German-civil-law, French-civil-law and Scandinavian-civil-French-civil-law countries. La Porta, et al. (1998) then concluded that Common Law rules provide stronger legal rights to investors than civil laws, and that, within Civil Law, French-civil-law countries are the ones with the weakest shareholder and creditor protections. Furthermore, the study also highlighted the negative relation between the degree of concentration of ownership in a firm and the level of investor protection, suggesting that the influence of minority shareholders in firm-wide decision making tends to be irrelevant in countries that do not offer appropriate protection. Under such conditions, family shareholders that hold the control of the business have increased incentives to pursuit private benefits. This is consistent with the “family firm opportunism” hypothesis proposed by Feito-Ruiz and
8
Menendez-Requejo (2010). Therefore, with H 3.1, I will test if, in countries with weak investor protection, FB use M&A to create value or, instead, to satisfy family owners’ desires.
H 3.1: Family-controlled firms from countries with weak shareholder protection destroy value when they acquire other firms and are outperformed by non-FB acquirors.
Conversely, if the latter does not hold, I am interested in assessing if the better performance of FB described by Anderson and Reeb (2003) also extends to M&A, independently of the quality of the legal system of the country of origin of the family firm – hypothesis H 3.2.
3. Data and Methodology (i) Sample Selection
The data set used in this study consists of M&A events in which the acquiring firm is publicly listed in at least one of a group of 11 countries (9 European countries, USA and Canada). M&A data was extracted from the Thomson Reuters’ SDC Platinum Mergers & Acquisitions Database, whereas historical stock performance was obtained from the Bloomberg database.
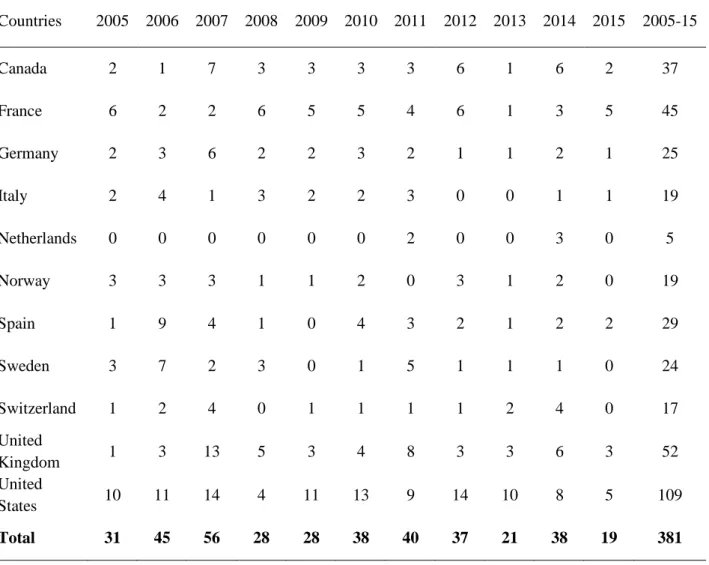
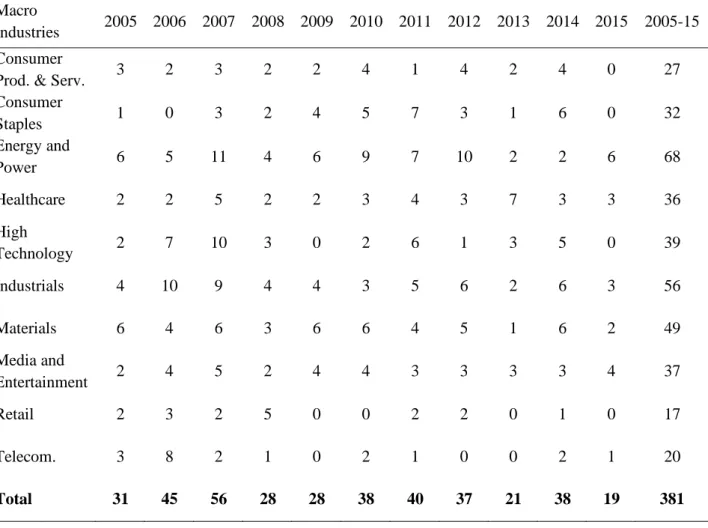
The sample selection process was based on the following criteria: (i) only deals that were announced between 2005 and 2015 are considered; (ii) deals correspond exclusively to acquisitions of majority interest – ignoring mergers and other operations allows to control for the entry of new shareholders that can disrupt family continuity and dynamics; (iii) deal status must be completed and companies that engage in several deals are included; (iv) only acquirors with market value greater than USD 250 million are considered; (v) transaction value must be available and greater than USD 10 million, otherwise the deal is disregarded; (vi) only non-financial acquirors were considered. The final sample comprises 381 deals, worth USD 74.5 billion (Table 1), performed by 303 companies, distributed over 10 industries (Tables 2 and 3).
9 (ii) Variables
(a) Dependent Variable
Over the last decades, researchers used different methods to assess the impact of M&A on corporate performance. Schoenberg (2006) categorized studies according to four main measures: i) cumulative abnormal returns (CAR), ii) managers’ assessments, iii) divestment data and iv) expert informants’ assessments. Traditionally, researchers favoured event studies (Zollo and Meier 2007). However, within event studies, there is a large contrast between short- and long-term windows, as authors discovered that measuring performance in different horizons can lead to opposite outcomes. Zollo and Meier (2007) then referred to this dichotomy as the distinction between ex-ante market expectations and the ex-post realization – with the latter being a product of the knowledge that has formed throughout the integration process. Andrade, et al. (2001) suggest that, ideally, in an efficient capital market, stock prices should adjust very rapidly to an unexpected event, thus, incorporating the changes in expected value from the acquisition announcement. Nonetheless, in practice, ex-ante returns rely on a limited set of information, which precludes important aspects that may affect long-term realization of value (Zollo and Meier 2007). Hence, researchers found evidence of negative long-term returns, that rectify positive ex-ante returns – illustrating the failure to measure the economic impact of complex strategic choices with short-term windows (Oler, Harrison and Allen 2008). Despite these concerns, ultimately, I opted for a short-term event study approach. Such methodology allows me to control for the presence of high-magnitude and prolonged economic shocks within the sample. Moreover, longer horizons include other events besides the acquisition, making it difficult to isolate the share of returns attributable to the event of reference.
Given this, I used the commonly accepted methodology proposed by Brown and Warner (1985) to detect abnormal performance at announcement. Following the authors, I used samples of 250 daily return observations, one for each stock, starting at 244 days before the announcement
10
(-244) and ending 5 days after the announcement (+5). Similar to Brown and Warner, the considered estimation period is (-244,-6). However, for the event period, I tested several CARs, constructed with different windows, to attain the one that better reflects the “collective bet” of the market (Zollo and Meier 2007). Note that for daily data, Brown and Warner propose three alternatives to estimate CARs: i) mean-adjusted returns, ii) market-adjusted returns and iii) OLS market model. In general, the three methods yield similar results, but the OLS tends to perform better, as highlighted by Dyckman, et al. (1984). CARs were then computed with the formula: (1) 𝐶𝐴𝑅 = 𝑅𝑖,𝑡− (𝛼̂ + 𝛽𝑖 ̂ 𝑅𝑖 𝑚,𝑡)
In equation (1), 𝑅𝑖,𝑡 represents the realized return for security i at day t and 𝑅𝑚,𝑡 denotes the market return at day t. Coefficients 𝛼̂ and 𝛽𝑖 ̂ correspond to the OLS estimators for the period 𝑖 (-244,-6). One final remark has to do with the choice of the market index. Instead of adopting a generalized index (e.g. MSCI World Index), I used a domestic benchmark for each stock. Note that, between 2005-2015, systematic risk was significantly different across countries, especially, during economic downturns. Therefore, by adjusting returns for countrywide risk with domestic benchmarks, I am able to estimate CARs with higher precision and, simultaneously, reduce the need for additional control variables.
(b) Independent Variables Family Business (FB)
FB is a dummy variable that accounts for family control and management within a firm. Note that authors often disagree on the extent of the FB definition. Bouzgarrou and Navatte (2013) consider that a firm is a FB when the family controls more than 51% of the voting rights or its voting rights are more than the double of the next largest shareholder. Alternatively, André and Ben-Amar (2014) consider 10% as the minimum threshold for family control. Despite that, researchers commonly overweigh ownership and tend to ignore that, in several cases, families
11
are not actively engaged in management. Hence, I used a more conservative approach to define FB, consistent with three-circle model: a FB is a synthesis of ownership control and strategic influence in management by family members, that are concerned with family relationships and value continuity across generations (Poza 2010).
Good Times (GOODTIMES)
I defined Good Times as a variable representative of periods of economic expansion. Good Times is a dummy variable that takes the value 0 when the domestic economy is in a recessive cycle (bad times) and 1 otherwise. Good Times is positively correlated with GDP growth. However, the variable is less restrictive than GDP growth as, in fact, a cycle of contraction does not correspond exclusively to the year of decline in production. Usually, it includes following months or years, as consumer and market confidence respond slowly to high magnitude crises. English, French, German, Scandinavian (ENGLISH, FRENCH, GERMAN, SCANDINAVIAN)
The four variables are dummies aimed at studying the impact of different institutional backgrounds on the market reaction to M&A. Each variable denotes the origin of the legal system of the country where the acquiring firm is based. Countries were grouped following the methodology proposed by La Porta, et al. (1998). Hence, English denotes Common Law countries and includes Canada, the UK and the USA. The other three correspond to Civil Law based legal systems. Scandinavian includes Norway and Sweden. German comprises Germany and Switzerland, and, lastly, French includes France, Italy, the Netherlands and Spain.
Accounting Standards (ACCOUNTSTAND)
Accounting Standards corresponds to the index constructed by La Porta, et al. (1998) that measures the quality of accounting practices in each country, based on the information provided by companies in their annual reports. Hay, et al. (1996) suggest that law enforcement might be severely limited by the lack of quality accounting methods. In fact, the authors defend that weak
12
accounting standards, which coexist with poor institutions, create non-verifiability of future states, thus compromising the quality of contracts. Considering this, I decided to use the rating of Accounting Standards to measure the quality of the legal enforcement in each country. (c) Control Variables
Deal Value (DV)
DV controls for the size of the transaction. It serves as a proxy for target firm size, as several firms included in the sample are private or subsidiaries of the acquirors, thus not displaying a market value. DV is then presented as the logarithm of the reported deal value (in USD million). Ratio Deal Value-Acquiring Firm Market Value (RATDVAMV)
The variable RATDVAMV measures the relative size of deal, in terms of the acquiror market value. Literature suggests a positive relation between acquiring firm return and target size, implying that larger targets generate greater returns (Fuller, Netter and Stegemoller 2002) (Jarrell and Poulsen 1989). Therefore, acknowledging the positive correlation between deal and target size, I expect RATDVAMV to impact positively acquiring firm returns.
Target Status – Listed (TPUBLIC)
Fuller, et al. (2002) analysed shareholder returns for companies that consistently engage in acquisitions and found evidence of bidder value destruction when public targets are acquired. Evidence that acquisitions of private targets generate gains for acquiring firm shareholders is corroborated by Chang (1998) and Conn, et al. (2005). Considering this, I created a control variable – TPUBLIC – which takes the value 1 if the target is publicly listed and 0 otherwise. Cross-Border (CROSSBORDER)
Cross-Border is a dummy variable that takes the value 1 when the bidder acquires a foreign target and 0 when the acquisition occurs within the same country. Overall, cross-border
13
acquisitions tend to generate positive returns. However, there is not consensus on the magnitude of returns. Conn, et al. (2005) found that, for UK firms, cross-border acquisitions generated lower announcement-period and long-run returns. Conversely, other studies found evidence of higher CARs associated with cross-border acquisitions (Faccio, McConnell and Stolin 2006).
4. Results and Discussion (i) Sample Description
From 2005 to 2015, the 303 firms comprised in the sample were responsible for spending more than USD 74 billion in acquisitions of majority interest, accounting for an average transaction value of USD 195.6 million (Table 1). Note, however, that the mean value and the number of transactions did not distribute equally over time. In fact, there is a USD 57.7 million gap between the minimum (2010) and the maximum (2015) average annual deal values. Furthermore, whereas in 2007 there are 58 observed transactions, in 2015 only 19 deals were registered. Then, an important conclusion from Table 1 is that years with simultaneously lower total expenditure and weaker M&A activity generally coincided with economic downturns. This is consistent with Reddy, et al. (2014) findings for the 2008 financial crisis.
Considering now the separation between FB and non-FB, only 87 of the deals contained in the sample (23%) were performed by family-controlled firms. This reduced number of deals is consistent with the lower propensity of FB to make acquisitions, as reported by Caprio, et al. (2011). Family firms are not exclusively profit- and results-driven. Instead, they value employee and customer loyalty, stability and continuity across generations (James 1999), which mitigate the ambition to grow faster and inorganically through M&A.
(ii) Event Study
The first step in this study was to estimate CARs and assess their validity. Following a simple OLS market model, I obtained the expected returns, and then computed excess returns as the
14
difference between realized and expected return (Equation 1). The output consisted of 381 samples, one for each deal, of 250 daily excess returns.
To verify the properties of the distributions of excess returns in the estimation window, Brown and Warner (1985) propose two methods to aggregate the data. On one hand, the authors suggest using the mean value of 381 test statistics, while on the other, they propose using a full sample of 239 average daily excess returns and to derive the results from this distribution. Note that, for the first case, the average standard deviation is 0.01718, much above 0.00097, obtained with the second method. Furthermore, the first construct yields an average kurtosis of 6.69 in excess of a normal distribution, whereas with the second method the distribution of excess returns approximates to a normal distribution (Table 4). Additionally, the skewness coefficient is less pronounced for the second case as well (-0.17 vs 0.30). These results are consistent with the Central Limit Theorem, as, in fact, using cross-sectional mean excess returns reduces deviations to normality. Similarly to Brown and Warner (1985), I assumed cross-sectional independence between daily returns. So, considering this, I based my analyses on the distribution of the daily 250 mean excess returns.
Besides the possibility of non-normality (excluded), Brown and Warner (1985) indicated other factors that could affect estimation and inference of CARs. First, the authors suggested that non-synchronous trading might influence parameter estimation, specifically creating serial dependence between observations and making estimators biased and inconsistent. Note that non-synchronous trading is related with the trading frequency of the security. Hence, using only stocks of public and relatively large companies (market cap > USD 250 million) allows to control for the presence of downward bias in β estimates of less frequently traded stocks. Moreover, Brown and Warner found that not acknowledging non-synchronous trading does not create misspecifications of the OLS market model for this type of studies.
15
Other issue pointed by Brown and Warner (1985) was serial autocorrelation. Whereas autocorrelation does not impact unbiasedness and consistency, it affects efficiency of the β estimator and, consequently, any inference. Given so, I ran Durbin-Watson (DW) tests for each of the 381 samples of daily expected returns, with each sample corresponding to a stock. At the 1% significance level, the critical values for the test are dL=1.664 and dU=1.684, meaning that if the DW statistic is above the dU threshold I do not reject the null hypothesis H0: no serial
autocorrelation. Then, from the 381 individual stock samples, I rejected H0 for only 5 stocks
and the DW statistic fell in the uncertainty interval (between dL and dU) for 1 stock. The mean DW statistic of the 381 stocks was 2.06. Thus, I found no evidence that error terms were, in general, linearly dependent on the previous period error term. Therefore, I found no need to correct estimators neither for non-synchronous trading nor for serial autocorrelation.
After acknowledging possible problems with the estimation, I, then, proceeded to analyse results. At this point, event study inference centred in evaluating whether abnormal returns around announcement date were statistically significant or not. For this purpose, Brown and Warner proposed the application of a simple t-statistic aimed at rejecting the null hypothesis H0: no abnormal performance in the event period. The t-stat was computed as the ratio between
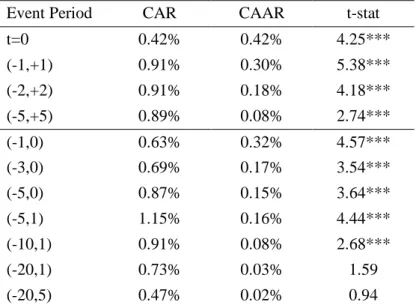
the cumulative average abnormal return (CAAR) and the estimated daily standard deviation. Results for the overall sample are detailed in Table 5. Note that there is no clear indication in the literature that one short-term window is better at capturing abnormal performance than another. Hence, I analysed significance for several ranges, some centred around t=0 (announcement day), and others rather capturing pre-event performance, e.g. (-10,+1).
In general, I found evidence that shareholders of acquiring firms earn positive and significant (at the 1% level) abnormal returns with the announcement of the acquisition. The only exceptions were the windows (-20,+1) and (-20,+5), whose returns despite positive were insignificant. More specifically, I found that market reaction was, on average, 0.42% upon
16
announcement, between 2005 and 2015 (Table 5). This evidence corroborates the hypothesis of short-term shareholder value creation by acquiring firms, demonstrated by the findings of Faccio, et al. (2006) and Moeller, et al. (2004). Additionally, I found that cumulative performance more than doubled if the window expands to include 1 day, 2 days or 5 days before and after the announcement date (Table 5). However, despite cumulative performance increasing with the number of days of the event window, CAARs were higher for shorter windows centred around t=0 (e.g. 𝐶𝐴𝐴𝑅𝑡=0= 0.42%, 𝐶𝐴𝐴𝑅(−1,+1) = 0.30%, whereas 𝐶𝐴𝐴𝑅(−5,+5) = 0.08% and 𝐶𝐴𝐴𝑅(−20,+1) = 0.03%). Note that CAARs were also more significant in these windows, as illustrated by t-stats (𝑡 − 𝑠𝑡𝑎𝑡𝑡=0 = 4.25, 𝑡 − 𝑠𝑡𝑎𝑡(−1,+1) =
5.38 vs. 𝑡 − 𝑠𝑡𝑎𝑡(−5,+5) = 2.74 and 𝑡 − 𝑠𝑡𝑎𝑡(−10,+1) = 2.68). Hence, I decided to focus in the cumulative performance measure for the period (-1,+1) – later referred to as 3-day CAR. The fact that comparable studies used the same measure of ex-ante returns also weighed in the choice of the 3-day CAR as the dependent variable for my multivariate analysis.
(iii) Family Control and Acquiring Firm Performance
After separating firms according to family ownership and control, I noticed that the positive ex-ante market reaction persisted when FB announced acquisitions of majority interest. Between 2005 and 2015, family firm shareholders earned, on average, 0.76% and 0.87%, on a cumulative basis, in the 3-day and 5-day windows centred around t=0, respectively (Table 6). Such results validate the hypothesis H 1.1 and are, therefore, aligned with the findings of shareholder value creation for FB acquirors reported by Ben-Amar and André (2006) for Canadian family firms (3-day CAR = 2.1%), by Bouzgarrou, and Navatte. (2013) for French FB (3-day CAR = 1.01%) and by Feito-Ruiz and Menendez-Requejo (2010) for European FB (CAAR = 1.38%). Nonetheless, I observed that the market reaction was mostly flat at announcement date for FB (𝐶𝐴𝑅𝑡=0 = 0.02%) and that the short-term value gained with the acquisition tended to disappear as the length of the cumulative performance window increased (Table 6). Hence,
17
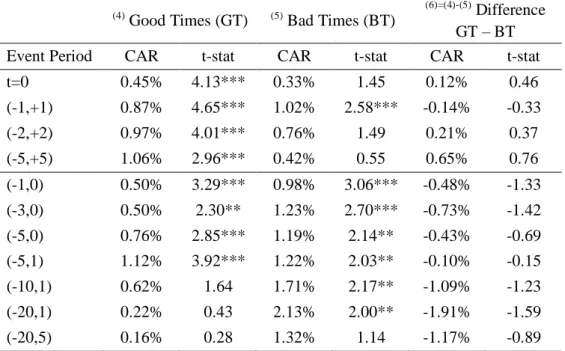
despite positive, CARs tended to be insignificant for most windows. Exceptions were (-1,+1) and (-2,+2) CARs, which materialized as significant at the 95% and 90% level, respectively. Looking now to non-family firms, shareholders earned positive and broadly significant returns (at least at the 5% significance level). 3-day CAR totalled 0.96% and shareholders accumulated, on average, more than 1% of abnormal return in periods longer than 5 days (exception is the (-20,+5) window). Furthermore, non-FB performed significantly better at announcement date than FB, generating, on average, 0.51% more return to their shareholders than family firms (Table 6). Generally, the ex-ante market reaction to acquisitions was much superior for non-FB than for FB. Hence, and despite the difference between CARs not being significant for most windows, the obtained results provide strong evidence that FB underperform against non-family firms. Given so, my results contradict the findings of some comparable studies, that FB acquirors significantly outperform their non-family peers. Thus, hypothesis H 1.2 does not hold, at least for the whole period 2005-2015. Note that, even though, on average, FB created value with acquisitions, underperformance might result from suboptimal investments, as suggested by Feito-Ruiz and Menendez-Requejo (2010) or, instead, be the product of different market and investor sentiment towards FB-led acquisitions under distinct economic conditions. (iv) Family Control and Acquiring Firm Performance under Distinct Economic Conditions Literature suggests that economic cycles have a considerable impact on M&A, either in terms of the propensity to engage in deals or concerning value creation. Table 7 presents acquiror performance metrics under different macroeconomic scenarios: Good Times and Bad Times. Overall, performance was positive under both scenarios, meaning that, on average, firms were able to generate positive ex-ante returns with acquisitions, regardless of economic conditions. First, in Good Times, abnormal return at t=0 reached an average value of 0.45% and it increased gradually as the event window expanded (e.g. 𝐶𝐴𝑅(−1,+1) = 0.87%, 𝐶𝐴𝑅(−5,+5) = 1.06%).
18
CARs were significant for most windows and one can conclude, from Table 7, that cumulative performance in Good Times was mostly driven by the excess returns obtained in the days following the announcement. Then, in Bad Times, the abnormal return at t=0 was slightly lower, with an average value of 0.33%. Contrasting with Good Times, asymmetric window CARs, that capture mainly pre-event performance, were substantially higher in Bad Times, suggesting that pre-announcement performance is an important driver of short-run shareholder value during economic downturns. The 3-day CAR was, on average, 1.02%, 14 basis points higher than in Good Times. However, the remaining symmetric window CARs, centred around t=0, were lower in Bad Times. Despite that, differences between CARs in Good Times and Bad Times were not statistically significant in none of the windows, further implying that, with the univariate analysis, there is not enough evidence to either support or reject hypothesis H 2.1. Tables 8 and 9 present detailed results for Good Times and Bad Times, respectively, with the proper separation of firms in FB and non-FB. At this level of disaggregation, there were sharp differences between the two types of acquirors.
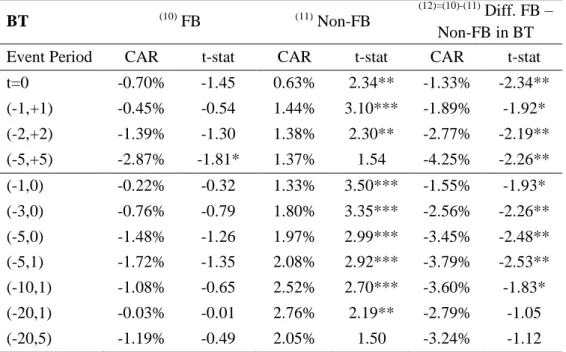
In Bad Times, whereas non-FB shareholders earned positive and significant CARs (e.g. 𝐶𝐴𝑅(−1,+1) = 1.44%), FB acquisitions destroyed shareholder value, illustrated by the negative CARs for all short-term windows, e.g. 𝐶𝐴𝑅(−5,+5) = −2.87% (Table 8). Hence, not only non-FB outperformed significantly non-FB in Bad Times, but there is also evidence that the market reacts negatively to the announcement of acquisitions by FB, suggesting, for example, that it expects family owners to extract private benefits from the acquired firm to the detriment of other shareholders’ interests, or that, simply, FB overpay for their targets. Therefore, I rejected the hypothesis H 2.2 based on the findings of this partial analysis. On the other hand, in Good Times, both FB and non-FB shareholders earned positive and vastly significant returns with acquisitions (Table 9). On average, under favourable economic conditions, FB even
19
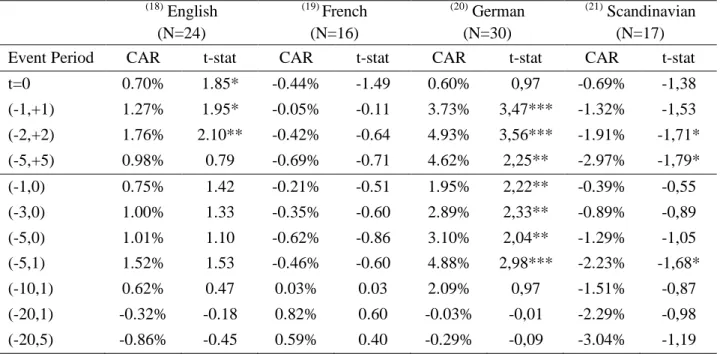
outperformed non-FB (𝐹𝐵 𝐶𝐴𝑅(−1,+1) = 1.19% vs. 𝑁𝑜𝑛 𝐹𝐵 𝐶𝐴𝑅(−5,+5) = 0.78%), possibly signalling that the market expects family firm efficiency in M&A to hold in good times. (v) Family Control and Acquiring Firm Performance under Different Legal Frameworks La Porta, et al. (1998) argued that countries whose legal system is based on Common Law rules provide greater shareholder protection. Opposingly, legal systems based on Civil Law offer less protection to minority shareholders, thus creating more concentrated ownership structures. Tables 10 to 13 present average CARs separated according to the origin of the legal system. Looking first to overall M&A performance, I noticed that firms from German-civil-law and from Common Law-based countries generated the highest ex-ante returns (significant at the 1% level), regardless of the ownership structure (Table 10). Conversely, businesses whose legal system had a Scandinavian-civil-law origin, on average, destroyed shareholder value with acquisitions (despite the market reacting positively at t=0, with an average AR of 0.30%). As far as family firms are concerned (Table 11), FB from German- and English-origin legal systems remain the best performers from the four. FB from English legal systems generated, on average, 𝐶𝐴𝑅(−1,+1) = 1.27% and 𝐶𝐴𝑅(−2,+2) = 1.76% (both significant at least at the 10%
level), while German-civil-law FB shareholders earned very large and significant (at 1% level) CARs: 𝐶𝐴𝑅(−1,+1)= 3.73%, 𝐶𝐴𝑅(−2,+2) = 4.93% (Table 11). On the other hand, FB from both French- (𝐶𝐴𝑅(−2,+2) = −0.42%) and Scandinavian-civil-law (𝐶𝐴𝑅(−2,+2) = −1.91%)
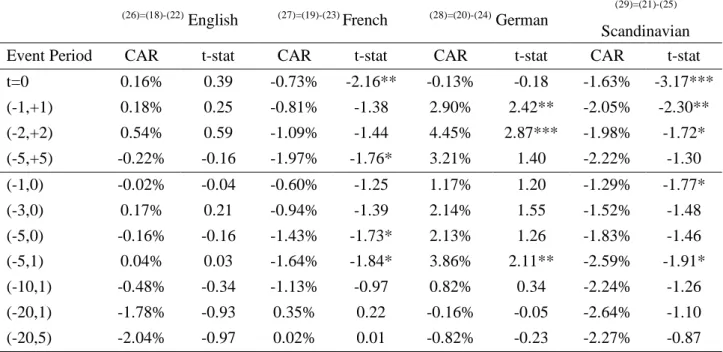
countries, on average, destroyed shareholder value with acquisitions between 2005 and 2015. This evidence is, therefore, consistent with the hypothesis H 3.1, that the market anticipates wealth appropriation by the controlling owners of FB in countries with weak shareholder protection. Note that in the case of non-FB, acquisitions were met, in general, with considerably positive market reactions under all legal environments (Table 12). Hence, when comparing both FB and non-FB M&A within each legal system, I concluded that German-civil-law based FB
20
significantly outperformed their non-family peers, while family-controlled firms significantly underperformed against non-FB in Scandinavian- and French-civil-law countries (Table 13). Consequently, the hypothesis of a competitive advantage that FB have in acquisitions (H 3.2) is nullified, suggesting that markets react differently to family control in M&A, according to the quality of the institutions, and particularly, to the legal rules in each country.
(vi) Multivariate Analysis
To complement my research, I performed a multivariate analysis based on the following model: (2) 𝐶𝐴𝑅𝑖 = 𝛽0 + 𝛽1𝐹𝐵𝑖+ 𝛽2𝐺𝑂𝑂𝐷𝑇𝐼𝑀𝐸𝑆𝑖+ 𝛽3𝐼𝑁𝑆𝑇𝐼𝑇𝑈𝑇𝐼𝑂𝑁𝑆𝑖+ 𝛽4𝑋𝑖+ 𝜀𝑖
The specification (2) includes the variables FB and GOODTIMES to assess, respectively, the impact of family control and macroeconomic conditions on CARs. INSTITUTIONS is a variable vector that includes three legal system dummies (in this case, I decided to drop Scandinavian-civil-law and consider it as the base case for the model) and ACCOUNTSTAND, which serves as a proxy for Law enforcement, thus complementing the analysis on the impact of the institutional environment. Lastly, Xi is another variable vector, but that controls for
transaction and target firm characteristics. The vector comprises four variables: DV, RATDVAMV, TPUBLIC and CROSSBORDER. Table 14 provides descriptive statistics for the variables. Based on the existing literature, I expect ACCOUNTSTAND and RATDVAMV to contribute positively to CAR and that, conversely, TPUBLIC has a negative effect on acquiring firm return.
OLS estimates for the regressors are presented in Table 16. Note that there was no evidence of multicollinearity between these variables (Table 15). Hence, estimators are unbiased and consistent. However, the error term is heteroskedastic, affecting usual inference. In fact, whereas I did not observe linear heteroskedasticity through the Breusch-Pagan test (𝐹 − 𝑠𝑡𝑎𝑡𝑖𝑠𝑡𝑖𝑐(10,370) = 1.40, only rejected at the 17.99% significance level), I detected
non-21
linear forms of heteroskedasticity when performing White’s test. The outcome of the latter was a chi-square statistic of 107.65 for 55 degrees of freedom, that led to the rejection of the null hypothesis H0: homoskedasticity. Then, I decided to use robust statistics to correct for the issue.
Moving on, I found that acquirors generate, on average, smaller ex-ante returns in periods of normal economic growth, thus validating hypothesis H 2.1. This is consistent with Rao-Nicholson and Salaber (2014) findings of greater M&A efficiency in Bad Times. Furthermore, I found that the larger the deal is in relative size, the greater will be the CAR of the acquiring firm, in line with the findings of Fuller, et al. (2002). Additionally, I observed that cross border transactions created significantly higher value and that acquisitions of listed targets were met with better market response, although not significant (contradicting findings that private targets lead to higher acquiror performance). As far as family control is concerned, I found that FB are expected to underperform against non-family firms when they engage in acquisitions (Models 1 and 3). However, notice that the impact of family ownership in the overall performance tends to be small and it even reverted when controlling for year fixed effects (Models 2 and 4). Regarding to institutional variables, coefficients of ENGLISH, FRENCH & GERMAN are all positive and significant, indicating that, ceteris paribus, firms from countries that have legal systems with those origins are expected to create higher value with acquisitions than firms from Scandinavian-civil-law countries. Moreover, note that, from the three, German-civil-law firms are the ones that generate greater CARs, followed by Common Law based countries, when controlling for year fixed effects. Such results confirm previous findings that acquiring firms from countries with stronger shareholder protection have less incentives to pursue acquisitions that satisfy controlling owners’ self-interests but that destroy overall firm value. Furthermore, I found evidence of a positive and significant relation between Accounting Standards and CAR. Such evidence then corroborates hypothesis H 3.1 and reinforces the idea that Law and institutions are key determinants of value in M&A.
22
5. Conclusion
This study evaluates the impact of the ownership structure, the macroeconomic environment and the quality of institutions on M&A performance. Note that in M&A studies, researchers tend to agree that target firm shareholders capture most of the synergistic value. However, there is lack of consensus regarding to acquirors. Then, I contribute to literature by analysing market reaction to different acquiror’s ownership structures, and, particularly, by assessing if investors react positively to family control, either in good or in bad times, and under different institutional frameworks. Moreover, by focusing on M&A between 2005-2015 in both European and North American countries, I complement studies on cross-border M&A as well as during recessions. In general, I found that the market reaction to acquisitions was, on average, positive regardless of the ownership structure. Second, I found that firms are, largely, more efficient at exploring imperfections through M&A in bad times. However, efficiency differs across firms. In fact, I found that FB underperform against non-FB (although not significantly), and that this underperformance might even translate into value destruction in bad times. Lastly, I concluded that legal rules significantly impact returns as, indeed, acquirors from countries with weaker shareholder protection generate lower value, and FB acquirors could eventually destroy value. Concerning the limitations of the analysis, note that, in the sample construction, I elected to study only acquisitions of majority interest of public and relatively large firms. Naturally, this implies that the obtained results have a narrow scope. Therefore, future research should, first, analyse other types of transactions, namely mergers, and second, look to a more diverse set of acquirors, including both smaller-sized and private firms. Other consideration has to do with the definition of Family Business. The use of a dummy variable to separate firms according to family control is quite restrictive, ignoring differences within FB. Thus, future research should further analyse different layers of family control and management. Still regarding to data selection, note that I used the indicators proposed by La Porta, et al. (1998). However, these
23
indicators were constructed with 1990s data. Therefore, future studies should also analyse the evolution of institutional quality over time and check if the findings of La Porta, et al. (1998) still hold today. Additionally, in the multivariate analysis, I did not include interaction terms within my model. The decision was motivated by the fact that interacting dummy variables would produce multicollinearity, hence, creating biased estimators and invalidating results. Then, in the future, with a broader set of independent variables, authors should evaluate interactions between them. One final remark is the possibility of endogeneity. Future studies should acknowledge that the presence of endogeneity creates inconsistent regressors. This issue might affect, for example, institutional variables. One possible solution is using shareholder protection mechanisms as instrumental variables instead of just legal system dummy variables, which might not accurately represent differences in institutional frameworks.
References
Anderson, Ronald C., and David M. Reeb. 2003. “Founding-Family Ownership and Firm Performance: Evidence from the S&P 500.” The Journal of Finance 58(3): 1301-1327. Andrade, Gregor, Mark Mitchell, and Erik Stafford. 2001. “New Evidence and Perspectives on
Mergers.” Journal of Economic Perspectives 15(2): 103-120.
André, Paul, and Walid Ben-Amar. 2014. “Family firms and high technology Mergers & Acquisitions.” Journal of Management and Governance 18: 129-158.
Ben-Amar, Walid, and Paul André. 2006. “Separation of Ownership from Control and Acquiring Firm Performance: The Case of Family Ownership in Canada.” Journal of Business Finance & Accounting 33: 517–543.
Berrone, Pascual, Cristina Cruz, and Luis R. Gomez-Meija. 2012. “Socioemotional Wealth in Family Firms: Theoretical Dimensions, Assessment Approaches, and Agenda for Future Research.” Family Business Review 25(3): 258-279.
Bouzgarrou, Houssam, and Patrick Navatte. 2013. “Ownership structure and acquirers performance: Family vs. non-family firms.” International Review of Financial Analysis 27: 123-134.
Brown, Stephen J., and Jerold B. Warner. 1985. “Using Daily Stock Returns: The Case of Event Studies.” Journal of Financial Economics 14: 3-31.
Campello, Murillo, John R. Graham, and Campbell R. Harvey. 2010. “The real effects of financial constraints: Evidence from a financial crisis.” Journal of Financial Economics 97(3): 470-487.
24
Caprio, Lorenzo, Ettore Croci, and Alfonso Del Giudice. 2011. “Ownership structure, family control and acquisition decisions.” Journal of Corporate Finance 17(5): 1636-1657. Chang, Saeyoung. 1998. “Takeovers of Privately Held Targets, Methods of Payment, and
Bidder Returns.” The Journal of Finance 53(2): 773-784.
Claessens, Stijn, Simeon Djankov, Joseph P. H. Fan, and Larry H. P. Lang. 2002. “Disentangling the Incentive and Entrenchment Effects of Large Shareholdings.” The Journal of Finance 57(6): 2741-2771.
Conn, Robert, Andy D. Cosh, Paul M. Guest, and Alan Hughes. 2005. “Impact on UK Acquirers of Domestic, Cross-border, Public and Private Acquisitions.” Journal of Business Finance & Accounting 32(5-6): 815-870.
Davis, John A., and Renato Tagiuri. 1989. “The Influence of Life Stage on Father-Son Work Relationships in Family Companies.” Family Business Review 2(1): 47-74.
Dyckman, Thomas, Donna Philbrick, and Jens Stephan. 1984. “A Comparison of Event Study Methodologies Using Daily Stock Returns: A Simulation Approach.” Journal of Accounting Research 22: 1-30.
Faccio, Mara, John J. McConnell, and David Stolin. 2006. “Returns to Acquirers of Listed and Unlisted Targets.” Journal of Financial and Quantitative Analysis 41(1): 197-220. Feito-Ruiz, Isabel, and Susana Menendez-Requejo. 2010. “Family Firm Mergers and
Acquisitions in Different Legal Environments.” Family Business Review 23(1): 60-75. Fuller, Kathleen, Jeffry Netter, and Mike Stegemoller. 2002. “What Do Returns to Acquiring
Firms Tell Us? Evidence from Firms That Make Many Acquisitions.” Journal of Finance 57(4): 1763-1793.
Gomez-Mejia, Luis R., Cristina Cruz, Pacual Berrone, and Julio De Castro. 2011. “The Bind that Ties: Socioemotional Wealth Preservation in Family Firms.” The Academy of Management Annals 5(1): 653-707.
Habbershon, Timothy G., and Mary L. Williams. 1999. “A Resource-Based Framework for Assessing the Strategic Advantages of Family Firms.” Family Business Review 12(1): 1-25.
Hay, Jonathan R., Andrei Shleifer, and Robert W. Vishny. 1996. “Toward a Theory of Legal Reform.” European Economic Review 40(3-5): 559-567.
James, Harvey S. 1999. “Owner as Manager, Extended Horizons and the Family Firm.” International Journal of the Economics of Business 6(1): 41-55.
Jarrell, Gregg A., and Annette B. Poulsen. 1989. “The Returns to Acquiring Firms in Tender Offers: Evidence from Three Decades.” Financial Management 18(3): 12-19.
Jensen, Michael C., and Richard S. Ruback. 1983. “The Market for Corporate Control: The Scientific Evidence.” Journal of Financial Economics 11: 5-50.
Johnson, Simon, Rafael La Porta, Florencio Lopez-de-Silanes, and Andrei Shleifer. 2000. “Tunneling.” American Economic Review 90(2): 22-27.
25
Kachaner, Nicolas, George Stalk Jr., and Alain Bloch. 2012. “What You Can Learn from Family Business.” Harvard Business Review November, 152.
La Porta, Rafael, Florencio Lopez-de-Silanes, Andrei Shleifer, and Robert W. Vishny. 1998. “Law and Finance.” The Journal of Political Economy 106(6): 1113-1155.
Moeller, Sara B., Frederik P. Schlingemann, and Rene M. Stulz. 2004. “Do shareholders of acquiring firms gain from acquisitions?” Journal of Financial Economics 73: 201-228. Oler, Derek K., Jeffrey S. Harrison, and Mathew R. Allen. 2008. “The danger of misinterpreting short-window event study findings in strategic management research: an empirical illustration using horizontal acquisitions.” Strategic Organization 6(2): 151-184. Poza, Ernesto J. 2010. Family Business. South-Western, CENGAGE Learning.
Rao-Nicholson, Rekha, and Julie Salaber. 2014. “The Impact of the Financial Crisis on the Performance of European Acquisitions.” In International Business and Institutions after the Financial Crisis, by Yama Temouri and Chris Jones, 73-92. London: Palgrave Macmillan.
Reddy, Kotapati Srinivasa, Vinay Kumar Nangia, and Rajat Agrawal. 2014. “The 2007–2008 Global Financial Crisis, and Cross-border Mergers and Acquisitions: A 26-nation Exploratory Study.” Global Journal of Emerging Market Economies 6(3): 257-281. Roll, Richard. 1986. “The Hubris Hypothesis of Corporate Takeovers.” The Journal of Business
59(2): 197-216.
Schoenberg, Richard. 2006. “Measuring the Performance of Corporate Acquisitions: An Empirical Comparison of Alternative Metrics.” British Journal of Management 17: 361-370.
Seth, Anju, Kean P. Song, and R. Richardson Pettit. 2002. “Value Creation and Destruction in Cross-Border Acquisitions: an Empirical Anlaysis of Foreign Acquisitions of U.S. Firms.” Strategic Management Journal 23: 921-940.
Shleifer, Andrei, and Robert W. Vishny. 2001. “Stock Market Driven Acquisitions.” Journal of Financial Economics 70(3): 295-311.
Villalonga, Belen, and Raphael Amit. 2006. “How Do Family Ownership, Control and Management Affect Firm Value?” Journal of Financial Economics 80(2): 385-417. Wan, William P., and Daphne W. Yiu. 2009. “From crisis to opportunity: environmental jolt,
corporate acquisitions, and firm performance.” Strategic Management Journal 30(7): 791-801.
Worek, Maija. 2017. “Mergersand Acquisitions in Family Businesses: Current Literature and Future Insights.” Journal of Family Business Management 7(2): 177-206.
Zollo, Maurizio, and Degenhard Meier. 2007. “Understanding the Performance of Corporate Acquisitions.” Research Paper No. 2007/25/ST. INSEAD Business School, April.
26
Appendix
Table 1. Sample characterization – Number and Value of Deals per year
Year Number of Transactions Total Value (USD Millions) Average Value (USD Millions) 2005 31 6 115.8 197.3 2006 45 8 389.1 186.4 2007 56 9 211.5 164.5 2008 28 5 307.4 189.5 2009 28 5 771.1 206.1 2010 38 6 793.7 178.8 2011 40 9 201.0 230.0 2012 37 7 158.0 193.5 2013 21 3 906.1 186.0 2014 38 8 193.6 215.6 2015 19 4 486.2 236.1 Total 381 74 533.5 195.6
Table 2. Sample charact. – Distribution of Transactions by Country of the Acquiring Firm
Countries 2005 2006 2007 2008 2009 2010 2011 2012 2013 2014 2015 2005-15 Canada 2 1 7 3 3 3 3 6 1 6 2 37 France 6 2 2 6 5 5 4 6 1 3 5 45 Germany 2 3 6 2 2 3 2 1 1 2 1 25 Italy 2 4 1 3 2 2 3 0 0 1 1 19 Netherlands 0 0 0 0 0 0 2 0 0 3 0 5 Norway 3 3 3 1 1 2 0 3 1 2 0 19 Spain 1 9 4 1 0 4 3 2 1 2 2 29 Sweden 3 7 2 3 0 1 5 1 1 1 0 24 Switzerland 1 2 4 0 1 1 1 1 2 4 0 17 United Kingdom 1 3 13 5 3 4 8 3 3 6 3 52 United States 10 11 14 4 11 13 9 14 10 8 5 109 Total 31 45 56 28 28 38 40 37 21 38 19 381
27
Table 3. Sample characterization – Distribution of Transactions by Macroeconomic Industry of the Acquiring Firm
Macro
Industries 2005 2006 2007 2008 2009 2010 2011 2012 2013 2014 2015 2005-15 Consumer
Prod. & Serv. 3 2 3 2 2 4 1 4 2 4 0 27
Consumer Staples 1 0 3 2 4 5 7 3 1 6 0 32 Energy and Power 6 5 11 4 6 9 7 10 2 2 6 68 Healthcare 2 2 5 2 2 3 4 3 7 3 3 36 High Technology 2 7 10 3 0 2 6 1 3 5 0 39 Industrials 4 10 9 4 4 3 5 6 2 6 3 56 Materials 6 4 6 3 6 6 4 5 1 6 2 49 Media and Entertainment 2 4 5 2 4 4 3 3 3 3 4 37 Retail 2 3 2 5 0 0 2 2 0 1 0 17 Telecom. 3 8 2 1 0 2 1 0 0 2 1 20 Total 31 45 56 28 28 38 40 37 21 38 19 381
Table 4. Properties of the distribution of daily Mean Excess Returns in the estimation period (-244,-6)
Mean Excess
Return
Standard
Deviation Excess Kurtosis Skewness
(a) 0.00000% 0.000978 -0.05 -0.17
(b) 0.00000% 0.017185 6.69 0.30
(a) – Values computed using 239 average daily mean excess return observations (b) – Values computed as an average value of the 381 statistics, one for each transaction
28
Table 5. Analysis of the statistical significance of CARs in different short-term windows around announcement date (t=0) for all firms comprised in the sample
Event Period CAR CAAR t-stat
t=0 0.42% 0.42% 4.25*** (-1,+1) 0.91% 0.30% 5.38*** (-2,+2) 0.91% 0.18% 4.18*** (-5,+5) 0.89% 0.08% 2.74*** (-1,0) 0.63% 0.32% 4.57*** (-3,0) 0.69% 0.17% 3.54*** (-5,0) 0.87% 0.15% 3.64*** (-5,1) 1.15% 0.16% 4.44*** (-10,1) 0.91% 0.08% 2.68*** (-20,1) 0.73% 0.03% 1.59 (-20,5) 0.47% 0.02% 0.94
***Significant at 1% level; **Significant at 5% level; *Significant at 10% level
Table 6. Analysis of the statistical significance of average CARs obtained by Family Businesses and Non-Family Businesses, for different short-term windows
(1) FB (N=87) (2) Non-FB (N=294)
(3)=(2)-(1) Difference
FB – Non-FB
Event Period CAR t-stat CAR t-stat CAR t-stat
t=0 0.02% 0.09 0.53% 4.96*** -0.51% -2.20** (-1,+1) 0.76% 2.06** 0.96% 5.14*** -0.20% -0.49 (-2,+2) 0.87% 1.84* 0.92% 3.85*** -0.05% -0.10 (-5,+5) 0.30% 0.43 1.06% 2.99*** -0.76% -0.98 (-1,0) 0.42% 1.39 0.70% 4.58*** -0.28% -0.84 (-3,0) 0.51% 1.20 0.75% 3.48*** -0.24% -0.50 (-5,0) 0.38% 0.74 1.02% 3.86*** -0.63% -1.10 (-5,1) 0.72% 1.28 1.28% 4.49*** -0.55% -0.89 (-10,1) 0.27% 0.37 1.10% 2.95*** -0.83% -1.02 (-20,1) -0.26% -0.26 1.02% 2.02** -1.28% -1.16 (-20,5) -0.68% -0.63 0.81% 1.48 -1.49% -1.25
29
Table 7. Analysis of the statistical significance of average CARs obtained by all firms in the sample during Good Times and Bad Times, for different short-term windows
(4)
Good Times (GT) (5) Bad Times (BT)
(6)=(4)-(5)
Difference GT – BT
Event Period CAR t-stat CAR t-stat CAR t-stat
t=0 0.45% 4.13*** 0.33% 1.45 0.12% 0.46 (-1,+1) 0.87% 4.65*** 1.02% 2.58*** -0.14% -0.33 (-2,+2) 0.97% 4.01*** 0.76% 1.49 0.21% 0.37 (-5,+5) 1.06% 2.96*** 0.42% 0.55 0.65% 0.76 (-1,0) 0.50% 3.29*** 0.98% 3.06*** -0.48% -1.33 (-3,0) 0.50% 2.30** 1.23% 2.70*** -0.73% -1.42 (-5,0) 0.76% 2.85*** 1.19% 2.14** -0.43% -0.69 (-5,1) 1.12% 3.92*** 1.22% 2.03** -0.10% -0.15 (-10,1) 0.62% 1.64 1.71% 2.17** -1.09% -1.23 (-20,1) 0.22% 0.43 2.13% 2.00** -1.91% -1.59 (-20,5) 0.16% 0.28 1.32% 1.14 -1.17% -0.89
***Significant at 1% level; **Significant at 5% level; *Significant at 10% level
Table 8. Comparison of short-term M&A performance of FB and Non-FB under favourable economic conditions – Good Times
GT (7) FB (8) Non-FB
(9)=(7)-(8)
Diff. FB – Non-FB in GT
Event Period CAR t-stat CAR t-stat CAR t-stat
t=0 0.28% 1.17 0.50% 4.30*** -0.22% -0.88 (-1,+1) 1.19% 2.93*** 0.78% 3.88*** 0.41% 0.95 (-2,+2) 1.69% 3.21*** 0.76% 2.92*** 0.93% 1.65* (-5,+5) 1.44% 1.85* 0.95% 2.48** 0.49% 0.59 (-1,0) 0.65% 1.95* 0.46% 2.82*** 0.18% 0.52 (-3,0) 0.97% 2.06** 0.36% 1.55 0.61% 1.21 (-5,0) 1.06% 1.84* 0.67% 2.35** 0.39% 0.63 (-5,1) 1.60% 2.58*** 0.98% 3.21*** 0.62% 0.93 (-10,1) 0.76% 0.93 0.57% 1.43 0.18% 0.21 (-20,1) -0.34% -0.31 0.38% 0.70 -0.72% -0.61 (-20,5) -0.50% -0.42 0.35% 0.60 -0.85% -0.66
30
Table 9. Comparison of short-term M&A performance of FB and Non-FB in periods of economic downturn – Bad Times
BT (10) FB (11) Non-FB
(12)=(10)-(11)
Diff. FB – Non-FB in BT
Event Period CAR t-stat CAR t-stat CAR t-stat
t=0 -0.70% -1.45 0.63% 2.34** -1.33% -2.34** (-1,+1) -0.45% -0.54 1.44% 3.10*** -1.89% -1.92* (-2,+2) -1.39% -1.30 1.38% 2.30** -2.77% -2.19** (-5,+5) -2.87% -1.81* 1.37% 1.54 -4.25% -2.26** (-1,0) -0.22% -0.32 1.33% 3.50*** -1.55% -1.93* (-3,0) -0.76% -0.79 1.80% 3.35*** -2.56% -2.26** (-5,0) -1.48% -1.26 1.97% 2.99*** -3.45% -2.48** (-5,1) -1.72% -1.35 2.08% 2.92*** -3.79% -2.53** (-10,1) -1.08% -0.65 2.52% 2.70*** -3.60% -1.83* (-20,1) -0.03% -0.01 2.76% 2.19** -2.79% -1.05 (-20,5) -1.19% -0.49 2.05% 1.50 -3.24% -1.12
***Significant at 1% level; **Significant at 5% level; *Significant at 10% level
Table 10. Analysis of the statistical significance of average CARs obtained by all firms in the sample, separated according to the origin of the legal system of the acquiring firm country
(14) English (N=198) (15) French (N=42) (16) German (N=98) (17) Scandinavian (N=43)
Event Period CAR t-stat CAR t-stat CAR t-stat CAR t-stat
t=0 0.56% 4.03*** 0.07% 0.38 0.68% 2.32** 0.30% 1.01 (-1,+1) 1.11% 4.65*** 0.51% 1.57 1.93% 3.79*** -0.08% -0.17 (-2,+2) 1.28% 4.17*** 0.34% 0.81 2.17% 3.30*** -0.72% -1.09 (-5,+5) 1.17% 2.56** 0.68% 1.10 2.63% 2.70*** -1.63% -1.68* (-1,0) 0.77% 3.96*** 0.20% 0.78 1.22% 2.94*** 0.39% 0.95 (-3,0) 0.85% 3.07*** 0.30% 0.81 1.56% 2.65*** 0.03% 0.05 (-5,0) 1.15% 3.41*** 0.38% 0.83 1.78% 2.47** -0.18% -0.25 (-5,1) 1.49% 4.09*** 0.68% 1.38 2.49% 3.20*** -0.66% -0.85 (-10,1) 1.04% 2.18** 0.82% 1.27 1.58% 1.55 -0.16% -0.15 (-20,1) 1.25% 1.94* 0.57% 0.66 0.07% 0.05 -0.69% -0.50 (-20,5) 0.93% 1.33 0.57% 0.60 0.22% 0.14 -1.66% -1.11
31
Table 11. Analysis of the statistical significance of average CARs obtained by Family Businesses, separated according to the origin of the legal system of the acquiring firm country
(18) English (N=24) (19) French (N=16) (20) German (N=30) (21) Scandinavian (N=17)
Event Period CAR t-stat CAR t-stat CAR t-stat CAR t-stat
t=0 0.70% 1.85* -0.44% -1.49 0.60% 0,97 -0.69% -1,38 (-1,+1) 1.27% 1.95* -0.05% -0.11 3.73% 3,47*** -1.32% -1,53 (-2,+2) 1.76% 2.10** -0.42% -0.64 4.93% 3,56*** -1.91% -1,71* (-5,+5) 0.98% 0.79 -0.69% -0.71 4.62% 2,25** -2.97% -1,79* (-1,0) 0.75% 1.42 -0.21% -0.51 1.95% 2,22** -0.39% -0,55 (-3,0) 1.00% 1.33 -0.35% -0.60 2.89% 2,33** -0.89% -0,89 (-5,0) 1.01% 1.10 -0.62% -0.86 3.10% 2,04** -1.29% -1,05 (-5,1) 1.52% 1.53 -0.46% -0.60 4.88% 2,98*** -2.23% -1,68* (-10,1) 0.62% 0.47 0.03% 0.03 2.09% 0,97 -1.51% -0,87 (-20,1) -0.32% -0.18 0.82% 0.60 -0.03% -0,01 -2.29% -0,98 (-20,5) -0.86% -0.45 0.59% 0.40 -0.29% -0,09 -3.04% -1,19
***Significant at 1% level; **Significant at 5% level; *Significant at 10% level
Table 12. Analysis of the statistical significance of average CARs obtained by Non-Family Businesses, separated according to the origin of the legal system of the acquiring firm country
(22) English (N=174) (23) French (N=26) (24) German (N=68) (25) Scandinavian (N=26)
Event Period CAR t-stat CAR t-stat CAR t-stat CAR t-stat
t=0 0.54% 3.56*** 0.29% 1.35 0.73% 2.49** 0.94% 3.26*** (-1,+1) 1.09% 4.17*** 0.75% 1.99** 0.83% 1.62 0.73% 1.45 (-2,+2) 1.22% 3.62*** 0.67% 1.38 0.48% 0.73 0.07% 0.11 (-5,+5) 1.20% 2.40** 1.28% 1.78* 1.41% 1.45 -0.75% -0.78 (-1,0) 0.77% 3.63*** 0.39% 1.26 0.78% 1.87* 0.90% 2.21** (-3,0) 0.83% 2.75*** 0.59% 1.35 0.74% 1.27 0.63% 1.09 (-5,0) 1.17% 3.17*** 0.82% 1.53 0.97% 1.34 0.55% 0.77 (-5,1) 1.49% 3.73*** 1.18% 2.05** 1.02% 1.31 0.37% 0.48 (-10,1) 1.10% 2.11** 1.17% 1.54 1.27% 1.25 0.73% 0.73 (-20,1) 1.47% 2.08** 0.47% 0.45 0.13% 0.10 0.35% 0.26 (-20,5) 1.18% 1.54 0.57% 0.51 0.53% 0.35 -0.77% -0.52
32
Table 13. Evaluation of the statistical difference in the performance of FB and Non-FB under different institutional backgrounds, separated according to the origin of the legal system of the acquiring firm country
(26)=(18)-(22) English (27)=(19)-(23) French (28)=(20)-(24) German
(29)=(21)-(25)
Scandinavian
Event Period CAR t-stat CAR t-stat CAR t-stat CAR t-stat
t=0 0.16% 0.39 -0.73% -2.16** -0.13% -0.18 -1.63% -3.17*** (-1,+1) 0.18% 0.25 -0.81% -1.38 2.90% 2.42** -2.05% -2.30** (-2,+2) 0.54% 0.59 -1.09% -1.44 4.45% 2.87*** -1.98% -1.72* (-5,+5) -0.22% -0.16 -1.97% -1.76* 3.21% 1.40 -2.22% -1.30 (-1,0) -0.02% -0.04 -0.60% -1.25 1.17% 1.20 -1.29% -1.77* (-3,0) 0.17% 0.21 -0.94% -1.39 2.14% 1.55 -1.52% -1.48 (-5,0) -0.16% -0.16 -1.43% -1.73* 2.13% 1.26 -1.83% -1.46 (-5,1) 0.04% 0.03 -1.64% -1.84* 3.86% 2.11** -2.59% -1.91* (-10,1) -0.48% -0.34 -1.13% -0.97 0.82% 0.34 -2.24% -1.26 (-20,1) -1.78% -0.93 0.35% 0.22 -0.16% -0.05 -2.64% -1.10 (-20,5) -2.04% -0.97 0.02% 0.01 -0.82% -0.23 -2.27% -0.87
***Significant at 1% level; **Significant at 5% level; *Significant at 10% level
Table 14. Descriptive Statistics – Mean, Median, Maximum and Minimum of dependent, independent and control variables
Mean Median Min Max
CAR (-1,+1) 0.91% 0.46% -18.42% 27.09% FB 0.23 0 0 1 GOODTIMES 0.73 1 0 1 ENGLISH 0.52 1 0 1 FRENCH 0.26 0 0 1 GERMAN 0.11 0 0 1 SCANDINAVIAN 0.11 0 0 1 ACCOUNTSTAND 71.12 71 62 83 DV 4.63 4.58 2.30 6.89 RATDVAMV 0.08 0.03 0.000 1.43 CROSSBORDER 0.62 1 0 1 TPUBLIC 0.21 0 0 1
33
Table 15. Correlation Matrix
C R O S S B O R D ER -0 .0690 -0 .0402 0 .0034 -0 .0151 -0 .0387 0 .1492 -0 .0411 -0 .1439 -0 .0263 1 .0000 TP U B LI C -0 .0348 0 .0497 -0 .1880 0 .0210 0.2301 -0 .1104 0 .1614 0.0317 1.0000 R A T D V A MV 0 .1145 -0 .0059 -0 .0350 -0 .0362 0 .0523 -0 .0794 0 .3400 1.0000 DV 0 .0271 0.0769 -0 .0932 0 .0036 0.0830 -0 .0737 1 .0000 A C C O U N T S TA N D -0 .1336 0 .1243 0 .4216 -0 .5448 -0 .4184 1 .0000 G ER MAN 0 .12 80 0 .1182 -0 .3661 -0 .2071 1 .0000 F R EN C H 0 .1090 -0 .2816 -0 .6121 1 .0000 EN G LI S H -0 .2655 0 .1306 1.0000 GOOD TIMES 0.0041 1.0000 FB 1 .0000 FB GO O D TI MES EN G LI S H F R EN C H G ER MAN A C C O U N TS TA N D DV RA TD V A MV TP U B LI C C R O S S B O R D ER
34
Table 16. OLS regressions of 3-day CARs (window (-1,+1)) on family control, macroeconomic and institutional environment, and target firm and deal characteristics
Model 1 Model 2 Model 3 Model 4
Coeff. t-stats(a) Coeff. t-stats(a) Coeff. t-stats(a) Coeff. t-stats(a)
FB -0.0003 -0.07 0.0005 0.10 -0.0012 -0.20 0.0002 0.03 GOODTIMES -0.0025 -0.49 -0.0051 -0.56 -0.0021 -0.39 -0.0031 -0.34 ENGLISH 0.0211 2.51** 0.0212 2.42** 0.0200 2.32** 0.0203 2.28** FRENCH 0.0241 2.01** 0.0204 1.74* 0.0228 1.85* 0.0197 1.64 GERMAN 0.0390 3.18*** 0.0391 3.11*** 0.0368 3.02*** 0.0369 2.94*** ACCOUNTSTAND 0.0013 1.96** 0.0011 1.71* 0.0012 1.87* 0.0011 1.66* DV -0.0023 -1.53 -0.0024 -1.52 -0.0019 -1.18 -0.0019 -1.19 RATDVAMV 0.0458 2.33** 0.0440 2.27** 0.0463 2.35** 0.0443 2.28** TPUBLIC 0.0065 1.28 0.0063 1.25 0.0059 1.12 0.0057 1.08 CROSSBORDER 0.0083 1.87* 0.0086 1.98** 0.0071 1.60 0.0072 1.64 Intercept -0.1023 -0.0842 -0.1005 -0.0860
YEARS NO YES NO YES
INDUSTRIES NO NO YES YES
R2 6.50% 9.40% 7.52% 10.37%
Adjusted R2 3.97% 4.36% 2.65% 2.96%
F-statistic(a) 2.03** 1.58* 1.23 1.27
Prob > F 0.0297 0.0557 0,2301 0.1621
***Significant at 1% level; **Significant at 5% level; *Significant at 10% level