Di
ffusion Coefficients of Fluorinated Surfactants in Water:
Experimental Results and Prediction by Computer Simulation
Luís A. M. Pereira,
†,‡Luís F. G. Martins,*
,‡José R. Ascenso,
†Pedro Morgado,
†Joa
̃o P. Prates Ramalho,
‡and Eduardo J. M. Filipe*
,††Centro de Química Estrutural, Instituto Superior Técnico, Universidade de Lisboa, Av. Rovisco Pais, 1049-001 Lisboa, Portugal ‡Centro de Química de Évora, Universidade de Évora, Rua Romão Ramalho, 59, 7000-671 Évora, Portugal
*
S Supporting InformationABSTRACT: Intradiffusion coefficients of 2,2,2-trifluoroethanol in water have been measured by the pulsed field gradient (PFG)-NMR spin−echo technique as a function of temperature and composition on the dilute alcohol region. The measurements extend the range of compositions already studied in the literature and, for thefirst time, include the study of the temperature dependence. At the same time, intradiffusion coefficients of 2,2,2-trifluoroethanol, 2,2,3,3,3-pentafluoropropan-1-ol, and 2,2,3,3,4,4,4-heptafluorobutan-1-ol in water were obtained by computer simulation (molecular dynamics) as a function of composition and temperature. The intradiffusion coefficients of 2,2,2-trifluoroethanol in water obtained by simulation agree with the experimental results, while those of 2,2,3,3,3-pentafluoropropan-1-ol and 2,2,3,3,4,4,4-heptafluorobutan-1-ol are the first estimation of this property for those systems. The molecular dynamics simulations were also used to calculate the intradiffusion coefficients of perfluorooctanesulfonic acid and
perfluorooctanoic acid in water at infinite dilution as a function of temperature, which are very difficult to obtain experimentally because of the very low solubility of these substances. From the dependence of the intradiffusion coefficients on temperature, diffusion activation energies were estimated for all the solutes in water.
1. INTRODUCTION
Fluorinated surfactants find many industrial applications because of their enhanced ability to lower the surface energy of both liquids and solids. They are used, for example, as adjuvant components in fluoropolymer processing and manufacture media, coatings, and aqueous foams for fire extinction involving highlyflammable liquids.1
As a result of their extensive use, emissions of fluorinated surfactants became frequent and, because of their persistent character, have been increasingly found in environmental compartments, especially in biota (animals and even humans). Giesy and Kannan2 first pictured the global dissemination of perfluorooctanesulfonic acid (PFOS) in wildlife (fish, birds and marine mammals), while Hansen et al.3 detected PFOS and perfluorooctanoic acid (PFOA) in samples of human blood. As environmental contaminants, fluorinated surfactants not only persist because of their chemically stable fluorinated carbon backbone, but also bioaccumulate through the food chain4−7as a consequence of their hydrophobic character. The intake of drinking water, food, and air dust have been pointed as the main exposure pathways for PFOS and PFOA.8,9
The above-mentioned persistency and bioaccumulation of perfluorinated compounds are especially important in these two surfactants, perhaps the most ubiquitous of these substances. Their toxicity has been demonstrated for many living organisms,10,11 and some of their adverse effects have already been demonstrated in humans.12,13 The levels of PFOS and
PFOA in the environment (in particular natural waters and biota) have thus become a matter of public concern. The European Union (EU) Directive 2006/122/EC14restricted the intentional use of PFOS in certain preparations, products, and articles placed on the EU market and kept PFOA under review through the ongoing risk assessment activities related to the availability of safer alternative substances or technologies. More recently, the EU added PFOS to the list of priority hazardous substances15 that should achieve the good surface water chemical status and comply with environmental quality standards until 2027.
The removal of these compounds from aqueous solution is a very difficult task because of their remarkable chemical stability; several special chemical techniques have been proposed for their degradation, and their adsorption in different solids has been tested.16
Alcohols with perfluorinated chains are also fluorinated surfactants, and can be regarded as the most simple of these substances in terms of chemical structure. This apparent simplicity, together with the variation of their properties with thefluorinated chain length, makes them more amenable to the
Special Issue: Modeling and Simulation of Real Systems
Received: March 3, 2014
Accepted: August 4, 2014
Published: August 12, 2014
molecular interpretation of the trends in their experimental properties and even to theoretical and modeling treatments. These substances, and in particular the smallest one, 2,2,2-trifluoroethanol (TFE), find application in the most varied fields, from the pharmaceutical industry where it is used as a precursor, to polymer technology where itfinds use as a solvent for nylon. Its aqueous solutions are of widespread use in the study of proteins, for the reversible induction of conformational changes and folding and for the stabilization of secondary structures.17
The thermodynamic behavior of aqueous solutions of n-fluoroalcohols also presents interesting features, with large negative excess volumes,18s-shaped but mostly positive excess enthalpies,19,20and even a discontinuity in the compressibility versus composition behavior in dilute solutions of TFE.21 However, the knowledge of the dynamic properties of these systems, and in particular of their diffusion behavior is very scarce; to the best of our knowledge, only the mutual diffusion coefficients for TFE+water as a function of composition have been measured.22In the case of aqueous solutions of PFOS and PFOA, no diffusion coefficients could be found, despite the importance of this property for pollutant dispersion modeling or for the optimization of remediation technologies such as adsorption and ion exchange. For these two priority substances, accurate estimation techniques are of utmost convenience, since their very low solubility in water23 makes the experimental determination of the diffusion coefficients very difficult.
This work is part of a project in which experimental measurements and molecular simulation techniques are simultaneously used to elucidate the properties offluorinated substances and their mixtures. Using this approach, we have very recently reported a study on the behavior of TFE + ethanol mixtures24 which allowed the establishment of the importance of the asymmetry in the distribution of hydrogen bonds between the two compounds, as well as of the weak fluorinated-hydrogenated interaction, in the thermodynamic properties of this system.
Following this line of work, we present here new experimental measurements of the intradiffusion coefficient of TFE in aqueous solutions, as a function of temperature and composition, determined using the pulsed-field gradient (PFG)-NMR technique. Intradiffusion refers to molecular (random) motion of a given species in solution, with respect to itself, in the absence of concentration gradients. Self-diffusion refers to the particular case of intradiffusion in a pure component. The measurements were obtained on the dilute region (0.0005 < xTFE< 0.05), extending the composition range
of the available data, and include, for thefirst time, the effect of temperature. Molecular dynamics (MD) simulations were done for the same system and, for the first time, for the aqueous solutions of longerfluorinated alcohols, PFOS and PFOA, in order to predict the diffusion coefficients of these substances in water as a function of temperature. It should be emphasized that the molecular simulations are being used in this work to predict an important property which, at least in the case of the two regulated pollutants, would be very difficult to measure experimentally. As will be seen, a remarkable consistency between experimental and simulated diffusion coefficients of TFE was achieved, which allows a good degree of confidence in the values obtained by MD for the longer fluorinated compounds.
2. EXPERIMENTAL SECTION
2,2,2-Trifluoroethanol (99 %), supplied by Apollo Scientific, was distilled over potassium sulfate, stored in tightly closed bottles and handled under dry nitrogen. Water was purified in a Milliporefiltration and ion exchange system to a final resistivity of 18.2 MΩ·cm.
Intradiffusion coefficients were determined by PFG-NMR spin−echo in a NMR Bruker Advance III 500 MHz spectrometer with a 5 mm BBO probe tuned to observe19F.
A bipolar stimulated echo sequence (BPPLED) with sine gradients and an eddy current delay teof 5 ms were used.25
The signal intensity (I) was monitored as a function of the square of the gradient amplitude (g) and the resulting diffusion coefficients (D) were calculated according to the Steiskal− Tanner equation γδ δ τ = ⎡− ⎜Δ − − ⎟ ⎣⎢ ⎛ ⎝ ⎞ ⎠ ⎤ ⎦⎥ I I exp D( g) 3 2 0 2 g (1) where I0is the intensity in the absence of gradient pulses,δ is
the duration of the applied gradient,γ is the gyromagnetic ratio of the nucleus,Δ is the diffusion time, and τg is the gradient
recovery delay.
The duration of the pulse gradients and the diffusion time were adjusted in order to obtain full attenuation of the signals at 95 % of maximum gradient strength. Typically, the values used were 2 ms to 3 ms for the duration of the gradient pulses and 80 ms for the diffusion time. The gradient strength was incremented from 2 % to 95 % in a linear ramp with 16 steps. A delay of 15 s between echoes was used. The gradients were previously calibrated using D2O 99.9 % as a standard.26 Sine-shaped gradient pulses were used.
Intradiffusion coefficients of 2,2,2-trifluoroethanol in water were measured for six different compositions (roughly alcohol molar fractions of 0.0005, 0.001, 0.005, 0.009, 0.01, and 0.05) in the solute dilution limit at temperatures from 283 K to 313 K with intervals of 5 K. Solutions were prepared by weight (with an uncertainty of 0.01 mg) in screw-capflasks with 4 mL or 20 mL, keeping the vapor phase to a minimum volume. The solutions were placed in capped 5 mm NMR tubes and a sealed capillary with D2O was inserted to provide for deuterium lock. Temperature was controlled by a BCU05 Bruker unit and measured to within 0.1 K. The probe temperature was previously calibrated with a copper-constantan thermocouple placed inside the NMR tube.
3. SIMULATION DETAILS
The optimized potentials for liquid simulations all-atom (OPLS-AA) force-field27 framework was used to model fluorinated alcohols, PFOS, and PFOA. This force-field models each atom as an interaction site and the potential energy is written as the sum of contributions due to bond stretching, bond angle bending, dihedral angle torsion, and nonbonded interactions (van der Waals plus electrostatic interactions). Water was modeled by the 2005 version of TIP4P force field developed by Abascal and Vega,28which is a four-center rigid model based on TIP4P from Jorgensen et al.29The potential energy expressions and the full set of forcefield parameters used in the simulations can be found in the Supporting Information. For 2,2,2-trifluoroethanol the parameters used were those obtained in the framework of OPLS-AA by Duffy.30,31For the longer fluorinated alcohols (2,2,3,3,3-pentafluoropropan-1-ol and 2,2,3,3,4,4,4-heptafluorobutan-1-ol) and PFOA, Jorgensen
et al.27(alcohol and carboxylic acid moieties) and Watkins et al.32(perfluoroalkyl moiety) parameters were used, along with the torsional functional form and parameters proposed by Pádua33 for the cross-dihedral terms between fluorinated and hydrogenated parts of the carbon chain. In the case of PFOS, besides the parameters from Watkins et al. (bonded and nonbonded parameters forfluorinated chain), parameters from Sunda and Venkatnathan34 for the sulfonic group were used. Atomic charges of PFOS were newly evaluated in this work by quantum mechanical calculations at the MP2/cc-pVTZ//HF/ 6-31G(d) level of theory, with the partial charges obtained by the Kollman and Singh scheme.35 All quantum calculations were performed with the GAMESS-US package.36 This procedure is very similar to the one used by Pádua33 to calculate the atomic charges of 1,1,1,2,2-pentafluorobutane, 1,1,2,2,3,3-heptafluoropentane, and perfluorobutane, in which the calculated charges were found to be remarkably close to those of the forcefield. For this reason, the punctual charges for carbon and fluorine atoms from the original force-field (Watkins et al.32) were used in our simulations.
Following the OPLS-AA parametrization, geometrical combining rules were used to compute the nonbonded Lennard-Jones interactions between sites of different types:
εij= ε εii jj (2)
σij= σ σii jj (3)
For nonbonded interactions between sites in the same molecule, only sites separated by three or more bonds are considered. Nonbonded interactions between sites separated by three bonds are scaled by a factor of 0.5. In this work, all bonds involving hydrogen were treated as rigid, with the respective length fixed at the equilibrium distance, and the LINCS algorithm was used to constrain them.37 The long-range electrostatic (Coulombic) interactions were calculated using the particle-mesh Ewald method.
Molecular Dynamics simulations were performed using the GROMACS package,38,39with systems of 1000 total molecules, to which periodic boundary conditions were applied in three directions. The initial liquid box sizes were established according to the experimental densities. For each system, the following simulation protocol was applied: an initial NpT equilibration run of 2 ns followed by a 10 ns long NpT production run from which the density of the system can be calculated; then a 1 ns NVT equilibration run followed by a 10 ns NVT production run, whose trajectories were used to compute diffusion coefficients of solutes in water. Before doing the NVT simulations, the box volume was adjusted to the average value of the NpT production run. The equations of motion were solved using the leapfrog integration algorithm, with a time step of 1 fs. In the equilibration runs the Berendsen thermostat and barostat40(the latter only in NpT ensembles) was used, whereas in the production runs, temperature was controlled using the Nosé−Hoover thermostat41,42 and pressure (in NpT ensemble) was controlled by the Parrinello−Rahman barostat.43,44 For temperature control, coupling constants of 0.03 ps and 0.1 ps were used for Berendsen and Nosé−Hoover thermostats, respectively. In the case of pressure, coupling constants of 4.0 ps and 1.0 ps were used respectively in the Berendsen and Parrinello−Rahman barostats. An initial velocity obtained from a Maxwell distribution at the desired initial temperature has been assigned to all atoms.
In all simulations a neighbor list, with a radius of 10 Å, was used and was updated every 5 time steps. Both nonbonded Lennard-Jones and electrostatic potential were truncated by using cut-offs of 12 Å and 10 Å, respectively, and analytical tail corrections to dispersion terms were added. Before the molecular dynamics runs, the boxes were subjected to energy minimization by the steepest descent method to a maximum force of 10 kJ/mol·nm, with a maximum number of steps of 1 × 10⁵.
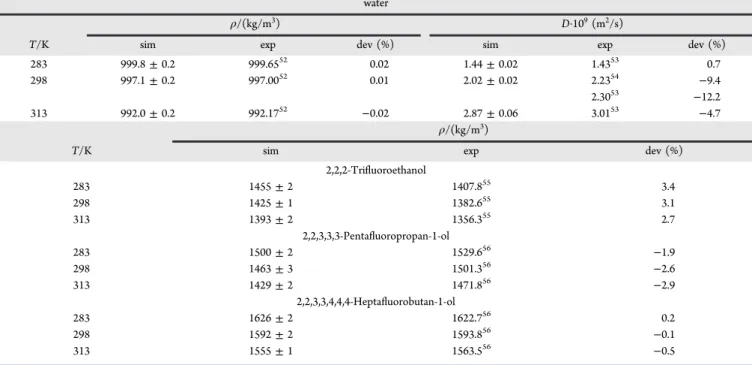
Table 1. Densities and Self-Diffusion Coefficients of Pure Compounds Obtained by Computer Simulation (sim) in Comparison with Experimental (exp) Data and Their Respective Percent Deviation (dev)
water
ρ/(kg/m3) D·109(m2/s)
T/K sim exp dev (%) sim exp dev (%)
283 999.8± 0.2 999.6552 0.02 1.44± 0.02 1.4353 0.7
298 997.1± 0.2 997.0052 0.01 2.02± 0.02 2.2354 −9.4
2.3053 −12.2
313 992.0± 0.2 992.1752 −0.02 2.87± 0.06 3.0153 −4.7
ρ/(kg/m3)
T/K sim exp dev (%)
2,2,2-Trifluoroethanol 283 1455± 2 1407.855 3.4 298 1425± 1 1382.655 3.1 313 1393± 2 1356.355 2.7 2,2,3,3,3-Pentafluoropropan-1-ol 283 1500± 2 1529.656 −1.9 298 1463± 3 1501.356 −2.6 313 1429± 2 1471.856 −2.9 2,2,3,3,4,4,4-Heptafluorobutan-1-ol 283 1626± 2 1622.756 0.2 298 1592± 2 1593.856 −0.1 313 1555± 1 1563.556 −0.5
For each state point and system, a total of 20 equivalent simulation sequences were performed, each one starting from a different initial configuration. The average value of diffusion coefficient was taken for each state point.
The intradiffusion coefficients of different solutes in water (D) were calculated from the linear part of the mean square displacement of the center of mass of the solute molecules according to the Einstein equation:
∑
= ⟨ ⃗ − ⃗ ⟩ →∞ = D N t r t r 1 6 lim d d [ ( ) (0)] t i N i i 1 2 (4) where [[ ( )r ti⃗ − ⃗ri(0)]2 is the mean square displacement of solute and the ⟨⟩ brackets stand for average over time. The summation extends to all solute molecules in the simulation box.Five different binary systems have been studied by MD simulation: 2,2,2-trifluoroetanol (TFE), 2,2,3,3,3-pentafluoro-propan-1-ol (PFP), 2,2,3,3,4,4,4-heptafluorobutan-1-ol (HFB), perfluorooctanoic acid (PFOA), and perfluorooctanesulfonic acid (PFOS) in water. In the case of the two lightestfluorinated alcohols two different compositions (alcohol mole fractions, x1) were studied in the diluted limit: 0.001 and 0.005. The HFB + water system has been studied only at x1 = 0.001 since the experimental solubility of this alcohol is lower than 0.005 mole fraction. The systems were simulated using a total of 1000 molecules; 1 solute and 999 water molecules were used for x1=
0.001 and 5 solute molecule and 995 water molecules for x1= 0.005. For the 0.001 mole fraction, since a single solute molecule was present, the mixtures can be considered at infinite dilution. In the case of PFOS and PFOA, given their extremely low solubility, only the proportion 1/999 for solute/water molecules was studied. All binary mixtures were studied at three different temperatures: (283, 298, and 313) K.
To test a possible dependence of the diffusion coefficient on simulation box dimensions, simulations of the TFE + water system have also been performed with a total of 3000 molecules at all the temperatures studied for the alcohol mole fraction of 0.001. The differences in the average diffusion coefficients between the two sets of simulation results for each temperature were found to be within the simulation uncertainties. This is probably so because the solutions are very diluted. In more concentrated systems, larger simulation boxes with more water molecules would probably be needed.
To test the suitability of the molecular models used, the pure water andfluorinated alcohols were also simulated by MD. The liquid densities for all the systems and also the self-diffusion coefficients of water were obtained from the simulations. These results are reported and compared with experimental data from the literature in Table 1. In the case of water, the agreement with the experimental densities is remarkable (better than 0.02 %) at all temperatures, and the diffusion coefficients are also reasonably described, with a maximum deviation of around 10 %. It should also be noted that our results reproduce those by Abascal and Vega,28who proposed the model [(2.02± 0.02) × 10−9m2/s at 298 K, compared with 2.08 × 10⁻⁹m2/s from
Abascal and Vega]. For the fluorinated alcohols a maximum deviation of 3.4 % was obtained in the densities. The agreement is particularly good for HFB, with deviations lower than 0.5 %.
4. RESULTS AND DISCUSSION
The intradiffusion coefficients of 2,2,2-trifluoroethanol (1) in dilute water (2) solutions were experimentally determined for
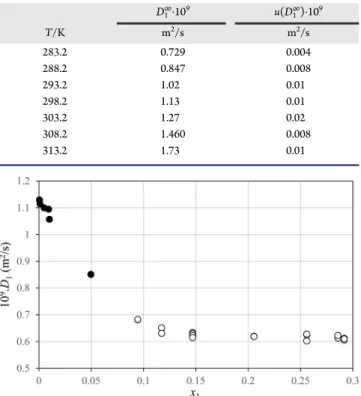
six different alcohol mole fractions (approximately 0.0005, 0.001, 0.005, 0.009, 0.01, and 0.05) at seven temperatures ((283.2, 288.2, 293.2, 298.2, 303.2, 308.2, and 313.2) K). The results are presented in Table 2 and shown in Figure 1. For
each temperature the intradiffusion coefficients as a function of composition werefitted to polynomial functions, from which an estimation of the diffusion coefficients at infinite dilution was obtained by extrapolation. These are presented in Table 3.
The only study that could be found in the literature reporting diffusion coefficients for the TFE + water mixture is that of Harris et al.22 who used a tracer method to measure intradiffusion coefficients at 25 °C, for alcohol mole fractions between 0.094 and 0.77. Their results are compared with those obtained in this work in Figure 2. As can be seen, although Table 2. Intradiffusion Coefficients of 2,2,2-Trifluoroethanol (1) in Water (2)aand Their Standard Uncertainties (u) as a Function of Composition and Temperature atp = 0.1 MPa Determined by PFG-NMR Spin-Echo Technique
D1·109 u(D1)·109 D1·109 u(D1)·109 D1·109 u(D1)·109
T/K m2/s m2/s m2/s m2/s m2/s m2/s x1= 0.000511 x1= 0.001034 x1= 0.004989 283.2 0.732 0.005 0.718 0.003 0.691 0.003 288.2 0.843 0.008 0.844 0.004 0.801 0.005 293.2 1.017 0.005 0.998 0.002 0.967 0.003 298.2 1.13 0.01 1.115 0.008 1.100 0.003 303.2 1.28 0.02 1.270 0.009 1.231 0.009 308.2 1.44 0.01 1.462 0.009 1.406 0.008 313.2 1.71 0.01 1.711 0.008 1.662 0.008 0.009331 0.010080 0.049646 283.2 0.669 0.003 0.668 0.002 0.457 0.002 288.2 0.762 0.008 0.787 0.003 0.552 0.002 293.2 0.935 0.005 0.896 0.006 0.724 0.002 298.2 1.095 0.004 1.057 0.003 0.851 0.003 303.2 1.20 0.01 1.232 0.003 0.971 0.004 308.2 1.36 0.01 1.366 0.004 1.102 0.006 313.2 1.57 0.01 1.57 0.01 1.275 0.006
aStandard uncertainty for temperature: u(T) = 0.1 K.
Figure 1. Intradiffusion coefficients of 2,2,2-trifluoroethanol (1) in water (2) as a function of alcohol mole fraction at seven different temperatures: From bottom to top: 283.2 K; 288.2 K; 293.2 K; 298.2 K; 303.2 K; 308.2 K; 313.2 K. Filled symbols, experimental results; empty symbols, simulation results (at 283.2 K, 298.2 K, and 313.2 K). Lines, polynomialfittings.
covering different ranges of composition (our study is focused on the dilute region) the two sets of data are consistent. Our results confirm the steep increasing trend of the alcohol diffusion coefficient with the decreasing concentration, which is typical of many solutes in aqueous solutions. Moreover, our estimation for the diffusion coefficient at 298.2 K and infinite dilution [(1.13± 0.01)·109m2/s] confirms that of Harris et al. [(1.13 ± 0.02)·109 m2/s], obtained from a mutual diffusion
coefficient determination by the Taylor dispersion method. Since we have measured intradiffusion coefficients at different temperatures, an estimation of the average diffusion activation energy within the 283 K to 313 K temperature range can be obtained, assuming an Arrhenius-like behavior of the diffusion of TFE in water (eq 5).
= ⎜⎛− ⎟ ⎝ ⎞ ⎠ D A E RT exp 1 D D (5) Here AD is a pre-exponential factor and ED is the activation
energy of diffusion. An Arrhenius-like behavior was indeed found for all the compositions, and the diffusion activation energies obtained are thus average values for the temperature range considered. The results are shown in Figure 3 as a function of composition, including the estimation for infinite dilution.
As can be seen, the diffusion activation energies seem to present a general increasing trend with the increase of solute mole fraction. However, below x1= 0.01 this trend is not so clear, the values being almost constant (considering their error bars) around 20.8 kJ/mol. The fact that the activation energy reaches a plateau value for very dilute solutions seems
reasonable. This activation energy can be interpreted as the energy required for a molecule to go through the solvation shell. As at infinite dilution the solvation shell is only formed by water molecules, it is reasonable to expect that the activation energy tends to a constant value.
Simulation Results. Intradiffusion coefficients of 2,2,2-trifluoroethanol (TFE), 2,2,3,3,3-pentafluoropropan-1-ol (PFP), 2,2,3,3,4,4,4-heptafluorobutan-1-ol (HFB), perfluoro-octanesulfonic acid (PFOS), and perfluorooctanoic acid (PFOA) in water were obtained by computer simulation at (283, 298, and 313) K. In the case of the two lightest alcohols two molar fractions were studied (0.001 and 0.005). The solubility of HFB, PFOS, and PFOA in water is very low. As previously explained, these solutions were modeled with a simulation box containing one solute molecule and 999 water molecules. Since just one solute molecule is present this corresponds to infinite dilution.
Simulated intradiffusion coefficients of all the solutes in water are presented in Table 4 and shown in Figure 4. Those for TFE are compared with our own experimental results in Figure 1. As can be seen, the agreement between experimental and simulated results for TFE in water is remarkable at 283 K and 298 K and still very good at 313 K. These results suggest Table 3. Estimation of Intradiffusion Coefficients of
2,2,2-Trifluoroethanol (1) in Water (2) at Infinite Dilution and Their Standard Uncertainty
D1∞·109 u(D 1 ∞)·109 T/K m2/s m2/s 283.2 0.729 0.004 288.2 0.847 0.008 293.2 1.02 0.01 298.2 1.13 0.01 303.2 1.27 0.02 308.2 1.460 0.008 313.2 1.73 0.01
Figure 2. Intradiffusion coefficients of 2,2,2-trifluoroethanol (1) in water (2) as a function of alcohol mole fraction at 298.2 K. Filled symbols, this work; empty symbols, results from Harris et al.22
Figure 3.Diffusion activation energies (and their error bars) of 2,2,2-trifluoroethanol (1) in water (2) as a function of alcohol mole fraction in the 283 K to 313 K temperature range.
Table 4. Intradiffusion Coefficients of Five Solutes in Water at Three Different Temperatures Obtained by Computer Simulation (D·109, in m2/s)a T/K = 283 T/K = 298 T/K = 313 2,2,2-Trifluoroethanol x (TFE) = 0.001 0.74± 0.04 1.11± 0.06 1.60± 0.08 x (TFE) = 0.005 0.70± 0.03 1.07± 0.04 1.50± 0.04 2,2,3,3,3-Pentafluoropropan-1-ol x (PFP) = 0.001 0.53± 0.05 0.74± 0.06 1.09± 0.05 x (PFP) = 0.005 0.49± 0.02 0.60± 0.02 1.05± 0.03 2,2,3,3,4,4,4-Heptafluorobutan-1-ol x (HFB) = 0.001 0.46± 0.04 0.71± 0.07 1.00± 0.06 Perfluorooctanoic Acid
x (PFOA) = 0.001 0.31± 0.02 0.49± 0.04 0.67± 0.07 Perfluorooctanesulfonic Acid
x (PFOS) = 0.001 0.32± 0.02 0.47± 0.03 0.65± 0.04
aFor PFOS and PFOA the composition shown is the proportion
between solute and total molecules in simulation box and does not correspond to an experimentally feasible composition.
that both the model and the method used are suitable to describe the diffusion of TFE in water and encouraged us to attempt predicting the dynamic properties of aqueous solutions of the higher fluorinated alcohols and other fluorinated surfactants.
As can be seen in Figure 4, the diffusion coefficients of the studiedfluorinated alcohols obtained by simulation follow the expected trend TFE > PFP > HFB in line with the solute molecular weight. The diffusion coefficients of PFP and HFB are predicted to be quite close to each other. This behavior is experimentally observed for the hydrogenated alcohols, although less pronounced.
The simulated intradiffusion coefficients of PFOS and PFOA in water at one fixed proportion and three different temperatures are also shown in Figure 4. Two important remarks should be made. First of all, it should be stressed that due to the extremely low solubility of these solutes their diffusion coefficients in water would be very difficult to obtain experimentally. On the other hand, both PFOA and PFOS are acids with pKabetween 2.3 and 3.445and−3.346respectively, which implies that in water they are partially dissociated. In the case of PFOS, the ionic form is even dominant in water; for PFOA the molecular form should predominate, although at infinite dilution dissociation increases. The estimation obtained by simulation is strictly for the molecular form, and is, therefore, just one of the contributions to the total effect. Assuming that ionic species show lower diffusion coefficients in water, the simulated value represents an upper bound to the total mobility of both substances. A similar comment could be made for the studiedfluorinated alcohols, although their acidic character is extremely low (e.g., pKa= 12.4 for TFE47).
It is also interesting to note that the intradiffusion coefficients of PFOS and PFOA in water are very close to each other at all temperatures, which seems to indicate that the length and mass of thefluorinated segment (similar in both substances) is the dominant factor to their mobility, rather than the nature of the terminal group. Furthermore, as previously explained, at infinite dilution it is also reasonable to accept that diffusion is controlled by the structure and interactions with the solvent.
In Figure 5 the diffusion coefficients of TFE, PFP, and HFB in water at 298.2 K are compared with those for ethanol,48,22
1-propanol,48−51and 1-butanol48,51from the literature. It must be stressed that in Figure 5 our results, as well as those of Harris et al., are intradiffusion coefficients while the other refers to mutual diffusion coefficients. The comparison is legitimate, however, as only dilute solutions are considered. As can be seen, at this temperature, allfluorinated alcohols display lower diffusion coefficients than their hydrogenated counterparts, 8% lower in the case of TFE/ethanol at infinite dilution. At other temperatures this difference is more difficult to evaluate due to the dispersion of the results in the literature.
Diffusion activation energies for TFE, PFP, HFB, PFOS, and PFOA were also calculated from our simulation results and are shown in Figure 6. Also included in thefigure are the EDvalues
for TFE in water from our experimental results in the same composition range as the simulation calculations. For this Figure 4.Intradiffusion coefficients for 2,2,2-trifluoroethanol (circles),
2,2,3,3,3-pentafluoropropan-1-ol (triangles), 2,2,3,3,4,4,4-heptafluoro-butan-1-ol (squares), perfluorooctanesulfonic acid (crosses), and perfluorooctanoic acid (bars) in water as a function of temperature, obtained by simulation. Filled symbols, x1= 0.001; empty symbols, x1
= 0.005. For PFOS and PFOA the results correspond to a proportion 1 solute molecule in 999 solvent molecules.
Figure 5.Diffusion coefficients of alcohols in water as a function of alcohol mole fraction at 298.15 K. Redfilled symbols, ethanol: squares, ref 48 (mutual diffusion coefficients); triangles, ref 22 (intradiffusion coefficients). Black and gray filled symbols, 1-propanol: squares, ref 50; circles, ref 48; triangles, ref 49; gray circle, ref 51 (all mutual diffusion coefficients). Blue filled symbols, 1-butanol: squares, ref 51; circles, ref 48 (both mutual diffusion coefficients). Empty symbols, fluorinated alcohols from this work: red, TFE; black, PFP; blue, HFB (all intradiffusion coefficients).
Figure 6. Diffusion activation energies of TFE (circles), PFP (triangles), HFB (squares), PFOS (cross), and PFOA (gray bar) in water at the same temperature range, obtained by simulation. Filled circles: TFE in water from experimental results.
system, the average value of the diffusion activation energy obtained from the experimental results at the lowest concentrations is, as stated above, 20.8 ± 0.5 kJ/mol, while that obtained from the simulations is around 18.8± 0.5 kJ/mol. The agreement between the two values can be considered very good, especially if we realize that this quantity is a derivative property, obtained from the temperature dependence of the diffusion coefficient. The estimated ED values for the other
fluorinated alcohols, PFP and HFB, as well as for PFOS and PFOA, are all very similar, ranging from 17.5± 0.5 kJ/mol to 19.1± 0.5 kJ/mol, suggesting that, as previously explained, for infinitely diluted solutions, the diffusion activation energy depends mainly on the solvent. This line of reasoning is further supported by comparing the diffusion activation energies at infinite dilution for the studied fluorinated substances with those for their hydrogenated counterparts from the literature (Figure 7). As can be seen, the diffusion activation energies of
TFE and ethanol are virtually the same, while those of PFP and HFB seem to be only marginally lower than the corresponding values for 1-propanol and 1-butanol.
■
CONCLUSIONSIntradiffusion coefficients of dilute water solutions of several fluorinated alcohols and surfactants with environmental
relevance have been obtained experimentally and by computer simulation.
For 2,2,2-trifluoroethanol + water solutions intradiffusion coefficients have been measured experimentally by the PFG-NMR spin−echo technique as a function of temperature and composition. The measurements focused on the dilute region, extending the range of compositions studied in the literature and, for the first time, included the study of the temperature dependence.
Additionally, intradiffusion coefficients of 2,2,2-trifluoroetha-nol in water were obtained by molecular dynamics and found to closely reproduce the experimental results. For 2,2,3,3,3-pentafluoropropan-1-ol and 2,2,3,3,4,4,4-heptafluorobutan-1-ol solutions, intradiffusion coefficients were obtained by molecular dynamics simulations as a function of composition and temperature. These are thefirst estimations of such a property for those systems.
Molecular dynamics simulations were also used to calculate the intradiffusion coefficients of perfluorooctanesulfonic acid (PFOS) and perfluorooctanoic acid (PFOA) in water at infinite dilution and as a function of temperature, which are very difficult to obtain experimentally due to the very low solubility of these substances.
Diffusion activation energies were estimated for all the solutes in water, from the dependence of the intradiffusion coefficients on temperature.
■
ASSOCIATED CONTENT*
S Supporting InformationOPLS-AA force field potential functions and respective parameters for all the compounds studied. This material is available free of charge via the Internet at http://pubs.acs.org.
■
AUTHOR INFORMATIONCorresponding Authors
*E-mail: [email protected].
*E-mail: efi[email protected]. Fax: + 351 8417246.
Funding
P.M. acknowledges funding from Fundação para a Ciência e Tecnologia (FCT) in the form of a postdoctoral grant (No. SFRH/BPD/81748/2011). L.F.G.M. and J.P.P.R. also acknowl-edge funding from FCT through the grant PEst-OE/QUI/ UI0619/2011. We also thank FCT for the funding of the NMR facility through RECI/QEQ-QIN/0189/2012.
Notes
The authors declare no competingfinancial interest.
■
REFERENCES(1) Buck, R. C.; Franklin, J.; Berger, U.; Conder, J. M.; Cousins, I. T.; de Voogt, P.; Jensen, A. A.; Kannan, K.; Mabury, S. A.; van Leeuwen, S. Perfluoroalkyl and Polyfluoroalkyl Substances in the Environment: Terminology, Classification, and Origins. Integr. Environ. Assess. Manage. 2011, 7, 513−541.
(2) Giesy, J. P.; Kannan, K. Global Distribution of Perfluorooctane Sulfonate in Wildlife. Environ. Sci. Technol. 2001, 35, 1339−1342.
(3) Hansen, K. J.; Clemen, L. A.; Ellefson, M. E.; Johnson, H. O. Compound-Specific, Quantitative Characterization of Organic: Fluo-rochemicals in Biological Matrices. Environ. Sci. Technol. 2001, 35, 766−770.
(4) D’Hollander, W.; de Voogt, P.; De Coen, W.; Bervoets, L. Perfluorinated Substances in Human Food and Other Sources of Human Exposure. Rev. Environ. Contam. Toxicol. 2010, 208, 179−215. (5) Haukås, M.; Berger, U.; Hop, H.; Gulliksen, B.; Gabrielsen, G. W. Bioaccumulation of Per- and Polyfluorinated Alkyl Substances (PFAS) Figure 7.(a) Diffusion activation energies as a function of temperature
for ethanol (filled symbols and lines) and TFE (empty symbol) in water at infinite dilution. Solid line, ref 51; dashed line, ref 57; square, ref 58; circle, ref 59; triangle, ref 60; empty circle, TFE (this work). (b) Experimental diffusion activation energies as a function of temperature for 1-propanol (filled symbol49and black line51) and 1-butanol (gray
line, ref 51) in water at infinite dilution. Simulated diffusion activation energies as a function of temperature for PFP (empty triangle), HFB (empty square), PFOS (cross), and PFOA (gray bar) in water at infinite dilution (this work). Lines, EDas a function of temperature;
in Selected Species from the Barents Sea Food Web. Environ. Pollut. 2007, 148, 360−371.
(6) Martin, J. W.; Whittle, D. M.; Muir, D. C. G.; Mabury, S. A. Perfluoroalkyl Contaminants in a Food Web from Lake Ontario. Environ. Sci. Technol. 2004, 38, 5379−5385.
(7) Taniyasu, S.; Kannan, K.; Horii, Y.; Hanari, N.; Yamashita, N. A Survey of Perfluorooctane Sulfonate and Related Perfluorinated Organic Compounds in Water, Fish, Birds, and Humans from Japan. Environ. Sci. Technol. 2003, 37, 2634−2639.
(8) Björklund, J. A.; Thuresson, K.; de Wit, C. A. Perfluoroalkyl Compounds (PFCs) in Indoor Dust: Concentrations, Human Exposure Estimates, and Sources. Environ. Sci. Technol. 2009, 43, 2276−2281.
(9) Ericson, I.; Marti-Cid, R.; Nadal, M.; van Bavel, B.; Lindstrom, G.; Domingo, J. L. Human Exposure to Perfluorinated Chemicals through the Diet: Intake of Perfluorinated Compounds in Foods from the Catalan (Spain) Market. J. Agric. Food Chem. 2008, 56, 1787− 1794.
(10) MacDonald, M. M.; Warne, A. L.; Stock, N. L.; Mabury, S. A.; Solomon, K. R.; Sibley, P. K. Toxicity of Perfluorooctane Sulfonic Acid and Perfluorooctanoic Acid to Chironomus Tentans. Environ. Toxicol. Chem. 2004, 23, 2116−2123.
(11) Ding, G.; Peijnenburg, W. J. G. M. Physicochemical Properties and Aquatic Toxicity of Poly- and Perfluorinated Compounds. Crit. Rev. Env. Sci. Technol. 2013, 43, 598−678.
(12) Shankar, A.; Xiao, J.; Ducatman, C. Perfluoroalkyl Chemicals and Chronic Kidney Disease in US Adults. Am. J. Epidemiol. 2011, 174, 893−900.
(13) Min, J. Y.; Lee, K. J.; Park, J. B.; Min, K. B. Perfluorooctanoic Acid Exposure Is Associated with Elevated Homocysteine and Hypertension in US Adults. Occup. Environ. Med. 2012, 69, 658−662. (14) European Union.. Directive 2006/122/EC of the European Parliament and of the Council. Off. J. Eur. Union 2006, 49, 32.
(15) European Union.. Directive 2013/39/EU of the European Parliament and of the Council. Off. J. Eur. Union 2013, 56, 1.
(16) Yan, T.; Chen, H.; Jiang, F.; Wang, X. Adsorption of Perfluorooctane Sulfonate and Perfluorooctanoic Acid on Magnetic Mesoporous Carbon Nitride. J. Chem. Eng. Data 2014, 59, 508−515. (17) Conn, P. M., Ed. Molecular Biology of Protein Folding, Part A; Academic Press: London, 2008.
(18) Rochester, C. H.; Symonds, J. R. Densities of Solutions of 4 Fluoroalcohols in Water. J. Fluorine Chem. 1974, 4, 141−148.
(19) Denda, M.; Touhara, H.; Nakanishi, K. Excess Molar Enthalpies for (Water +α Fluoroalkanol). J. Chem. Thermodyn. 1987, 19, 539− 542.
(20) Cooney, A.; Morcom, K. W. Thermodynamic Behavior of Mixtures Containing Fluoroalcohols. 1. (Water + 2,2,2-Trifluoroetha-nol). J. Chem. Thermodyn. 1988, 20, 735−741.
(21) Burakowski, A.; Gliński, J.; Czarnik-Matusewicz, B.; Kwoka, P.; Baranowski, A.; Jerie, K.; Pfeiffer, H.; Chatziathanasiou, N. Peculiarity of Aqueous Solutions of 2,2,2-Trifluoroethanol. J. Phys. Chem. B 2012, 116, 705−710.
(22) Harris, K. R.; Newitt, P. J.; Derlacki, Z. J. Alcohol Tracer Diffusion, Density, NMR and FTIR Studies of Aqueous Ethanol and 2,2,2-Trifluoroethanol Solutions at 25 Degrees C. J. Chem. Soc. Faraday Trans. 1998, 94, 1963−1970.
(23) Suja, F.; Pramanik, B. K.; Zain, S. M. Contamination, Bioaccumulation, and Toxic Effects of Perfluorinated Chemicals (PFCs) in the Water Environment: A Review Paper. Water Sci. Technol. 2009, 60, 1533−1544.
(24) Duarte, P.; Silva, M.; Rodrigues, D.; Morgado, P.; Martins, L. F. G.; Filipe, E. J. M. Liquid Mixtures Involving Hydrogenated and Fluorinated Chains: (p, ρ, T, x) Surface of (Ethanol + 2,2,2-Trifluoroethanol), Experimental and Simulation. J. Phys. Chem. B 2013, 117, 9709−9717.
(25) Wu, D.; Chen, A.; Johnson, C. S., Jr. An Improved Diffusion-Ordered Spectroscopy Experiment Incorporating Bipolar-Gradient Pulses. J. Magn. Reson. A 1995, 115, 260−264.
(26) Holz, M.; Weingartner, H. Calibration in Accurate Spin-Echo Self-Diffusion Measurements Using H−1 and Less-Common Nuclei. J. Magn. Reson. 1991, 92, 115−125.
(27) Jorgensen, W. L.; Maxwell, D. S.; Tirado-Rives, J. Development and Testing of the OPLS All-Atom Force Field on Conformational Energetics and Properties of Organic Liquids. J. Am. Chem. Soc. 1996, 118, 11225−11236.
(28) Abascal, J. L. F.; Vega, C. A General Purpose Model for the Condensed Phases of Water: TIP4P/2005. J. Chem. Phys. 2005, 123, 234505−234512.
(29) Jorgensen, W. L.; Chandrasekhar, J.; Madura, J. D.; Impey, R. W.; Klein, M. L. Comparison of Simple Potential Functions for Simulating Liquid Water. J. Chem. Phys. 1983, 79, 926−935.
(30) Duffy, E. M. Ph.D. Thesis, Yale University, New Haven, CT, 1994.
(31) Chitra, R.; Smith, P. E. A Comparison of the Properties of 2,2,2-Trifluoroethanol and 2,2,2-2,2,2-Trifluoroethanol/Water Mixtures Using Different Force Fields. J. Chem. Phys. 2001, 115, 5521−5530.
(32) Watkins, E. K.; Jorgensen, W. L. Perfluoroalkanes: Conforma-tional Analysis and Liquid-State Properties from ab initio and Monte Carlo Calculations. J. Phys. Chem. A 2001, 105, 4118−4125.
(33) Pádua, A. A. H. Torsion Energy Profiles and Force Fields Derived From ab initio Calculations for Simulations of Hydrocarbon− Fluorocarbon Diblocks and Perfluoroalkylbromides. J. Phys. Chem. A 2002, 106, 10116−10123.
(34) Sunda, A. P.; Venkatnathan, A. Molecular Dynamics Simulations of Triflic Acid and Triflate Ion/Water Mixtures: A Proton Conducting Electrolytic Component in Fuel Cells. J. Comput. Chem. 2011, 32, 3319−3328.
(35) Singh, U. C.; Kollman, P. A. An Approach to Computing Electrostatic Charges for Molecules. J. Comput. Chem. 1984, 5, 129− 145.
(36) Schmidt, M. W.; Baldridge, K. K.; Boatz, J. A.; Elbert, S. T.; Gordon, M. S.; Jensen, J. H.; Koseki, S.; Matsunga, N.; Nguyen, K. A.; Su, S. J.; Windus, T. L.; Dupuis, M.; Montgomery, J. A. General Atomic and Molecular Electronic-Structure System. J. Comput. Chem. 1993, 14, 1347−1363.
(37) Hess, B.; Bekker, H.; Berendsen, H. J. C.; Fraaije, J. G. E. M. LINCS: A linear constraint solver for molecular simulations. J. Comput. Chem. 1997, 18, 1463−1472.
(38) Van Der Spoel, D.; Lindahl, E.; Hess, B.; Groenhof, G.; Mark, A. E.; Berendsen, H. J. C. GROMACS: Fast, Flexible and Free. J. Comput. Chem. 2005, 26, 1701−1718.
(39) Pronk, S.; Páll, S.; Schulz, R.; Larsson, P.; Bjelkmar, P.; Apostolov, R.; Shirts, M. R.; Smith, J. C.; Kasson, P. M.; van der Spoel, D.; Hess, B.; Lindahl, E. GROMACS 4.5: a High-Throughput and Highly Parallel Open Source Molecular Simulation Toolkit. Bio-informatics 2013, 29, 845−854.
(40) Berendsen, H. J. C. Transport properties computed by linear response through weak coupling to a bath. In Computer Simulations in Material Science; Meyer, M., Pontikis, V., Eds.; Kluwer: Norwell, MA, 1991; pp 139−155.
(41) Nosé, S. A Molecular-Dynamics Method for Simulations in the Canonical Ensemble. Mol. Phys. 1984, 52, 255−268.
(42) Hoover, W. G. Canonical Dynamics−Equilibrium Phase-Space Distributions. Phys. Rev. A 1985, 31, 1695−1697.
(43) Parrinello, M.; Rahman, A. Polymorphic Transitions in Single-Crystals−A New Molecular-Dynamics Method. J. Appl. Phys. 1981, 52, 7182−7190.
(44) Nosé, S.; Klein, M. L. Constant Pressure Molecular-Dynamics for Molecular-Systems. Mol. Phys. 1983, 50, 1055−1076.
(45) Rayne, S.; Forest, K.; Friesen, K. J. Computational Approaches May Underestimate pKa Values of Longer-Chain Perfluorinated
Carboxylic Acids: Implications for Assessing Environmental and Biological Effects. J. Environ. Sci. Health, Part A 2009, 44, 317−326.
(46) Brooke, D.; Footitt, A.; Nwaogu, T. A. Environmental Risk Evaluation Report: Perfluorooctanesulphonate (PFOS); Environmental Agency: London, 2004.
(47) Brown, W. H.; Iverson, B. L.; Anslyn, E.; Foote, C. S. Organic Chemistry, 7th ed.; Cengage Learning: London, 2013.
(48) Hao, L.; Leaist, D. G. Binary Mutual Diffusion Coefficients of Aqueous Alcohols. Methanol to 1-Heptanol. J. Chem. Eng. Data 1996, 41, 210−213.
(49) Pratt, K. C.; Wakeham, W. A. Mutual Diffusion-Coefficient for Binary-Mixtures of Water and Isomers of Propanol. Proc. R. Soc. London 1975, A342, 401−419.
(50) Harris, K. R.; Goscinska, T.; Lam, H. N. Mutual Diffusion-Coefficients for the Systems Water−Ethanol and Water Propan-1-ol at 25-Degrees-C. J. Chem. Soc. Faraday Trans. 1993, 89, 1969−1974.
(51) Tominaga, T.; Matsuomoto, S. Limiting Interdiffusion Coefficients of Some Hydroxylic Compounds in Water from 265-K to 433-K. J. Chem. Eng. Data 1990, 35, 45−47.
(52) Wagner, W.; Pruss, A. The IAPWS Formulation 1995 for the Thermodynamic Properties of Ordinary Water Substance for General and Scientific Use. J. Phys. Chem. Ref. Data 2002, 31, 387−535.
(53) Krynicki, K.; Green, C. D.; Sawyer, D. W. Pressure and Temperature-Dependence of Self-Diffusion in Water. Faraday Disc. Chem. Soc. 1978, 66, 199−208.
(54) Gillen, K. T.; Douglass, D. C.; Hoch, M. J. R. Self-Diffusion in Liquid Water to-31 Degrees C. J. Chem. Phys. 1972, 57, 5117−5119. (55) Cibulka, I.; Takagi, T. P−ρ−T Data of Liquids: Summarization and Evaluation. 8. Miscellaneous Compounds. J. Chem. Eng. Data 2002, 47, 1037−1070.
(56) Morgado, P.; Martins, L. F. G.; Filipe, E. J. M.; Unpublished results.
(57) Pratt, K. C.; Wakeham, W. A. Mutual Diffusion-Coefficient of Ethanol-Water Mixtures−Determination by a Rapid, New Method. Proc. R. Soc. London 1974, A336, 393−406.
(58) Easteal, A. J.; Woolf, L. A. Pressure and Temperature-Dependence of Tracer Diffusion-Coefficients of Methanol, Ethanol, Acetonitrile, and Formamide in Water. J. Phys. Chem. 1985, 89, 1066− 1069.
(59) Tyn, M. T.; Calus, W. F. Temperature and Concentration-Dependence of Mutual Diffusion-Coefficients of Some Binary-Liquid Systems. J. Chem. Eng. Data 1975, 20, 310−316.
(60) Van de Ven-Lucassen, I. M. J. J.; Kieviet, F. G.; Kerkhof, P. J. A. M. Fast and Convenient Implementation of the Tailor Dispersion Method. J. Chem. Eng. Data 1995, 40, 407−411.