Article
Printed in Brazil - ©2017 Sociedade Brasileira de Química0103 - 5053 $6.00+0.00*e-mail: [email protected]
Rice Husk Ash as Raw Material for the Synthesis of Silicon and Potassium
Slow-Release Fertilizer
Amanda A. França,a,b Juliana Schultz,a Roger Borges,a Fernando Wypycha and
Antonio S. Mangrich*,a,c
aDepartamento de Química, Universidade Federal de Paraná, Centro Politécnico,
CP 19081, 81531-980 Curitiba-PR, Brazil
bDepartment of Plant Nutrition, Technical University of Munich,
Emil-Ramann-Str. 2, 85354 Freising, Germany
cInstituto Nacional de Ciência e Tecnologia de Energiae Meio Ambiente (INCT-E&A),
40170-115 Salvador-BA, Brazil
Rice husk ash (RHA) is a waste material produced in large quantities in many regions worldwide, and its disposal can be problematic. This work describes a method for using RHA to synthesize silicon and potassium slow-release fertilizer. The extraction of silica from RHA was accomplished by alkaline leaching with KOH. Different KOH concentrations and reaction times were evaluated and the best production of K2SiO3 solution was achieved using 6 mol L-1 and 6 h, respectively. The fertilizer was synthesized by the reaction of K2SiO3 with KAlO2 in aqueous medium, followed by calcination at 500 °C. X-ray fluorescence (XRF) and X-ray diffraction (XRD) analyses indicated that the fertilizer composition was similar to mineral kalsilite. Solubility essays indicated lower K+ and Si4+ release percentage in neutral medium. Kinetic mechanisms of release tests can be well explained by the pseudo-second order model. The proposed synthesis seems to be a viable process offering economic and environmental benefits.
Keywords: rice husk ash, silicon, potassium, slow-release fertilizer
Introduction
Nowadays, one of the most important goal of agronomic management is the development of environmental-friendly fertilizers, which promote a sustainable nutrient
management to ensure growth crop yield.1 One method of
reducing fertilizer nutrient losses involves the use of slow-release fertilizers, which have been designed to gradually release nutrients to plants at a rate to coincide with the requirement of crops. The advantages of using slow-release fertilizers instead of the conventional type are various, such as the increased efficiency of the fertilizer, the continuous supply of nutrients for a prolonged period and a decrease of nutrient losses by volatilization and leaching out to surface and ground water.2,3
Potassium (K) is known as one of the most required nutrient during plant growth. K plays an important role in the energy state of the plant, translocation and storage
of assimilates and maintenance of water in plant tissues.4 For many crops, silicon (Si) is also an important nutrient and its availability to plants is often associated to increase of crop yield.5
Plants under intensive cultivation that require high absorption of Si, such as rice, sugar cane, and grasses in general, can quickly deplete the soluble Si content of soil. This element, therefore, needs to be replaced by fertilization. The application of Si fertilizer can influence plants in two ways: (i) by improvement of the fertility and chemical properties of the soil, and (ii) by direct effects on
plant growth and development.6 Positive effects that have
been reported include improved plant structure, such as upright leaves and stems,7 and increased resistance to fungi and insects due to deposition of Si under the plant cuticle.8
The high Si content of rice husk ash (RHA) has led to interest in its use as a source of Si for plants and for
the production of numerous Si-based materials.9 RHA is
to produce heat and steam required for the drying and parboiling of the rice grains. RHA contains high levels of silica (87-97%), as well as some alkalis (1-5%).9-11
The rice processing industry is a very important sector of global agribusiness and generates around 200 tons of
waste biomass for every 1000 tons of harvest grains.12
Therefore, rice husk and RHA can be easily obtained in large quantities and are cheap raw materials, so their use is an attractive way of avoiding environmental problems due to improper disposal, while at the same time increasing profit margins. Furthermore, the agricultural use of a product containing RHA enables the recovery of valuable elements that were used previously for crop fertilization.
The aim of this study was therefore to develop a method to prepare a slow-release fertilizer containing silicon and potassium, using RHA as the raw material.
Experimental
Chemical reagents
All chemical reagents used in this study were analytical grade. Solutions were prepared using bidistilled water.
Characterization of raw material and products
Chemical characterization of RHA and the produced fertilizers was performed using X-ray fluorescence (XRF) analysis of compressed tablets of the samples, employing a PANalytical Axios Max spectrophotometer.
The pulverized samples were analyzed by X-ray powder diffraction (XRD), employing a Shimadzu
XRD-6000 diffractometer, with Cu Kα radiation
(λ 1.5418 Å), dwell time of 2 degree min-1, voltage of
40 kV and current of 30 mA, at the interval 2θ from
10 to 80° and 0.02 degree per step. The samples were
placed and oriented by gently hand pressing on neutral glass sample holders. The qualitative phase analysis was performed with X’Pert HighScore software package (Philips, Netherlands) and the minerals were identified by comparison with the data bank of the International Centre for Diffraction Data (ICDD). The Rietveld refinement was applied to the RHA diffraction pattern in order to estimate the silica crystallinity index.13 The refinement was carried
out using the GSAS/Expgui software.14,15
Silica extraction from RHA
The silica was obtained by adding KOH (Sigma-Aldrich, Brazil) solution to RHA in a polypropylene beaker
(150 mL), using a ratio of 4.0 mL KOH per g of RHA,
under heating (70 ºC) and vigorous stirring, as described
by Kalapathy et al.16 The mass of RHA used in each
mixture was 5.0 g. In order to identify the best conditions for the reaction, an evaluation was made of different KOH concentrations (1, 2, 4, 6, 8 and 10 mol L-1) and reaction times (1, 2, 4 and 6 h). After allowing the solution to cool at room temperature (25 °C), it was filtered using a quantitative filter paper (grade 54, Whatman) and the liquid potassium silicate was stored in a sealed polypropylene bottle (50 mL).
Quantification of silica content
Content of silica in the potassium silicate solution was quantified after its precipitation induced by the
dropwise addition of 5 mol L-1 HCl solution (Vetec,
Brazil). The precipitation of silica began when the pH of the solution decreased to below pH 10. After reaching pH ca. 7.0, the mixture was centrifuged at 3500 rpm (relative centrifugal force of 1068.56 × g) for 10 min. The supernatant was discarded, water was added to the centrifuge tube, and the material was centrifuged again. This procedure was repeated three times. The solid gel separated by centrifugation was oven-dried at 110 °C for 24 h. Precipitated silica was characterized by XRF in order to avoid weighing errors resulting from possible contamination with the by-product potassium sulfate salt, which can remain even after repeated washings. The XRF measurements were performed in a Philips model PW2400. The results were interpreted with the semi-Q Philips software and were normalized to 100%. All assays were performed in triplicate.
Experimental design and statistical analysis
Precipitated silica yielded from RHA (η(%)) was
determined using the following equation 1:
(1)
The silica mass in RHA was determined by using XRF, as described above.
Synthesis of fertilizers
Potassium silicate solution was produced using the best extraction conditions previously selected. The fertilizers FERT1 and FERT2 were synthesized by reaction between solutions of potassium silicate as obtained
above and potassium aluminate (KAlO2), as described by
Fernandes et al.17 (modified). KAlO
2 solution was prepared by reacting 50.0 g of aluminum scrap and 1.0 L of KOH solution (1.0 mol L-1), performed in polypropylene beaker (2000 mL) under an extraction hood due to the release of hydrogen gas. The solution was stored in a sealed polypropylene bottle (1500 mL).
FERT1 synthesis was performed using 120.0 mL of potassium silicate solution and 100.0 mL of potassium aluminate solution, under continuous stirring at 70 °C. After formation of a gel, manual agitation with a polypropylene stick was continued for a further 5 min. The produced gel was filtered in a qualitative filter paper (grade 5, Whatman), washed with distilled water and subsequently dried in an oven at 110 °C for 24 h. A portion of FERT1 was calcined at 500 °C for 4 h in a muffle furnace, with heating from room temperature (25 °C) to 500 °C at a rate of 10 °C min-1 to produce FERT2.
Study of fertilizer release
A preliminary evaluation was made in order to quantify the solubility of K from FERT1 and FERT2. The assay was performed at 25 °C in a temperature-controlled incubator from Tecnal model TCM44. In a beaker (250 mL), 1.00 g of fertilizer was added to 200 mL of distilled water. The mixtures were kept in the incubator for 6 h, without stirring, followed by filtration using quantitative filter paper (ashless, grade 40, Whatman). The retained solid material was discarded, and the filtered solution was analyzed using a Digimed flame photometer model NK-2000 to determine the potassium ion content, being the essay performed in triplicate. The calibration of the flame photometer was done by using a potassium standard solution in different concentrations.
An additional solubility test was performed with the fertilizer that showed the best result, i.e., the one that presented lower rate of potassium release. Fertilizer solubility curves were built using six different times: 3, 6, 12, 24, 36 and 48 h, and three different solvents:
bidistilled water, 0.1 mol L-1 citric acid solution and
0.5 mol L-1 hydrochloric acid solution, as described by
Mangrich et al.18 Citric acid solution was used in order to simulate the organic acids present in soil solutions. Portions (1.0 g) of the dry fertilizer samples were added to 150 mL
of HCl solution, 150 mL of citric acid solution or 200 mL of bidistilled water. The mixtures were prepared in three different beakers (250 mL) and kept in an incubator during the different test period.19 The mixtures were subsequently filtered using a quantitative filter paper (ashless, grade 40, Whatman), the retained solid material was discarded, and the filtered solution was stored in a refrigerator.
Measurements of the K and Si contents of the filtered solutions were performed using an inductively coupled plasma optical emission spectrometry (ICP OES equipment from Varian model 720-ES). The following ICP OES parameters were used: argon, RF generator power of
1.2 kW, plasma gas flow rate of 15 L min-1, auxiliary gas
flow rate 1.5 L min-1, nebulizer pressure of 200 kPa and
solution uptake rate of 2 mL min-1. Calibration solutions
were prepared from serial dilutions of ICP-standard of Si and K (SpecSol). The concentration of the calibration
solution ranged from 2.5 to 25.0 mg L-1. Each calibration
curve was obtained by using six calibration solutions with different concentrations. The emission lines for the analysis by ICP OES were chosen according to previous interference studies that were 766.491 nm for K and 251.611 nm for Si. Calibration was checked initially and then after the analysis of every 20 samples, and in case of deviation of more than 10%, the equipment was recalibrated.
In order to describe the potassium and silicon release behavior from the fertilizer in bidistilled water, citric acid solution and hydrochloric acid solution, kinetic parameters were calculated using the results of the solubility tests performed as described above. The study of the sorption kinetics can provide valuable insights into the reaction
pathways and into the mechanism of sorption reactions.20
Three different models were tested in order to assess which one was the most suitable for describing the kinetic mechanism. The models used in the investigation were the pseudo-first order,21 pseudo-second order22 and intra-particle diffusion.23 The equations corresponding to each model are presented in Table 1.
Results and Discussion
Raw material characterization
The concentrations of chemical elements (expressed in their oxide forms) present in RHA were determined using XRF analysis. As expected, the main component of
the RHA was silica (SiO2) with 92.3% content. The root
mean square (RMS) of the XRF results was 0.035. The sum before normalization was 86.5%.
1.4 and 0.7% of RHA, respectively. Other oxides were from the soil pool and included calcium (0.8%), magnesium (0.4%), manganese (0.2%) and sodium (0.1%). The concentrations of CO2, Al2O3 and Fe2O3 were 3.9, 0.2 and 0.1%, respectively.
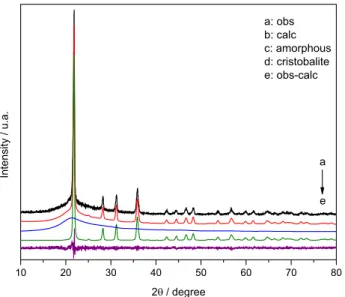
The X-ray diffraction pattern of RHA (Figure 1) stands together with the results of the calculation using the Rietveld method. As shown in Figure 1, RHA essentially consisted of amorphous silica and cristobalite. The occurrence of crystallization in some parts of RHA was due to the high temperatures reached during the firing, above 800 °C, at which crystallization is likely to start in RHA silica.24
The numerical indicators that measure the quality of the fits between the intensities are the Bragg (Rwp) and expected (Rexp) factors. The Rwp measures the quality
of the fit between the observed and calculated intensities, while the Rexp measures the quality of the collected intensities. In this study, the indicator values were 11.13 and 9.84% for Rwp and Rexp, respectively. Since the Rwp and Rexp values were close (Rwp / Rexp ratio of 1.1311), the refinement is considered satisfactory. The Rietveld analysis indicated that the percentage of amorphous silica and cristobalite was of 47 and 53%, respectively, with lattice parameters a = b = 4.989 ± 0.006 Å and
c= 6.953 ± 0.008 Å.
Quantification of silica obtained from RHA
The amounts of silica precipitated from RHA under the different reaction conditions are shown in Figure 2. The average quantity of precipitated silica varied according to the treatment used and increased with reaction time for all KOH concentrations up to 6 mol L-1. For concentration
greater than 6 mol L-1, the amount of precipitated silica
became almost constant. The maximum precipitation yield was 98% of the RHA silica.
Statistical analysis
The results obtained in the silica precipitation tests were compared by ANOVA analysis, which revealed significant differences between the average yields. Tukey’s test for comparison of averages was applied and the results are shown in Figure 2.
The treatments with higher yield of silica, which did not differ significantly (identified by the letters aA in Figure 2) Table 1. Linearized form of the equations of the used kinetic models
Kinetic model Linearized form
Pseudo-first order
Pseudo-second order
Intra-particle diffusion
t: time; qe: ion desorbed at equilibrium time t; qt: ion desorbed at time t;
k: desorbed rate constant; C: ion concentration in solution.
Figure 2. Quantification of precipitated silica in terms of mass and
percentage extraction yield for different reaction periods (1, 2, 4 and 6 h), and KOH solution concentrations. The small letters represent the Tukey’s test applied to the average of the precipitated silica in the tests performed in triplicate. Averages followed by the same letters (lower case letters for KOH solution concentrations and upper case letters for reaction period) are not significantly different at the 95% level.
were concentration × time: 6 mol L-1 × 6 h; 8 mol L-1 × 6 h and 10 mol L-1 × 6 h. Hence, the treatment using 6 mol L-1 of KOH solution and a reaction time of 6 h was chosen as the first step of the fertilizer synthesis.
Preliminary study of potassium release
The preliminary study of fertilizer solubility was performed in the flame photometer. The average concentrations of potassium found in the solubility tests
were 746.3 ± 25.1 and 503.33 ± 5.7 mg L-1 for FERT1 and
FERT2, respectively. For a period of 6 h, FERT2 showed a lower percentage of potassium release (29.6%) compared to FERT1 (43.9%), indicating that the heat treatment used for FERT2 synthesis was able to decrease K release in water for 6 h by about 67.5%.
In recent studies, lower rates of potassium release were obtained by using higher calcination temperature. Mangrich et al.25 prepared a kalsilite-type (α-K2MgSi3O8) mineral structure from mixtures of potassium carbonate (commercial salt), lime shale and oil-shale fines, using a calcination process at 900 °C. The solubilities of the
product, expressed as a percentage of K2O, were 30.3%
in 0.5 mol L-1 HCl, 23.2% in 0.1 mol L-1 citric acid and 6.9% in H2O. Ma et al.26 synthesized a hexagonal kalsilite with an irregular blocky morphology through a sintering process, by heating at 900 °C for 2 h. The solubilities of K2O from K2MgSi3O8 in 0.50 mol L-1 HCl and 0.10 mol L-1 citric acid solutions were 38.94 and 23.58%, respectively. For this reason, the calcination process proved to be an important step during the development of the fertilizer with slow-release behavior.
As the aim of this work was to develop a fertilizer with slow-release properties, therefore only the chemical characterization of FERT2 is described in this paper.
Fertilizer characterization
The results of XRF analysis showed that the silica content of the FERT2 fertilizer was 38.0%. The potassium and aluminum contents, expressed in terms of oxides, were 33.9 and 24.8%, respectively. The concentrations of other elements determined were 3.1, 0.1 and 0.1% of CO2, P2O5 and Na2O, respectively.
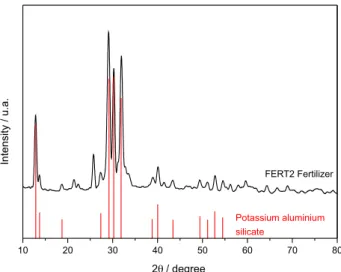
The X-ray diffraction pattern of FERT2 shown in Figure 3 presents the main diffraction peaks and intensities coincident with the structure of hydrated potassium
aluminum silicate (KAlSiO4.5H2O).27 This mineral,
known as kalsilite, is classified as a feldspathoid, which is a group of minerals chemically similar to feldspars, but with lower proportions of silica. They are characterized as
being unsaturated in silica and rich in alkalis.28 The other peaks with lower intensity were not identified by using X’Pert HighScore software package.
Si and K release studies
The results of the ICP OES analysis of solubilized Si and K in the liquid extracts are shown in Figure 4 and Figure 5. The Si release curve indicated lower solubility in a neutral medium, around to 0% (Figure 4). The release of Si was higher in both acid solutions, reaching around 50% for 48 h. Approximately 32% of the potassium were into water as K+ ions for a 48 h period (Figure 5). In acidic solution, the release of K+ was higher, with almost total release in citric acid solution. The slower solubility of the fertilizer in the citric acidic solution indicates that it is a characteristic of the initial attack. However, thermodynamically, the citric Figure 3. X-ray diffraction pattern of FERT2. The lower bars indicate
the diffraction peaks of the potassium aluminium silicate (code: 38-0216 in X’Pert HighScore), described by Kosorukov and Nadel27 (ICDD
reference pattern).
acid is better than HCl due to the formation of more stable complex (C6H5K3O7).26
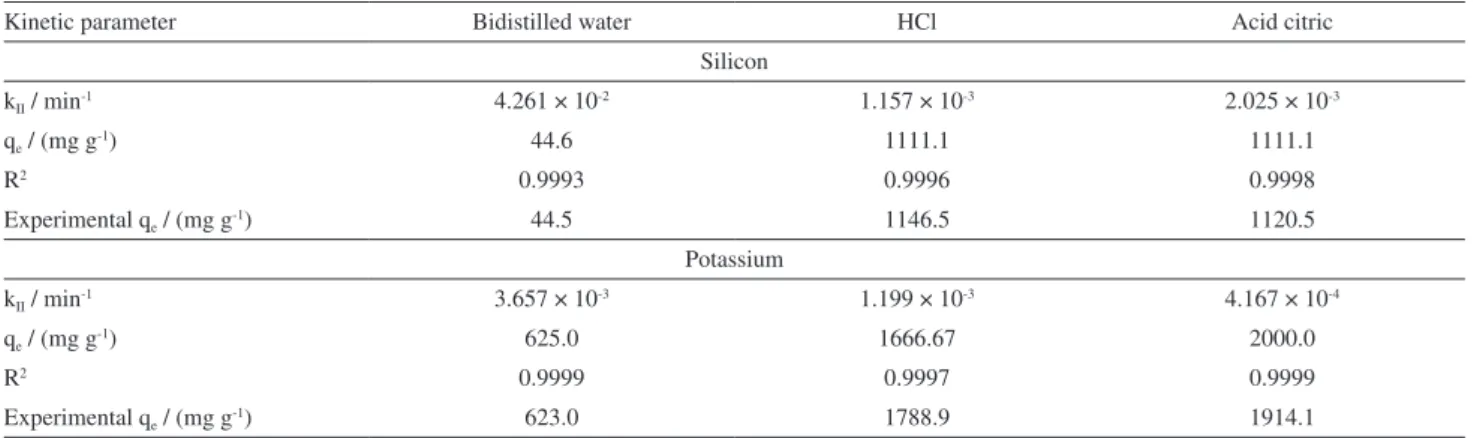
The kinetic parameters calculated and measured in order to describe the behavior of Si and K release from FERT2 are shown in Table 2. The pseudo second-order model provided the best correlation to describe the release mechanism of Si and K into the three different liquid extracts. In addition, this model also fits the experimental data well, i.e., qe (ion desorbed at equilibrium time) values calculated from linear form are in accordance with experimental qe values for both elements studied, especially in bidistilled water. The kinetic parameters for Si release in bidistilled water indicated a slower behavior than in acid solutions, as can be seen in Figure 4. This behavior can be explained because acid solutions have higher concentration of hydrogen ion that can react with silicate producing silicic acid, which is the most soluble form of Si. Citric acid solution, even if diluted, has relatively high acidity (pH ca. 2.3).
The desorbed constant rates (k) for K release essays in bidistilled water and HCl have close values on the same
scale of magnitude, whereas the test in acid citric presented the smaller rate of all essays (Table 2 and Figure 5). In pure
water, the experimental and calculated K+ release were
smaller probably due to the possible similarity between
the structures of FERT2 and kalsilite (KAlSiO4) mineral,
as shown in Figure 3. This mineral is formed by Si–O–Al
bonds between silicon-oxygen (SiO4) and
aluminum-oxygen (AlO4–) tetrahedrons. The potassium ions form
chemical bonds with oxide ions (O2–) from the tetrahedrons, hence becoming strongly bonded to the structure and difficult to release.
Conclusion
The findings of this study demonstrate the potential of RHA as a raw material to synthesize a Si and K slow-release fertilizer. The process used to extract the silica from RHA was able to precipitate more than 95% of the silica. The fertilizer synthesized has a chemistry composition and X-ray diffraction pattern similar to the hydrated potassium aluminum silicate (KAlSiO4.5H2O), known as kalsilite. The essays of Si and K release from the fertilizer in bidistilled water, citric acid and hydrochloric acid solutions showed a small solubility of the fertilizer in neutral environment. In acid solutions, the releases of Si and K were higher, with more than 50% of Si release and almost total K release in 48 h. The pseudo second-order model was suitable for describing the kinetic mechanism, being the coefficient of determination greater than 0.9993 for all essays. Since RHA is a waste generated in large quantities and can cause environmental issues due to improper disposal, the developed process seems to be a viable way of using RHA waste and metal filings, offering considerable environmental benefits. The product here prepared took into consideration knowledge of chemical structure and environmental care. In our view, the use of a waste to Figure 5. FERT2 release curves for K using three solutions: distilled water,
hydrochloric acid (0.5 mol L-1) and citric acid (0.1 mol L-1).
Table 2. Kinetic pseudo-second order model for Si and K nutrient release
Kinetic parameter Bidistilled water HCl Acid citric
Silicon
kII / min-1 4.261 × 10⁻² 1.157 × 10⁻³ 2.025 × 10⁻³
qe / (mg g-1) 44.6 1111.1 1111.1
R2 0.9993 0.9996 0.9998
Experimental qe / (mg g-1) 44.5 1146.5 1120.5
Potassium
kII / min-1 3.657 × 10⁻³ 1.199 × 10⁻³ 4.167 × 10⁻⁴
qe / (mg g-1) 625.0 1666.67 2000.0
R2 0.9999 0.9997 0.9999
Experimental qe / (mg g-1) 623.0 1788.9 1914.1
produce fertilizer is a rational approach for the crucial task of food and renewable energy efficient production.
Acknowledgments
Financial support for this work was provided by Conselho Nacional de Desenvolvimento Científico e Tecnológico (CNPq) and Coordenação de Aperfeiçoamento de Pessoal de Nível Superior (CAPES). The authors are grateful to Empresa Urbano Agroindústria from the city of Jaraguá do Sul (Santa Catarina, Brazil) for providing the rice husk ash used in this study.
References
1. Ni, B.; Liu, M.; Lü, S.; Xie, L.; Wang, Y.; J. Agric. Food Chem.
2011, 59, 10169.
2. Chawakitchareon, P.; Anuwattana, R.; Buates, J. In Advanced Materials: Manufacturing, Physics, Mechanics and Applications
- Springer Proceedings in Physics; Parinov, I. A.; Chang, S.-H.; Topolov, V. Y., eds.; Springer International Publishing Switzerland: Cham, Switzerland, 2016, p. 129-137.
3. Wu, L.; Liu, M.; Ind. Eng. Chem. Res.2007, 46, 6494. 4. Amtmann, A.; Rubio, F. In eLS; John Wiley & Sons, Ltd: New
York, USA, 2001. DOI: 10.1002/9780470015902.a0023737. 5. Guntzer, F.; Keller, C.; Meunier, J.-D.; Agron. Sustainable Dev.
2012, 32, 201.
6. Epstein, E.; Ann. Appl. Biol.2009, 155, 155.
7. Epstein, E.; Proc. Natl. Acad. Sci.U. S. A.1994, 91, 11. 8. Dayanandan, P.; Kaufman, P. B.; Franklin, C. I.; Am. J. Bot.
1983, 70, 1079.
9. Sun, L.; Gong, K.; Ind. Eng. Chem. Res.2001, 40, 5861. 10. Champagne, E. T.; Rice: Chemistry and Technology, 3rd ed.;
American Association of Cereal Chemists: St. Paul, Minnesota, USA, 2004.
11. Pode, R.; Renewable Sustainable Energy Rev.2016, 53, 1468. 12. Chandrasekhar, S.; Satyanarayana, K. G.; Pramada, P. N.;
Raghavan, P.; Gupta, T. N.; J. Mater. Sci.2003, 38, 3159. 13. Rietveld, H. M.; J. Appl. Crystallogr.1969, 2, 65.
14. Larson, A. C.; Von Dreele, R. B.; Report LAUR 86-748: General Structure Analysis System (GSAS); Los Alamos National Laboratory: Los Alamos, NM, USA, 2004.
15. Toby, B. H.; J. Appl. Crystallogr.2001, 34, 210.
16. Kalapathy, U.; Proctor, A.; Shultz, J.; Bioresour. Technol.2002, 85, 285.
17. Fernandes, A. A.; Frajndlich, E. U. C.; Riella, H. G.; Mater. Sci. Forum2005, 498-499, 676.
18. Mangrich, A.; Tessaro, L.; Anjos, A. D.; Wypych, F.; Soares, J.; Environ. Geol.2001, 40, 1030.
19. Helrich, K.; Official Methods of Analysis of the Association of Official Analytical Chemists, Food Composition, Additives, Natural Contaminants, vol. 2; AOAC: Arlington, VA, USA, 1990.
20. Ho, Y. S.; McKay, G.; Process Biochem.1999, 34, 451. 21. Ho, Y. S.; McKay, G.; Water Res.1999, 33, 578. 22. Ho, Y. S.; McKay, G.; Water Res.2000, 34, 735.
23. Karthikeyan, T.; Rajgopal, S.; Miranda, L. R.; J. Hazard. Mater.
2005, 124, 192.
24. Kapur, P. C.; Powder Technol.1985, 44, 63.
25. Mangrich, A.; Tessaro, L.; Anjos, A. D.; Wypych, F.; Soares, J.; Environ. Geol.2001, 40, 1030.
26. Ma, X.; Ma, H.; Yang, J.; Ind. Eng. Chem. Res.2016, 55, 10926. 27. Kosorukov, A. A.; Nadel, L. G.; Russ. J. Inorg. Chem.1985, 7,
961.
28. Gregorkiewitz, M.; Li, Y.; White, T. J.; Withers, R. L.; Sobrados, I.; Can. Mineral.2008, 46, 1511.
Submitted: February 27, 2017