M
ASTER
A
CCOUNTING
,
T
AXATION AND
C
ORPORATE FINANCE
M
ASTER
´
S
F
INAL
W
ORK
D
ISSERTATION
R
EAL EARNINGS
M
ANAGEMENT
:
STATE
-
OWNED VS NON
-
STATE
-OWNED COMPANIES
I
VO
F
ILIPE
G
ONÇALVES
G
OMES
M
ASTER
A
CCOUNTING
,
T
AXATION AND
C
ORPORATE FINANCE
M
ASTER
´
S
F
INAL
W
ORK
D
ISSERTATION
R
EAL EARNINGS
M
ANAGEMENT
:
STATE
-
OWNED VS NON
-
STATE
-OWNED COMPANIES
I
VO
F
ILIPE
G
ONÇALVES
G
OMES
S
UPERVISION:
P
ROFESSORAD
OUTORAC
RISTINAB
ELMIRAG
AIOM
ARTINS DAS
ILVAiii
The study has the purpose of analysing the degree of real earnings management in state and non-state-owned firms, taking into account the potential effects of crisis periods. The sample is composed of 15.147 companies, 995 state-owned and 14.152 non-state-owned, from 22 European countries and 8 industry sectors, from the years of 2008 to 2017. Following the Roychowdhury (2006) methodology the results show that state-owned firms have a higher degree of real earnings management when compared with non-state-owned. Additionally, the size, debt and growth opportunities were seen to influence the practice of real earnings management. Finally, the results show that the crisis periods have a positive influence on the practice of real earnings management.
KEYWORDS: Real earnings management, state-owned enterprises, non-state-owned companies, financial crisis, Europe.
iv
O propósito deste estudo é analisar o grau de gestão de resultados com base em operações reais nas empresas estatais e não estatais, tendo em consideração os potênciais efeitos de períodos de crise. A amostra é composta de 15.147 empresas, 995 das quais estatais, de 22 países euopeus, 8 setores de indústria e durante os anos de 2008 a 2017. De acordo com a metodologia desenvolvida por Roychowdhury (2006), os resultados demonstram que as empresas privadas praticam mais gestão de resultados com base em operações reais, quando comparadas com as empresas não estatais. Adicionalmente, a dimensão, o endividamento e as oportunidades de crescimento de uma empresa foram vistas como fatores de influencia na pratica de gestão de resultados. Finalmente, os resultados demonstram que os períodos de crise têm uma influência positiva na prática de gestão de resultados.
Palavras-chave: Gestão de resultados com base em operações reais, empresas estatais, empresas não estatais, crise, Europa.
v
Abstract ... iii
Resumo ... iv
Table of Contents... v
Glossary ... vii
Table of Figures ... viii
Acknowledgments ... ix
1. Introduction ... 1
2. Literature review ... 3
2.1 Earnings management... 3
2.2 The incentives of earnings management practices ... 5
2.3 Real earnings management ... 8
2.4 The influence of state ownership and political connections on earnings management ... 9
3. Hypothesis development: ... 12
3.1 State ownership and REM ... 12
3.2 Financial crisis and REM ... 14
4. Methodology ... 14
4.1. Sample characterization ... 14
4.2 The measures of REM ... 16
4.3 Empirical model ... 17
5. Results ... 20
5.1. Descriptive statistics ... 20
5.2. T-student test for SOE and NSOE ... 20
vi
6. Additional analysis ... 24
6.1. The effects of Swedish SOEs ... 24
6.2. The effects of growth opportunities... 25
6.3. The effects of indebtedness ... 27
7. Conclusion ... 28
7. References ... 30
vii SOE – State-owned enterprises
NSOE – Non-State-owned companies. CFO – Cash-flow from operations. OLS – Ordinary Least Squares. SOX - Sarbanes–Oxley Act.
SG&A – Selling, general and administrative expenses. R&D – Research and development.
ROA – Return on assets. CEO – Chief executive officer.
viii
TABLE I – Variables descriptive statistics. ... 20
TABLE II– T-student test. ... 20
TABLE III – Pearson’s correlation matrix ... 21
TABLE IV– Model regression. ... 22
Table V– Regression excluding Swedish companies……….. ... 24
TABLE VI – The effects of growth opportunities ... 25
ix
First, I want to thank Professor Cristina Gaio for her encouragement and guidance. I want to thank my parents for their unconditional support.
I am thankful to Matilde, for her invaluable help.
Finally, I want to thank my friends and colleagues who accompanied me through this journey.
1 1.INTRODUCTION
The purpose of accounting is to inform its users and to facilitate their decision process (Healy and Wahlen, 1999). Accounting standards were created to promote transparent and reliable information that portraits the true and appropriate image of a given company. It is important to state, however, that these standards are not rigid. In fact, they possess some degree of flexibility, allowing companies to make choices in regards to the measurement, recognition and disclosure of their assets and liabilities.
Earnings have been demonstrated to play an important role, since they reflect a firm’s economic performance for a specific period (Graham, Harvey and Rajgopal, 2005). Managers use the flexibility of the accounting standards to manipulate the reported earnings, with the purpose of demonstrating a positive image of the firm, to accomplish specific objectives and to meet analyst expectations. This practice is called Earnings management (EM) and it is the focus of this study.
The practice of earnings management has a rich body of literature. This is mainly due to the financial scandals that have occurred since the beginning of the 2000’s, as evidenced by Enron and WorldCom. In fact, most research has focused on the practice of accruals-based earnings management (AEM), which comprises the use of accrual accounting to manipulate the company’s earnings (Dechow and Skinner, 2000). Conversely, real earnings management (REM) uses the company’s activities as a way of changing the disclosed earnings. Both practices have been shown to have a negative impact on a company’s future performance (Gunny, 2005; Cupertino, Martinez and Costa Jr, 2016) and it has also been shown to exist a trade-off between them (Zang, 2012).
The work of authors such as Graham et al. (2005), and Bruns et al. (1990), demonstrated that financial executives indicate a greater willingness to manipulate earnings through real activities (REM) rather than accruals (AEM). Also, market and institutional pressures to meet earnings targets such as zero earnings, previous periods’ earnings and analyst forecasts act as an incentive to the use of these practices (Graham et al. 2005).
In addition, state ownership is associated with decreasing quality in reported earnings (Ben-Nasr, Boubakri and Cosset, 2015). Taking this into account, it is important to study if there is a distinction in the degree of these practices when considering state and
non-2
state-owned companies. Therefore, the objective of this study is to determine if there is a greater extent of REM in SOEs or NSOEs.
The study also took into account the possible effects of economic stability in REM, given the fact that it has been shown that periods of economic crisis are associated with a significant decrease in the degree of EM (Filip and Raffournier, 2014).
In fact, the study of the behaviour of SOEs, particularly during periods of economic crisis, is very important, as they face greater scrutiny and pressure to perform. Contrarily, one can state that stricter tax regulations, that are commonly introduced during these periods, do not weigh as heavily on state-owned firms as they do on their non-state-owned counterparts. This dichotomy leads to the increased interest and importance of studying how the extent of REM may differ between these two types of ownership structures.
The sample of this study is composed of 15.147 companies, 995 SOEs and 14.152 NSOEs, from 22 countries and 8 sectors. The Roychowdhury (2006) methodology was used to develop the measurement of REM practices taking into account a firm’s cash-flow from operations.
The main motivation of this study is related to the fact that this practice has been shown to be increasingly used by companies to manipulate their reported earnings. Additionally, it is important to study the behaviours of SOEs and compare them with their non-state-owned counterparts. Finally, the lack of any convergence in the existing body of literature, creates an interest to further investigate the topic.
The study is divided in 7 parts. Chapter 2 contains the literature review, followed by the hypothesis development in Chapter 3. Chapter 4 contains the explanation of the model and its different variables, chapter 5 has the results of the statistical analysis, chapter 6 the additional analysis and, finally, chapter 7 is the conclusion of the study.
3
2. LITERATURE REVIEW 2.1 Earnings management
The earnings reported by a company in a given period are a reflection of its economic performance and contribute to the decision process of its many users (Graham et al. 2005). As such, the management of reported earnings is used to modify financial information in an attempt to transmit a specific message.
According to Healy et al. (1999) “Earnings management occurs when managers use judgement in financial reporting and in structuring transactions to alter financial reports to either mislead some stakeholders about the underlying economic performance of the company or to influence contractual outcomes that depend on reported accounting practices”. EM can also be defined as “…a purposeful intervention in the external financial reporting process, with the intent of obtaining some private gain (as opposed to, say, merely facilitating the neutral operation of the process) …” (Schipper, 1989). However, it is important to refer that earnings management should be within the barriers of the accounting rules (Dechow and Sloan, 1996) and should not be confused with any fraudulent activity. Specifically, fraud occurs when the actions practiced go beyond the limits of what is defined in the accounting rules. Besides leading to a loss of precision in assessing the economic situation of a firm, it also creates asymmetry of information between managers and shareholders. In addition, it has been linked to hindrance of a firm's future economic performance and financial stability (Gunny, 2005; Cupertino et al., 2016).
As previously presented, there are two types of earnings management practices. AEM, or accruals earnings management, refers to the use of accrual accounting to manipulate a company’s reported earnings. As Dechow et al. (2000) stated, this practice is achieved by the choices of methods and accounting estimates that depend on the manager’s judgement. On the other hand, REM, or real earnings managements, refers to the use of real activities as a way to manipulate the disclosed earnings. Concretely, Roychowdhury (2006) defined it as “departures from normal operational practices motivated by managers’ desire to mislead at least some stakeholders into believing certain financial reporting goals have been met in the normal course of operations.”
There are multiple ways to manage earnings through operating activities. Executives may use price discounts to temporarily increase sales, overproduction to
4
report decreased cost of goods sold, and reduction of discretionary expenditures to improve reported margins (Roychowdhury, 2006). Other methods of manipulating earnings using real activities are acceleration of sales, alterations in shipment schedules, and delaying R&D and other discretionary expenses (Dechow et al., 2000; Gunny, 2005). Additionally, there is evidence that investors' expectations, as reflected in stock prices, do not recognize the consequences of myopic R&D investment and the strategic timing of asset sales, which may explain why the practice of REM has become more prevalent when compared with AEM (Gunny, 2005).
The relationship between financial executives and these two types of practices are quite different, as evidenced by the work of authors such as Graham et al. (2005) With the use of a questionnaire, they found that executives are more willing to manipulate earnings through real activities rather than accruals, and that they prefer reducing discretionary expenditures and/or capital investments than engaging in other manipulating methods.
Additionally, Bruns et al. (1990) surveyed managers about the morality of earnings management and found that, on average, they view managing short-term earnings by accounting methods as significantly less acceptable than accomplishing the same ends by changing or manipulating operating decisions or procedures, suggesting that managers prefer to manipulate earnings using REM practices. They also found that increasing profits by offering extended credit terms is seen as less acceptable than selling excess assets or using overtime to increase shipments.
A possible reason for the increased willingness to use REM practices instead of AEM is that accrual manipulation is more likely to draw auditor or regulatory scrutiny and there is increased risk in relying solely in this type of earnings manipulation (Roychowdhury, 2006). Roychowdhury (2006), showed that auditors and regulatory bodies need to broaden the types of procedures and areas of focus as a way to guarantee the decrease of these practices. Zang (2012) also showed the influence of accounting scrutiny on EM practices. Specifically, the author provides evidence for how managers trade off REM and AEM. When AEM is constrained due to a greater level of scrutiny of accounting practices post-SOX, firms use REM to a greater extent. The results also show that firms use more AEM and less REM practices, when the latter is costlier for them,
5
either due to having a less competitive status in the industry or by being in worse financial conditions. This, again, shows a clear trade-off between these two types of practices.
As seen above, the introduction of the Sarbanes–Oxley Act played an important role in the decision process of financial executives. Cohen, Dey and Lys (2008) found that AEM had increased steadily from 1987 until the passage of the SOX act in 2002, and then decreased significantly. Contrarily, the level of REM practices declined prior to SOX and increased significantly after its passage, which suggests that firms switched from AEM to REM after the passage of this act.
2.2 The incentives of earnings management practices
Apart from SOX, there are other factors that influence the degree of REM. As previously indicated, the incentive of meeting earnings targets, such as the earnings forecast of analysts, plays a major role in influencing managers’ willingness to practice earnings management (Graham et al. 2005) . This shows how market pressures and other institutional factors can shape firm’s incentives to report earnings that reflect their intended economic performance. However, non and state-owned firms respond quite differently to these pressures. Burgstahler et al. (2006) found that NSOEs exhibit higher level of EM in comparison to SOEs, and that non and state-owned firms responded differently to institutional factors, such as outsider investor protection, and capital market structure.
Another incentive for the use of earnings management practices is the need to avoid earnings decreases and losses (Burgstahler and Dichev, 1997). The authors presented two possibilities to explain this result. First, managers might want to avoid reporting earnings decrease and losses in order to decrease the costs imposed on the firm in transaction with shareholders. Second, they postulate that, based on prospect theory, managers might have an aversion to absolute and/or relative losses. Specifically, prospect theory postulates that individuals’ value functions are concave for gains and convex for losses, where gains and losses are measured, not in absolute terms, but rather relative to their reference point. Additionally, it was found that the desire to raise external financing at lower costs, as a way to avoid debt covenant restrictions, could be a major incentive towards the practice of earnings management (Dechow et al., 1996). The desire to decrease a company’s financing costs propel managers to present an improved version of its economic performance.
6
One specific practice of earnings management is income smoothing. This practice is defined as “the deliberate dampening of fluctuations about some level of earnings which is considered to be normal for the firm” (Barnea, Ronen and Sadan, 1976). This behaviour can be influenced by the company’s ownership structure, the executive’s incentive structure and by the firm’s profitability (Carlson and Bathala, 1997). Specifically, the authors found that the lower the proportion of inside ownership the higher the probability of a firm being an income smoother, and that firms with higher proportions of institutional ownership and debt financing have a greater willingness to manipulate their earnings using these practices. This shows that, the wider the dispersion of stock ownership, the greater the possibility of income smoothing and provides a greater understanding of how the executive’s compensation can influence their willingness to alter earnings.
When referring managers’ incentive to prioritize their job security it is also important to analyse how their tenure can have an effect to the degree of earnings management. Ali and Zhang (2015) predicted that, in the early years of their service, when markets were more uncertain of their ability, they have a greater incentive to overstate earnings to favourably influence others’ perception of their capabilities. Therefore, as expected, there is more overstatement of earnings in the early years than in the later years of service, and that this overstatement increases reported return on assets by about 25%, on average.
As seen, the ownership structure of a company may have an effect on the capability of financial executives to perform earnings management practices. Additionally, poor oversight of management through weak governance structures has been shown to be an important catalyst for earnings manipulation (Dechow et al., 1996). This provides an understanding of how ownership and governance structures can play an important role in the process to achieve greater quality of reported earnings.
As mentioned, a consequence of earnings management is the increased asymmetry of information between managers and shareholders. Nevertheless, in economies where there already exists a certain degree of asymmetry, and where there are high monitoring costs, these types of practices are more frequently used (Ferreira, Carvalho and Pinho, 2011). Contrarily, economies with dispersed ownership, strong investor protection, and large stock markets exhibit lower levels of earnings management (Leuz, Nanda and
7
Wysocki, 2003). In fact, the ownership structure and concentration has a close relationship with the degree of earnings management. Ding, Zhang and Zhang (2007) found that these two characteristics follow an inverted U shape pattern: when the ownership concentration is low, the agency cost is high and, therefore, the degree of earnings management is greater. Notwithstanding, when the ownership concentration reaches a high level, large shareholders become the true owners of the firm, and are more likely to seek to preserve its future growth potential, thus having an alignment effect on the information asymmetry.
Burgstahler et al. (2006) found that a strong legal system could be associated with less earnings manipulation in either state or non-state-owned firms. Additionally, these authors found that these types of practices are more pronounced in countries that have weaker legal systems and enforcement, which confirms the central role of institutions and their enforcement mechanisms. Their evidence shows that countries with highly developed equity markets lead to a decrease earnings management practices by state-owned firms. This demonstrates that strong capital markets improve earnings informativeness. In contrast, strong capital markets might also incentivize firms to launch an IPO (initial public offering) or even an SEO (seasonal public offering), which have been linked to income-increasing earnings management (Cohen and Zarowin, 2010; Ahmad-Zaluki, Campbell and Goodacre, 2011). Another consequence of increased market strength is that firms might be incentivized to participate in income-decreasing real earnings management before making a stock repurchase (Cooper, Downes and Rao, 2018), in the attempt to decrease the stock price, allowing them to repurchase their shares at a lower value. This demonstrates that strong markets might have positive and negative effects on the degree of earnings management practiced by companies.
There is evidence that the economic conditions of a given country can play a major role in defining REM. Filip et al. (2014) found that there is a significant decrease in income smoothing and an improvement of accrual quality during the crisis period. Countries with economic hardships usually have stricter rules and increased tax burdens, which restricts a company’s capacity to manipulate their reported earnings. Nonetheless, it can be stated that in these situations the focus of EM practices can be the reduction of taxes to be paid. The authors also show that national characteristics such as law
8
enforcement and corporate governance quality can explain country differences in income smoothing.
2.3 Real earnings management
Roychowdhury (2006) found that that there is a negative association between institutional ownership and the presence of sophisticated investors with the extent of REM practices. This also demonstrates how investor scrutiny and board structure can have an important effect on the quality of financial information.
Regarding this idea, Ferreira et al. (2011) provided evidence of how board monitoring imposes short-term pressures on managers, which in turn leads to managerial short-sighted decisions and opportunistic behaviour of REM. This contradicts the findings presented in the previous paragraph, and leads to the insight of the possible positive and negative effects of board and investor scrutiny. In addition, Ge (2009) postulates that managers tend to manipulate earnings via changing the timing and/or scale of the operating transactions to obtain personal benefit, and that these activities are sub-optimal and detrimental to firm value.
Aggressive REM practices have been linked to reduced future operating performance (Gunny, 2005) and a negative impact on ROA, which demonstrates that the manipulation of real operating activities has a negative relation to future returns (Cupertino et al., 2016). Specifically it is possible to determine that aggressive price discounts, which are used to increase sales volumes and meet short-term earnings targets, can lead customers to form incorrect expectations of future discounts, which implies a lower margin on future sales (Roychowdhury, 2006). Additionally, the increased overproduction can generate excess inventories that have to be sold in subsequent periods and imposes greater inventory holding costs for the company (Roychowdhury, 2006).
The negative impact related to practicing real activities manipulation is not only associated with future earnings. Greiner, Kohlbeck and Smith (2017) showed that aggressive REM practices, excluding abnormal reductions in SG&A, are associated with high current and future audit fees. Their interpretation is that this relationship is driven, in part, by the increase of the perceived business risk. Risk, in fact, plays a major role in the definition of future auditing fees, and on the extent of procedures to be done during the audit engagement. Additionally, there is evidence that REM is linked to negative
9
implications for auditors, showing a higher likelihood of auditor resignations when aggressive REM is observed (Kim, Yongtae; Park, 2014).
The board characteristics, such as independence, size, frequency of meetings and CEO/Chair duality, have been shown to be associated with the reduction of REM practices (Zgarni, Halioui and Zehri, 2014). This demonstrates, yet again, that the board plays a key role in the reduction of these practices. Additionally, it was shown that key subordinate executives have the incentive and ability to constraint the extent of real earnings management (Cheng, Lee and Shevlin, 2016). The authors, found that the effect of internal governance is stronger in more complex firms, where key subordinate executives have a more important role, stronger in firms where the CEO is less powerful and weaker in firms where the capital markets benefit of meeting earnings benchmarks is higher. This is consistent with the notion that redistributing the responsibilities between the subordinate executives, instead of focusing them on the CEO, can play an important role in the reduction of REM practices and the improvement of internal governance.
In fact, internal governance has been proven more effective in constraining real earnings management for firms where the chief executive officers have greater career concerns and, therefore, have a greater willingness to manage earnings (Cheng et al., 2016). Lastly, Huang and Sun (2017) showed that there is a clear relation between managerial ability and REM. Specifically, the authors showed that the most able managers use less activities-based earnings management, and that they reduce the negative impact of REM on the future firm performance. They also found that high-ability managers appear to choose accrual-based earnings management over REM, which contraries the information presented by Graham et al. (2005) and Bruns et al. (1990).
2.4 The influence of state ownership and political connections on earnings management
Considering that the topic of this study regards the extent of REM practices in SOEs, and its comparison to NSOEs, it is important to understand how political influences and state ownership can have an effect on the quality of the reported earnings. In fact, unlike typical shareholders, governments tend to achieve social goals and short-term political objectives rather than maximizing profits (Shleifer and Vishny, 1994).
There is evidence that state ownership is associated with lower earnings quality while foreign ownership is associated with higher earnings quality (Ben-Nasr et al., 2015). Specifically, these authors found that foreign ownership is associated with
10
improved earnings quality in countries with better government stability and lower risk of government expropriation.
Profitability and operating efficiency has also been shown to decrease as a consequence of state-ownership (Boubakri et al., 2009). However, the authors state that this effect can be moderated by the presence of sound institutional and political environment. In addition, they postulate that, although state ownership has negative effects on profitability, these are less pronounced in countries with right-wing governments as opposed to left-wing governments. This provides a deeper understanding on how different political perspective can shape the behaviours and decisions of companies.
Following privatization, governments have been shown to continue to be the controlling shareholder of at least 28% of firms (Boubakri et al., 2009) specifically they maintain a tight grip and close oversight on strategic industries as they either hold golden shares or appoint politicians on the boards of newly privatized firms. This need to maintain a tight grip, following privatization, is evidence that governments want to continue to have an influence in the decision process of privatized firms. These authors also demonstrate that, following privatization, companies usually face a period of significant improvements in profitability, operating efficiency and capital expenditures (Boubakri et al., 2009). In addition, it has been proven that politicians are more likely to privatize inefficient firms, since they continue to give bribes in exchange of subsidies (Shleifer et al., 1994).
Politically connected firms are defined by Zang (2006) as firms that, at some point, had, as a major shareholder or top director, a member of parliament, a minister or head of state, or a firm that is tightly related to either a politician or party, have also been proven to have a negative effect on the quality of reported accounting information (Chaney, Faccio and Parsley, 2011). Chaney, Faccio and Parsley (2011) argued two possible reasons for the negative effect on the quality of financial information. First, it may be that connected companies intentionally disclose information with lower quality, in the attempt to mislead investors, and for the benefit of insiders. Second, the protection these companies enjoy may lead them to devote less time and care to manage their discretionary accruals and expenses. This shows that the negative effect of low earnings quality on the cost of debt only influences non-politically connected firms, which points
11
out that connected companies face little negative consequences for their lower quality disclosures.
Politically connected firms have also been shown to be less likely to have publicly traded debt or equity securities abroad. This suggests that connections and global financing are, in fact, substitutes (Leuz and Oberholzer-Gee, 2006). The authors’ explanation is that well connected firms have access to preferential financing at home and therefore do not need to access foreign capital markets. Another potential explanation is that these companies dislike the increased transparency and scrutiny that comes from having publicly traded securities. This shows that politicians exert their influence and allow companies to more easily access financing opportunities that could not be achieved abroad.
It has been shown that politicians follow EM practices in such a way as to avoid reporting negative earnings (Ferreira et al., 2013). In fact, politicians aim to report earnings that will not be interpreted by citizens as excessive, which shows that they aim to demonstrate that the public resources, for which they are responsible, are managed according to economic and efficiency principles. The results obtained by these authors also support the idea that, during pre-election period, there is a higher predisposition to manage earnings, specifically when there are strong political competitors. This demonstrates that politicians, in the same way as managers, are incentivized by their personal job security.
Companies who are politically connected also have been shown to be more likely to substitute REM for AEM than non-connected firms (Braam et al., 2015). In particular, when public monitoring and the risk of detection increases, firms have a larger incentive to substitute REM for AEM strategies, with the intention to manage and mask the gains derived from their political connections (Braam et al., 2015). In addition, the results show that political connections play a significant role in explaining the variance in firm’s choices of earnings management strategies. When compared to non-connected firms, these are more likely to substitute relatively costlier and less detectable earnings management strategies for AEM strategies. This is in line with the existent literature regarding managers’ preference for real earnings management.
12
3.HYPOTHESIS DEVELOPMENT: 3.1 State ownership and REM
As seen, state ownership has been shown to negatively affect the quality of reported earnings (Ben-Nasr et al., 2015), and is associated with a higher degree of earnings management practices. Authors, such as Ferreira et al. (2013), have demonstrated that these practices occur in SOEs with the intention to avoid reporting negative earnings, as a way to signal proper management of public resources. Apart from SOEs, firms that have strong political connections have also been demonstrated to have low quality reported earnings (Chaney, Faccio and Parsley, 2011). One possible explanation may be that political connections provide a sense of protection for these firms, which may lead them to devote less time in preparing their financial information. Additionally, Bai et al. (2004) demonstrated that having the largest shareholder be the government has a negative effect on market valuation. Contrarily, having high concentration of non-controlling shareholding and issuing shares to foreign investors positively contributes to an increase in a given company’s valuation.
Ding, et al. (2007), examined the relationship, in Chinese listed firms, between earnings management practices and the ownership structure, particularly if the company is non-state-owned or state-owned. The authors provide evidence that the earnings management practices of Chinese listed firms are influenced by these firms’ ownership concentration. Their analysis shows that non-state-owned listed firms favour earnings boosting methods more than their state-owned counterparts. Contrarily, Bai et al. (2004) demonstrated that EM practices are more prevalent in state-owned firms. The possible explanation provided by the authors is that SOEs have other goals besides the maximization of profit. The intention to maximize employability and social stability might lead the state to see these companies as means to fulfil their own objectives and demonstrate a positive performance. This will lead to a greater acceptability to these types of practices.
This explanation follows the proposed justification presented by Shleifer et al. (1994), which argued that, unlike regular investors, governments tend to emphasize achieving social goals and short-term political objectives, instead of focusing on the maximization of profit. It is evident that job security plays a key role on the extent of EM practices.
13
Contrary to these findings, Wang and Yung (2011), studied the impact of state ownership on earnings management using a panel sample of Chinese publicly traded firms and found lower levels of accrual-based earnings management among state-owned corporations than non-state firms even after controlling for tunnelling activities. For the authors, the fact that state enterprises have better earnings quality brings into question the conventional belief that state ownership is the root of all sorts of corporate inefficiencies. One possible explanation for this might be the fact that the government might have reduced the manager’s willingness to manipulate firm-specific information in state firms. Further investigation indicates that the divergence in earnings quality between SOEs and NSOEs becomes less evident as the economy becomes more and more market driven.
In terms of the EM practices trade-off, Braam et al. (2015) have shown that politically connected firms are more likely to substitute REM for AEM, when compared with non-connected firms. The authors postulate that this may be because these practices are less subjected to auditor scrutiny. This study also shows politically connected firms are more likely to substitute costlier and less detectable EM strategies for accrual-based EM strategies. This aligns with the given explanation and shows how political connection can explain the variance in firm’s choices of EM practices. Capalbo et al. (2014) also found evidence that the level of state ownership is positively correlated with accrual-based earnings management.
Chen et al. (2011) examined how differences in audit quality affect earnings management and cost of equity capital for SOEs and NSOEs. The authors find that NSOEs exhibit a greater reduction in EM relative to SOEs when they employ auditors with greater quality. They also found that SOEs exhibit significantly lesser reduction in the cost of equity capital than their non-state-owned counterparts, when considering the work of high-quality auditors.
Considering this, it is important to determine if there is an association between state owned companies and REM practices. Therefore, the main hypothesis of this study is:
H1: There is an association between state ownership and real earnings management.
According to Cohen et al., (2010), Zang (2012) and Zamri, Rahman and Isa (2013) the abnormal levels of cash-flow from operations are a consequence of mangers attempt to manipulate sales by the acceleration of sales timing and/or by granting increased price
14
discounts. This in term will affect the CFO by increasing them in the short-term. Additionally, companies with higher abnormal levels of CFO are associated with higher degrees of REM practices.
3.2 Financial crisis and REM
As seen, the stability of an economy can influence the degree of earnings management practiced. As shown by Filip et al. (2014), there is a significant decrease in the practice of EM in periods of economic crisis. The authors claim that countries that undergo economic hardships usually have stricter rules and increased tax burden, which restricts a firm’s capacity to manipulate their reported earnings. Another potential explanation is the fact that the market is more tolerant to weaker financial performance, creating an incentive to report losses during these periods.
However, Ferreira et al. (2013), argued that there is a lesser degree of tolerance towards state owned companies, during these periods, than there is to non-state held firms. This may be due to the fact that the firms are more stable and have an increasing pressure to properly manage public resources. Therefore, it is interesting to develop a deeper understanding of the effect of crisis periods on the extent of the earnings management practices by state-owned firms.
The following hypothesis is intended to test this effect, as such:
H2: There is an association between periods of economic crisis and the degree of
REM practices.
This hypothesis has the intent to determine if a positive association exists between periods of economic hardship and the degree of earnings manipulation practices.
4.METHODOLOGY 4.1. Sample characterization
The data has been extracted from the Amadeus databased and the selected time horizon is from 2008 to 2017. The study takes into consideration European state-owned and non-state held firms, with the exception of the financial, insurance and public administration industries. This follows the reasoning presented by Roychowdhury (2006).
15
SOEs were only considered if the state controlled more than 20% of the existing shares. Additionally, there was the elimination of small non and state-owned firms, in the attempt to have a more balanced sampled. The criteria used for elimination follows the (Oecd, no date)recommendation 2003/361/EC of the European commission, in which the entity defines micro, small and medium-sized enterprises as having a total annual balance sheet not exceeding 43 Million euros.
The sector segmentation followed the North American industry classification system (NAICS). In addition, the present study followed the guideline to preserve countries with, at least, 10 companies and, regarding the different sectors, there was the exclusion of sectors with less than 8 companies, as presented in Cohene et al. (2008). Finally, the outliers were excluded, considering the values between the percentile 1 and 99 of all the abnormal cash-flows.
The final sample is composed by 15.147 companies, 995 SOEs and 14.152 NSOEs, from 22 countries and 8 sectors. The distribution of the overall sample demonstrates that the United Kingdom (24.90%) and France (13.3%) are the countries that are more represented in the sample. In terms of NSOEs, the United Kingdom (26.56%) remains the most represented country. Following the United Kingdom, France (14.2%), Denmark (13.22%) and Italy (11.66%) are the countries with biggest representation. In terms of SOEs, Sweden (64.42%), followed by Denmark (13.17%) and Belgium (12.36%) are the most represented countries – Appendix 1.
The list of sectors defined by the NAICS code is available in appendix 2. Analysing this information is easy do see that the composition of the sample is similar when regarding non and state-owned companies. In terms of sectors we have NAICS 5 (48.0%) as the sector with the most representation, followed by NAICS 3 (17.0%) and NAICS 4 (15.6%) - Appendix 3.
In terms of listed companies, the United Kingdom (23,4%) and France (16,7%) are the most represented countries. Overall the number of publicly traded companies amounts to 10% of the sample. In regards to being audited by a Big4 firm, the United Kingdom (27,4%) and Sweden (13,5%) are the countries with the largest representation. All in all, the number of firms audited by the Big4 represent 56% of the sample – Appendix 4.
16
4.2 The measures of REM
This study follows the methodology used by Roychowdhury (2006) and applied in many other papers such as de Cohen et al. (2010), Zamri, Rahman and Isa (2013), Cohen et al.s (2008) and Gunny( 2010). Additionally, the Dechow et al. (1998) methodology was used to derive normal levels of CFO for every firm-year. Deviations from the normal levels are termed abnormal CFO. The methodology is based on the analysis of abnormal levels of CFO. The calculation of the abnormal levels follows the formula:
𝐴𝑏𝑛𝑜𝑟𝑚𝑎𝑙 𝑙𝑒𝑣𝑒𝑙 = 𝐴𝑐𝑡𝑢𝑎𝑙 𝑙𝑒𝑣𝑒𝑙 − 𝑁𝑜𝑟𝑚𝑎𝑙 𝑙𝑒𝑣𝑒𝑙 1)
The normal levels of these metrics, Roychowdhury (2006) follows the model developed by Dechow et al. (1998). In this model, cash-flow from operations will be expressed as a linear function of sales and changes in sales in the current period. As way to estimate the model, it is necessary to run the following cross-sectional regression for every year and industry:
𝐶𝐹𝑂𝑡 𝐴𝑡−1
= 𝛽
0+ 𝛽
1 1 𝐴𝑡−1+ 𝛽
2 𝑆𝑡 𝐴𝑡−1+ 𝛽
3 ∆𝑆𝑡 𝐴𝑡−1+ 𝜀
𝑡 2) Where:𝐶𝐹𝑂𝑡: Cash flow from operations during period t;
𝐴𝑡−1 : Total assets during the period t-1; 𝑆𝑡 : Sales during the period t;
∆𝑆𝑡 : Change in sales during the period t and t-1;
𝜀𝑡 : Error
According to Roychowdhury (2006), the model was divided by the lagged value of assets to control the potential differences in the size of a given company.
The actual level of CFO was calculated using the following formula present in (Castelhano, 2014, master thesis):
𝐴𝑐𝑡𝑢𝑎𝑙 𝐶𝐹𝑂𝑡 = 𝑁𝐼𝑡− (∆𝐶𝐴𝑡− ∆𝐶𝐿𝑡− ∆𝐶𝑎𝑠ℎ𝑡+ ∆𝐷𝑒𝑏𝑡𝑡− 𝐷𝑒𝑝𝑡) 3) Where:
17 ∆𝐶𝐴𝑡 = Changes in current assets
∆𝐶𝐿𝑡= Changes in current liabilities
∆𝐶𝑎𝑠ℎ𝑡 = Changes in cash and cash equivalents ∆𝐷𝑒𝑏𝑡𝑡 = Changes in short term debt
𝐷𝑒𝑝𝑡 = Depreciation and amortization of period t
Finally, it is important to state that the measure of REM will be measured in terms of its absolute value.
4.3 Empirical model
The following model was used to study the association of state ownership and REM:
𝐴𝑏𝑛. 𝐶𝐹𝑂𝑖,𝑡= 𝛽0+ 𝛽1𝑆𝑂𝐸𝑖,𝑡+ 𝛽2𝐶𝑟𝑖𝑠𝑖𝑠𝑖,𝑡+ 𝛽3𝐿𝑖𝑠𝑡𝑒𝑑𝑖,𝑡+ 𝛽4𝑆𝑖𝑧𝑒𝑖,𝑡+ 4)
𝛽5𝐷𝑒𝑏𝑡𝑖,𝑡+ 𝛽6𝐺𝑟𝑜𝑤𝑡ℎ𝑖,𝑡+𝛽7𝑅𝑂𝐴𝑖,𝑡+𝛽8𝐵𝑖𝑔4𝑖,𝑡+ 𝛽9𝐶𝑟𝑖𝑠𝑖𝑠𝑆𝑂𝐸𝑡+ 𝛽10𝐿𝑖𝑠𝑡𝑒𝑑𝑆𝑂𝐸𝑡+ 𝜀𝑖,𝑡
In terms of explanatory variables, there are four dummy variables:
𝑆𝑂𝐸: That presents the value “1” if the given company is state-owned or “0” if it is not state-owned;
𝐶𝑟𝑖𝑠𝑖𝑠: That presents the value “1” if the given period of analysis coincides with a year of financial crisis (which will be the years of 2009 to 2012) or “0” otherwise;
𝐿𝑖𝑠𝑡𝑒𝑑: That presents the value “1” if the given company is publicly traded or “0” otherwise.
𝐵𝑖𝑔4: That presents the value “1” if the given company is audited by a big4 auditing firms and “0” otherwise.
There is no clear consensus regarding the crisis period, however, in the European Commission Winter Report (2014), it is defined as the period between 2009 and 2012. In fact, the European commission regards that by 2013, Europe was already presenting signs of recovery from the crisis.
Regarding the auditing firm, DeAngelo (1981) suggests that Big4 firms provide higher quality services, because they are subjected to greater disciplinary sanctions and have an increased pressure to maintain a good reputation. Tendeloo and Vanstraelen
18
(2005) found a link between Big4 firms and a decreasing degree of earnings management practices. In regards to SOEs, Chen et al. (2011) found evidence that non-state-owned companies exhibit a greater reduction in EM relative do SOEs when they employ high-quality auditors. Conversely, Chi, Lisic and Pevzner (2011) determined that Big4 auditing firms are associated with a greater degree of REM activities. A possible explanation might be given by Roychowdhury (2006) that defended that the greater willingness to use REM instead of AEM is that accrual manipulation is more likely to draw auditor or regulatory scrutiny. This means that the higher scrutiny of AEM practices by Big4 auditing firms will lead to a greater willingness of REM and, therefore, these auditing firms will be greatly associated with these types of practices.
Listed companies were shown to be subjected to increased scrutiny, leading to greater transparency in reported earnings (Leuz et al., 2006). However, Ding et al. (2007) have shown that listed firms were seen to favour earnings boosting methods more than state-owned companies. Wang and Yung (2011), also found that publicly traded firms have higher levels of EM when compared with state-owned corporations. Therefore, it is interesting to study the relationship between listed firms and the extend of REM.
A company’s size has been shown to have a possible relationship with the degree of REM practices, as seen in Watts L. and Zimmerman L. (1978)These authors state the increased size of a given company will lead them to be subject to greater regulatory scrutiny, leading to greater quality earnings and less REM practices. Likewise, Moses (1987) showed that bigger companies have a greater incentive for income smoothing behaviours. The author postulates that a firm’s size leads to a greater scrutiny by state and public entities. This creates a greater incentive to manage earnings as a way of minimizing the expected costs of a potential external intervention. Capalbo et al. (2014) also found evidence that EM practices in SOEs decreases with the firm size. On the other hand, authors such as Albrecht and Richardson (1990), Tendeloo et al. (2005), Sawan and Hamuda (2014) and Zgarni et. al (2014) provided evidence towards the non-existent relation between the size of a given company and the degree of earnings management. Additionally, Choi (2002) affirmed that smaller sized companies have a greater probability of managing earnings, in order to avoid losses. Size is measured as the logarithm of a company’s total assets.
19
According to Zamri, Rahman and Isa (2013) debt has an effect on the extent of earnings management practices. The authors demonstrate that more indebted companies tend to have lower levels of REM. On the contrary, Carlson et al. (1997) and Roychowdhury (2006) state that there is a positive relationship between a firm’s debt level and the degree of earnings management practices. Finally, Zgarni et al. (2014) demonstrated that the practices of REM are not significantly associated with a company’s debt level. It is evident that there is no consensus in regards to the possible effects of debt, or even if these effects exist at all. Debt is measured as the sum of long and short-term non-operational liabilities divided by the total assets.
According to Skinner and Sloan (2002), companies with growth opportunities are penalized by the stock market when they fail to accomplish forecasted earnings. Additionally, Butler, Leone and Willenborg (2004) demonstrated that growing companies can suffer pressures to maintain their profitability rate, or to maintain the stability of reported earnings, which may lead to earnings management. In fact, Tendeloo et al. (2005) and Sawan and Hamuda (2014) show that companies with higher growth levels are more willing to practice earnings management. In regards to REM, Roychowdhury (2006) and Carlson et al.s (1997) defend that growth creates a greater incentive towards these types of practices, providing evidence of a potential correlation between these variables. Capalbo et al. (2014) also proved that earnings management in SOEs increases with profitability. On the other hand, Gunny (2010) showed that profitability has a negative effect on earnings manipulation. In order to provide a greater representation of a firm’s performance and to encapsulate the multitude of opinions regarding its effect, it was included in the model the variables Growth is measured as the percentage variation of a company’s turnover, and ROA is obtained by dividing net income by total assets.
Finally, the variables CrisisSOE and ListedSOE are interaction terms of the dummy variables SOE, Crisis and Listed. The first variable establishes a clear connection between periods of economic crisis and the extent of REM practices of SOE. The second variable establishes the connection between the influence of being publicly traded, in SOE, and its relationship to REM practices.
20 5.RESULTS
5.1. Descriptive statistics
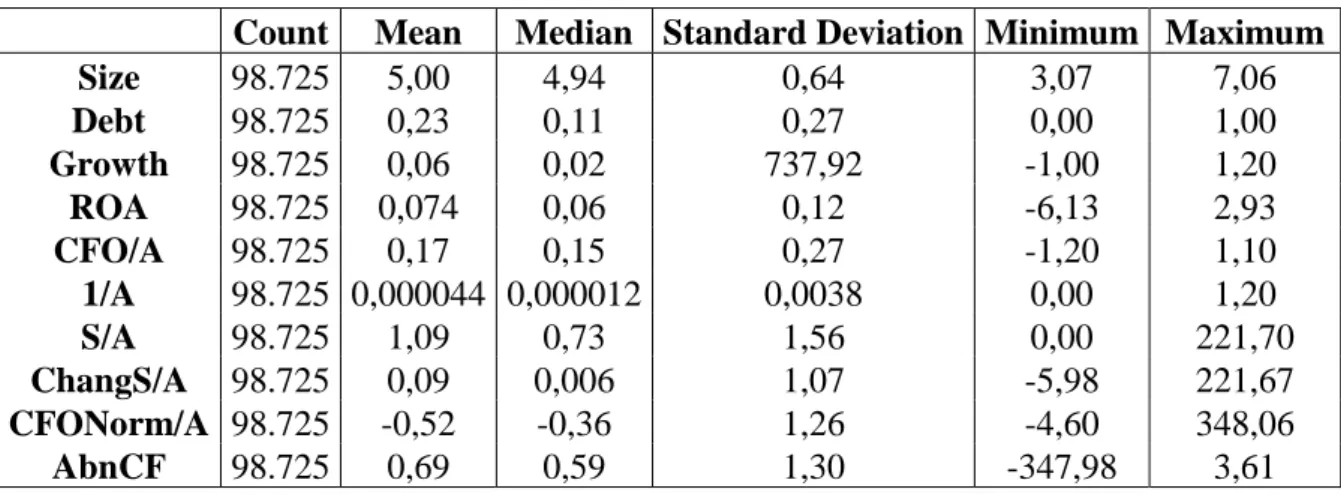
Table 1 provides the descriptive statistics of the variables that compose the given model.
Table I – Variables descriptive statistics
Count Mean Median Standard Deviation Minimum Maximum Size 98.725 5,00 4,94 0,64 3,07 7,06 Debt 98.725 0,23 0,11 0,27 0,00 1,00 Growth 98.725 0,06 0,02 737,92 -1,00 1,20 ROA 98.725 0,074 0,06 0,12 -6,13 2,93 CFO/A 98.725 0,17 0,15 0,27 -1,20 1,10 1/A 98.725 0,000044 0,000012 0,0038 0,00 1,20 S/A 98.725 1,09 0,73 1,56 0,00 221,70 ChangS/A 98.725 0,09 0,006 1,07 -5,98 221,67 CFONorm/A 98.725 -0,52 -0,36 1,26 -4,60 348,06 AbnCF 98.725 0,69 0,59 1,30 -347,98 3,61
The values do not present any distinguishing discrepancy and are in line with the results obtained by Cohen et al. (2008). In terms of the independent variables, the average level of debt (as a proportion of a firms’ total assets) is 23%, the average return on assets is 7,4% and the actual cash-flow from operations (as a proportion of the lagged assets) is, in average, positive (17%).
5.2. T-student test for SOE and NSOE
In order to understand the behaviour of both types of companies (non and state-owned) a t-student test was performed. This test allows the comparison of these two sub-samples and determines if their mean is statistically significant.
Table II – T-student test
Observations Mean Abn CFO P-Value df t Stat Conf Interval
SOE 5.853 0,39 0,00 11.70 93,10 95%
NSOE 92.872 0,71 0,00 185.74 -161,5 95% Considering the fact that the p-value for both SOE and NSOE is below 0,05, it is possible to state that these results reject the null hypothesis, in which the average of abnormal CFO for state-owned and non-state-owned companies. The results show, in
21
fact, that the average value of abnormal CFO for both types of companies is quite different.
5.3. Pearson’s correlation matrix
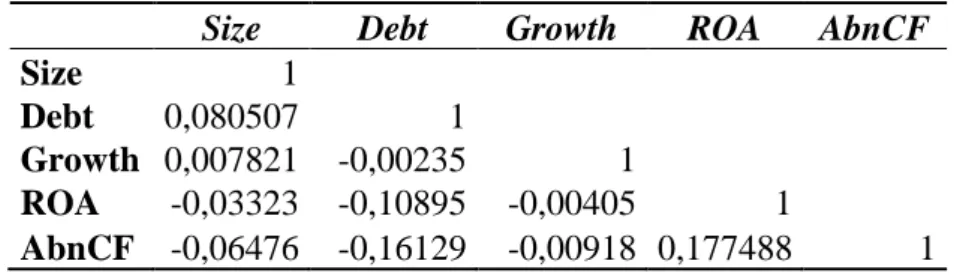
The following table provides Pearson’s correlations among the variables:
Table III – Pearson’s correlation matrix
Size Debt Growth ROA AbnCF
Size 1
Debt 0,080507 1
Growth 0,007821 -0,00235 1
ROA -0,03323 -0,10895 -0,00405 1
AbnCF -0,06476 -0,16129 -0,00918 0,177488 1
In general, it is possible to conclude that the variables possess a weak correlation with each other, given the fact that the values of the matrix are close to zero. Additionally, some conclusions can be drawn regarding the variables themselves. The values obtained between the variables Debt and ROA demonstrate that companies with more debt have a smaller return on their assets.
When observing the dependent variable, Abnormal CFO, there is a positive relation with the variable ROA and a negative relation with the remaining variables. This indicates that firm’s that are smaller, more indebted, with less growth opportunities and higher return on assets have a greater level of abnormal CFO.
5.4. Regression results
Table IV presents the results of the regression for the empirical model previously presented:
22
Table IV – Model Regression
Expected Sign Abnormal CFO P-Value
Intercept 1,29932 0,0000 SOE +/- 0,24037 0,0000 Crisis - 0,02622 0,0023 Big4 - 0,05660 0,0000 Listed +/- -0,04562 0,0011 Size - -0,12563 0,0000 Debt +/- -0,63661 0,0000 Growth + -0,00001 0,0063 ROA +/- 1,80105 0,0000 CrisisSOE - -0,00417 0,9044 ListedSOE +/- 0,16065 0,4819 Nº Obs. 98.725 R Square 0,057 Adjusted R^2 0,057 F-statistic 594,43 P-value 0
Note: The regression is a linear probability model. SOE is a binary variable that takes the value 1 if the company is state-owned. Crisis is a binary variable that takes the value 1 if the year is between 2009 and 2012. Listed is a binary variable that takes the value 1 if the company is publicly traded. Big 4 is a binary variable that takes the value 1 if the company is audited by a Big4 auditing firm. Size is measured as the logarithm of a company’s total assets. Debt is measured as the sum of long and short-term non-operational liabilities divided by the total assets. Growth is measured as the percentage variation of a company’s turnover. ROA is measured by dividing net income by total assets. CrisisSOE is an interaction variable between the variables Crisis and SOE. ListedSOE is an interaction variable between the variables Listed and SOE.
It is possible to conclude that every variable, apart from the dummies CrisisSOE and ListedSOE, are statistically significant. The dummy SOE, whose coefficient is positive, suggests that state-owned companies demonstrate greater degrees of REM practices. The results follow the conclusions presented by Braam et al. (2015) and Bai et al. (2004), despite contradicting the results presented Wang and Yung (2011). The fact that these firms tend to prioritize the achievement of social goals and short-term political objectives, rather than maximizing profits, can have an effect on the degree of earnings management practices.
In terms of the remaining values, the variable Big4 has a positive coefficient, which suggests that being audited by these firms leads to a greater degree of REM practices, because, as pointed by Roychowdhury (2006), these firms have an increased scrutiny of accrual-based earnings management practices. The variable Crisis, which has a positive coefficient, suggests that there is an increased practice of REM in periods of economic
23
recession, which is not consistent with the conclusions presented by Filip et al. (2014). Finally, the variable Listed has a negative coefficient which suggests that publicly traded firms incur in less REM practices. This conclusion concurs with the evidence presented by Givoly et al. (2010).
Size has a negative coefficient, which provides evidence that smaller companies sustain greater levels of real earnings management, as demonstrated by Watts and Zimmerman (1978). The variable debt has a negative coefficient. This leads to the conclusion that more indebted companies are more motivated to manipulate their earnings, as seen in Zamri, Rahman and Isa (2013) and is not consistent with Roychowdhury (2006).
The variable Growth has a negative coefficient, which provides evidence that a company with greater growth opportunities incurs in a decreasing rate of EM practices, which is not consistent with Roychowdhury (2006). Additionally, the variable ROA has a positive coefficient, leading to the conclusion that a better management of a company’s assets leads to a decreased use of EM practices, which follows the conclusions presented by Carlson et al. (1997). However the results is not consistent with the conclusions obtained by Gunny (2010) and Cupertino et al. (2016) which assumed a negative relationship between these variables.
Finally, the variables ListedSOE and CrisisSOE were shown not to be statistically significant. However, this does not refute the second hypothesis of the study, in which it was defended that crisis periods are positively associated with increased REM practices, thanks to the results obtained with the variable Crisis. Additionally, it is probable that the effects of crisis periods on the degree of REM practices are more directed toward non-state-owned firms.
In sum, the results confirm the first hypothesis, which states that state-owned firms are positively associated with a greater degree of REM practices and, more specifically, in the form of manipulating the firm’s cash-flow from operations by, for example, granting excessive discounts.
Finally, it is important to state that a regression without the interaction variables was calculated and that the results previously presented were strengthened. This solidifies the conclusions obtained by this study – Appendix 5.
24
6.ADDITIONAL ANALYSIS 6.1. The effects of Swedish SOEs
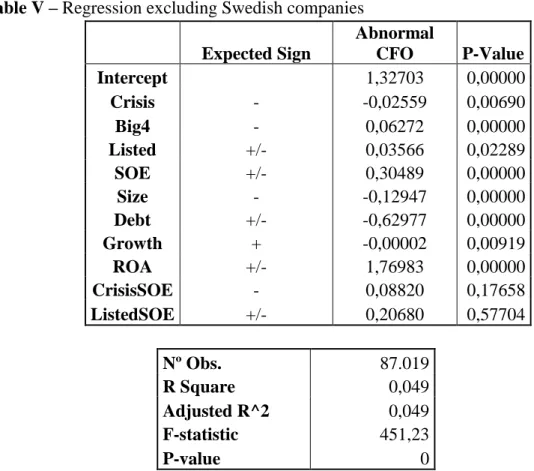
When analysing appendix 1 it is clear that the sample of state-owned companies is mainly composed of Swedish companies (about 64%), which may be a weakness of the sample obtained. Therefore, the following regressions was run excluding these firms. Table V presents the results.
Table V – Regression excluding Swedish companies
Nº Obs. 87.019
R Square 0,049
Adjusted R^2 0,049
F-statistic 451,23
P-value 0
Note: The regression is a linear probability model. SOE is a binary variable that takes the value 1 if the company is state-owned. Crisis is a binary variable that takes the value 1 if the year is between 2009 and 2012. Listed is a binary variable that takes the value 1 if the company is publicly traded. Big 4 is a binary variable that takes the value 1 if the company is audited by a Big4 auditing firm. Size is measured as the logarithm of a company’s total assets. Debt is measured as the sum of long and short-term non-operational liabilities divided by the total assets. Growth is measured as the percentage variation of a company’s turnover. ROA is measured by dividing net income by total assets. CrisisSOE is an interaction variable between the variables Crisis and SOE. ListedSOE is an interaction variable between the variables Listed and SOE.
As seen, the results obtained are statistically significant for the exact same variables as the previous regression. Additionally, the conclusions regarding each variable are the same or, in other words, the coefficients obtained have the same sign.
Expected Sign Abnormal CFO P-Value Intercept 1,32703 0,00000 Crisis - -0,02559 0,00690 Big4 - 0,06272 0,00000 Listed +/- 0,03566 0,02289 SOE +/- 0,30489 0,00000 Size - -0,12947 0,00000 Debt +/- -0,62977 0,00000 Growth + -0,00002 0,00919 ROA +/- 1,76983 0,00000 CrisisSOE - 0,08820 0,17658 ListedSOE +/- 0,20680 0,57704
25
This provides evidence to sustain the robustness of the results and the conclusions obtained. The exclusion of Swedish companies (non and state-owned) showed to have no significant impact on the coefficients and the P-value of the model’s variables.
6.2. The effects of growth opportunities
Growth opportunities have been associated with a higher willingness to practice earnings managements (Tendeloo et al., 2005; Sawan et al., 2014). Additionally, Roychowdhury (2006) and Carlson et al. (1997) defend that growth creates a greater incentive towards the practice of REM. Therefore, it seems important to study more in depth the effects of growth opportunities.
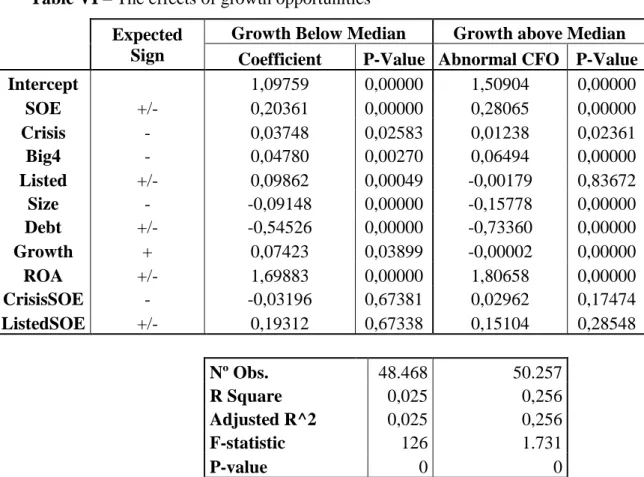
In order to study the effects of growth opportunities, two sub-samples were created, one in which the value of the variable growth was above its median (0,02) and another otherwise. Table VI summarizes the results.
Table VI – The effects of growth opportunities Expected
Sign
Growth Below Median Growth above Median Coefficient P-Value Abnormal CFO P-Value Intercept 1,09759 0,00000 1,50904 0,00000 SOE +/- 0,20361 0,00000 0,28065 0,00000 Crisis - 0,03748 0,02583 0,01238 0,02361 Big4 - 0,04780 0,00270 0,06494 0,00000 Listed +/- 0,09862 0,00049 -0,00179 0,83672 Size - -0,09148 0,00000 -0,15778 0,00000 Debt +/- -0,54526 0,00000 -0,73360 0,00000 Growth + 0,07423 0,03899 -0,00002 0,00000 ROA +/- 1,69883 0,00000 1,80658 0,00000 CrisisSOE - -0,03196 0,67381 0,02962 0,17474 ListedSOE +/- 0,19312 0,67338 0,15104 0,28548 Nº Obs. 48.468 50.257 R Square 0,025 0,256 Adjusted R^2 0,025 0,256 F-statistic 126 1.731 P-value 0 0
Note: The regression is a linear probability model. SOE is a binary variable that takes the value 1 if the company is state-owned. Crisis is a binary variable that takes the value 1 if the year is between 2009 and 2012. Listed is a binary variable that takes the value 1 if the company is publicly traded. Big 4 is a binary variable that takes the value 1 if the company is audited by a Big4 auditing firm. Size is measured as the logarithm of a company’s total assets. Debt is measured as the sum of long and short-term non-operational liabilities divided by the total assets. Growth is measured as the percentage variation of a company’s turnover. ROA is measured by dividing net income by total assets.
26
CrisisSOE is an interaction variable between the variables Crisis and SOE. ListedSOE is an interaction variable between the variables Listed and SOE.
When comparing both sub-samples, it is visible that the variable growth has an effect on certain variables. The first identifiable difference is in significance of the variable Listed, given the fact that, when considering the sub-sample in which the values of the variable growth are above its median, this variable is not statistically significant, leading to the conclusion that, when facing companies with vast growth opportunities, the fact that it is listed or not does not correlate with the extent of REM practices.
Regarding the variable SOE, it is visible that its coefficient is greater when considering the sub-sample with values above median, which can may lead to the inference that state companies with greater growth opportunities are incur in higher degrees of earnings management practices. This may be in line with Ferreira et al. (2013), in which the authors state that politicians aim to report earnings that will demonstrate that the public resources are managed appropriately. Taking this account, larger growth opportunities might provide the necessary visibility to guarantee future re-election or, in other terms, job security. Additionally, the variable debt, whose coefficient is negative, also has a greater coefficient when considering the sub-sample above media. This may allow the conjecture that indebted firms with greater growth opportunities incur in higher degrees of REM practices. Finally, the variable size also sees an increase in its coefficient when regarding the same sub-sample. The conclusion that can be drawn is that smaller companies with greater growth opportunities also incur in more earnings management practices.
In general, it is possible to determine that growth has a positive effect on the degree of earnings management, specifically through the use of REM. Additionally, one can postulate that this effect is more prominent in smaller companies, as they take advantage of these opportunities and, combined with the manipulation of the reported earnings, try to demonstrate a better performance. All in all, the results seem to align with the existing body of literature in demonstrating the key role that growth opportunities play in the decision to manage earnings.
27
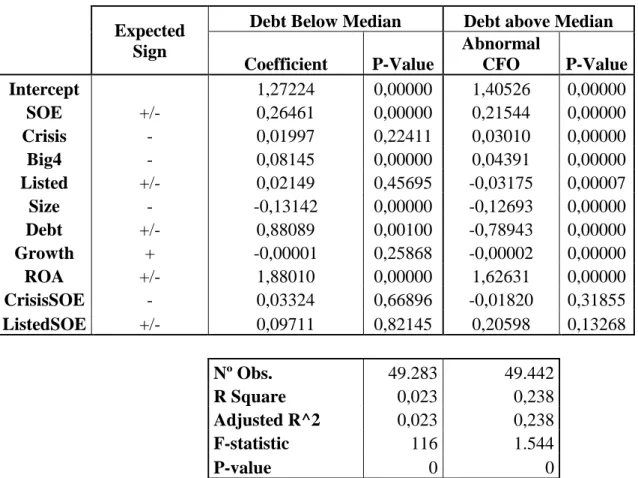
6.3. The effects of indebtedness
Debt has been demonstrated to have an effect on the extent of earnings management practices (Zamri, Rahman and Isa, 2013). However, a consensus has yet to be formed in regards to the effect that this variable might have. Some state that there is a positive relationship between a firm’s debt level and the degree of earnings management practices (Roychowdhury, 2006), and some have shown the opposite (Zamri, Rahman and Isa, 2013). As it is not clear the extent of the influence that this variable has on the degree of REM, it is important to study more in depth the overall effects of indebtedness.
To achieve this two sub-samples were created, one in which the value of the variable debt was above its median (0,11) and another otherwise. Table VII presents the results.
Table VII – The effects of indebtedness Expected
Sign
Debt Below Median Debt above Median Coefficient P-Value Abnormal CFO P-Value Intercept 1,27224 0,00000 1,40526 0,00000 SOE +/- 0,26461 0,00000 0,21544 0,00000 Crisis - 0,01997 0,22411 0,03010 0,00000 Big4 - 0,08145 0,00000 0,04391 0,00000 Listed +/- 0,02149 0,45695 -0,03175 0,00007 Size - -0,13142 0,00000 -0,12693 0,00000 Debt +/- 0,88089 0,00100 -0,78943 0,00000 Growth + -0,00001 0,25868 -0,00002 0,00000 ROA +/- 1,88010 0,00000 1,62631 0,00000 CrisisSOE - 0,03324 0,66896 -0,01820 0,31855 ListedSOE +/- 0,09711 0,82145 0,20598 0,13268 Nº Obs. 49.283 49.442 R Square 0,023 0,238 Adjusted R^2 0,023 0,238 F-statistic 116 1.544 P-value 0 0
Note: The regression is a linear probability model. SOE is a binary variable that takes the value 1 if the company is state-owned. Crisis is a binary variable that takes the value 1 if the year is between 2009 and 2012. Listed is a binary variable that takes the value 1 if the company is publicly traded. Big 4 is a binary variable that takes the value 1 if the company is audited by a Big4 auditing firm. Size is measured as the logarithm of a company’s total assets. Debt is measured as the sum of long and short-term non-operational liabilities divided by the total assets. Growth is measured as the percentage variation of a company’s turnover. ROA is measured by dividing net income by total assets.