SHOOT DENSITY, LEAF REMOVAL AND CLUSTER THINNING EFFECTS ON MICROCLIMATE, YIELD AND FRUIT COMPOSITION OF THE PORTUGUESE
VINE VARIETY ‘TOURIGA NACIONAL’
Rogério de CASTRO(1); Amândio CRUZ(1); Carlos A. RODRIGUES(1); Manuel BOTELHO(1);
Carlos RODRIGUES(2); Ana RODRIGUES(2); Casimiro GOMES(2)
(1) Instituto Superior de Agronomia, Tapada da Ajuda, 1349-017 Lisboa, rcastro@isa.utl.pt (Portugal) (2) Dão Sul, Soc. Vitivinícola, SA., Quinta de Cabriz, Currelos, 3430-909 Carregal do Sal,
casimirogomes@daosul.com (Portugal) Abstract:
The evaluation of shoot density, basal leaf removal, and cluster thinning effects on canopy microclimate characteristics and their influence on yield and fruit composition, was carried out during 2 years (2005 to 2006) on one of the most important and noble Portuguese vine varieties – ‘Touriga Nacional’. The experimental field belongs to the private company Dão Sul, Soc. Vitivinícola, SA, located at Dão region, in centre of Portugal. The vineyard was grafted in 1991 onto 1103 P rootstock. The training system is bilateral Royat with vertical shoot positioning. Three different shoot densities were assayed (at G stage of Baggiolini scale): 23 shoots.m-1 row (D23), 17 shoots.m-1 row (D17) and 11 shoots.m-1 row (D11). At veraison, two other factors were introduced: leaf removal at fruit zone – LR1 (no leaf removal - LR0) and cluster thinning (30%) – CT1 (no cluster thinning – CT0).
During the growing season several parameters were measured: leaf area, leaf water potential, leaf gas-exchanges, leaf layer number (LLN), canopy size, intercepted photosynthetically active radiation (PAR), fruit composition, yield and vigour.
The reduction of shoot density and clusters thinning slightly improved the canopy microclimate, while basal leaf removal affected these parameters in a stronger way.
Basal leaf removal didn’t affect any of the yield parameters. The yield was, however, significantly (p<0.05) reduced by cluster thinning and, in 2005, by the decreasing of shoot density.
Concerning the grape composition, the studied factors didn’t significantly affect any of its parameters. These results may lead us to presume that no intervention on vineyard would be desirable. However, we verified that D23 treatment substantially increased pruning time (D23 – 88 hours/ha, D17 – 36 hours/ha, D11 – 29 hours/ha). This study indicates that the best option was the removal of water shoots on trunk and cordon - shoot density D17 without basal leaf removal or cluster thinning.
Keywords – shoot density, leaf removal, cluster thinning, canopy microclimate, yield, fruit and wine composition. 1. INTRODUCTION
Canopy management techniques are the ensemble of operations over the herbaceous organs of grapevine able to modify their number, weight, surface and position. This kind of interventions are interesting in vines with excessive vigour, in which, using adequate interventions we can increase wine’s quality (Smart & Robinson, 1991).
A combination of improved cultivation techniques, fertilizers and pesticides, has resulted in the establishment of some excessively vigorous vineyards in some regions. Shoot crowding and non-uniform leaf area distribution are persistent problems in vigorous vineyards and result in the rapid envelopment of fruits by a wall of foliage (Percival et al., 1994).
Three principal means of microclimate manipulation are covered: shoot number control, vigour control and the use of trellis systems (Smart & Robinson, 1991).
Basal leaf removal is one of the most common canopy management operations and it consists in the removal of a variable number of leaves in the fruit zone improving clusters sunlight exposition and aeration, preventing cryptogrammic diseases and facilitating harvest (Smart & Robinson, 1991).
Especially in very productive varieties, the achievement of a good relation between vegetative growth and fruitfulness isn’t always possible only with a reduction of bud load, left in pruning (Boubals, 1989). Therefore, wine’s quality improvement may also be possible reducing production, in order to adjust the relation “source/sink”, although the known results are not
consistent. The evidence of a strict yield-quality relationship is inconsistent, very limited and mostly based on data collected in cool climates (Reynolds, 1989). Despite cluster thinning, alone, can not compensate errors or misapplication of other viticultural practices, it is clear that very high yields delay ripening and reduce fruit and wine quality (Jackson & Lombard, 1993). The other canopy management technique that will also be studied is shoot density correction which, despite not being so used, is also important because it influences in a direct form the canopy density, modifying its microclimate conditions (Castro et al, 2005).
‘Touriga Nacional’ vine variety is considered one of most ‘nobles’ portuguese varieties and also one of the oldest in Douro and Dão’s regions, from where it’s originary and where, in the end of the XIX century, represented about 90% of the vine varieties planted. It is characterized by a downward position, a high potential fertility. However coulure and consequent low productions lead it to abandonment, in such a way that in 1986 it didn’t represent more than 6% of the varieties planted in Dão. On the origin of this evolution were the genetic factors, the inadequate use of rootstock Aramon and the trellising in very dense canopies. Nowadays, due to genetic selection and the use of correct trellising techniques, the coulure problem has been almost solved and ‘Touriga Nacional’ has a good productive potential, sometimes excessive, and clusters thinning has become a current practice. At the moment, this variety is used in every Portuguese region and even in other countries.
2. MATERIAL AND METHODS
The experimental trial was conduced during 2005 and 2006, on a vineyard belonging to a private company (Dão Sul, Soc. Vitivinícola, SA), located in Carregal do Sal (40º26’N, 1º6’W), in Dão’s demarcated region. The vine variety was ‘Touriga Nacional’ and had been grafted in 1991, onto rootstock 1103 P. The vineyard was slightly south exposed and row orientation was North-South.
Vines were planted with 2,5 x 1,2m spacing and trained onto a Royat bilateral with vertical shoot positioning. The soil is, according to FAO’s classification, a Cambisoil, franc-sandy, acid, with granitic origin and low hydric reserve.
According to hydric balance of Thornthwaite, this region’s climate is mesothermic, with little or no thermal efficiency in the summer, sub-damp to dry with moderate water superavit in the winter and moderate deficit in the summer (B’3 a C1s).
Leaf gas-exchanges were measured with a portable IRGA system (ADC-LCA4 model) and leaf water potential with a pressure chamber (Scholander type). Diurnal courses of leaf water potential (Ψ) and photosynthesis (A) were measured throughout the growing season. In each day, Ψ was measured at predawn and thereafter both, Ψ and leaf gas-exchanges, 3 times a day (10 am, 2 and 6 pm) along the season. Measurements were made on six leaves per treatment. Leaf area was determined with the method proposed by Lopes & Pinto (2005). The canopy structure was evaluated by Point Quadrat method (Smart & Robinson, 1991).
A ‘split-split-plot’ experiment was designed with 3 replications with 90 vines per treatment. Three different shoot densities were assayed (at G stage of Baggiolini scale): 23 shoots m-1 row (D23), 17 shoots m-1 row (D17) and 11 shoots m-1 row (D11). At veraison, two other factors were also introduced: leaf removal at fruit zone – LR1 (no leaf removal - LR0) and qualitative cluster thinning (around 30%) – CT1 (no cluster thinning – CT0).
3. RESULTS AND DISCUSSION 3.1 Ecophysiological behaviour
Figure 1 shows the predawn leaf water potential evolution along the second half of the growing season. We can observe that differences between treatments didn’t have a statistical mean.
Differences in the evolution of this parameter were observed between the 2 years. In 2005 (1-A), predawn leaf water potential was inferior to 2006, due to the lower rainfall, although casual rainfall along the season contributed to maintain values always over -0,4MPa. During ripening, these values are considered by Ojeda (2001) as a slight hydric stress.
During 2006 (1-B), vines always had a high hydric disposability, with values above -0,2MPa that, according to Deloire et al (2003), mean a null hydric stress. This high hydric disposability increased berry weight, and consequently diluted all the berry compounds (table 4).
-0,6 -0,4 -0,2 0,0 P re d a w n L e a f W a te r P o te n ti a l (M P a ) D1 D2 D3
8 Jun 8 Jul 28 Jul
1 Sep 12 Sep -0,6 -0,4 -0,2 0,0 P re d a w n L e a f W a te r P o te n ti a l (M P a ) D1 D2 D3
5 Jul 1 Aug 30 Aug
Figure 1 – Seasonal predawn leaf water potential evolution in 2005 (A) and 2006 (B). Average of 12 leaves ±
SE. D23 - 23 shoots m-1 row, D17 - 17 shoots m-1 row and D11 - 11 shoots m-1 row.
In figure 2 are shown assimilation and transpiration rates, during the summer of 2005 and 2006. Low differences were found between treatments, only being observed a slight tendency to an increase of photosynthetic rate with the diminution of shoot density. We can also verify that leaves maintained high levels of photosynthesis, for which contributed the low or null hydric stress in both growing seasons.
0 4 8 12 16 20 24 10 14 18 10 14 18 P h o to sy n th et ic r at e ( µ m o l. m -2.s -1) 0 1 2 3 4 5 6 7 8 T ra n sp ir at io n r at e (m m o l. m -2.s -1) D23 - A D17 - A D11 - A D23 - E D17 - E D11 - E 8 July 2005 31 Aug 2005 0 4 8 12 16 20 24 10 14 10 14 18 10 14 18 P h o to sy n th et ic r at e (µ m o l. m -2.s -1) 0 1 2 3 4 5 6 7 8 T ra n sp ir at io n r at e (m m o l. m -2.s -1) D23- A D17 - A D11 - A D23 - E D17 - E D11 - E
5 July 2006 1 Aug 2006 30 Aug 2006
Figure 2 – Diurnal and seasonal evolution of net photosynthesis and transpiration rate in 2005 and 2006.
Average of 12 leaves ± SE. D23 - 23 shoots m-1 row, D17 - 17 shoots m-1 row and D11 - 11 shoots m-1 row.
3.2 Canopy structure
The characterization of canopy structure in both years is presented on table 1, and it shows a decrease of canopy density with the reduction of shoot density and with basal leaf removal. Basal leaf removal and shoot thinning significantly improved canopy microclimate by a decline in LLN and shaded leaves and clusters. Slight differences were observed between the two years of trial in all those parameters, with a tendency for lower values in 2005, due to the inferior hydric disposability.
The total leaf area per vine was also influenced by the hydric resources, with higher values in 2006. The reduction of shoot density decreases the total leaf area per vine, although with a higher lateral leaf area in these treatments. As expectable, basal leaf removal showed a tendency to reduce total, primary and lateral leaf area.
Table 1 – Influence of shoot density and basal leaf removal on canopy structure during the ripening,
in the 2 years. D23 - 23 shoots m-1 row; D17 - 17 shoots m-1 row; D11 - 11 shoots m-1 row; LR1 – with basal leaf removal; LR0 – without basal leaf removal.
Y ea r Treatment LLN Shaded leaves (%) Shaded clusters (%) Total LA (m2/vine) Primary LA (cm2/shoot) Lateral LA (cm2/shoot) D23 2,24 a 26,6 a 61,8 a 07,0 1501 906 D17 2,08 ab 24,9 a 51,8 ab 05,7 1295 1294 D11 1,74 b 17,4 b 43,1 b 05,0 1705 1701 Sig. ** * *** ns ns ns LR0 2,65 36,7 68,4 06,8 1666 1543 LR1 1,39 13,2 36,0 05,2 1304 938 2 0 0 5 Sig. *** *** *** ns ns ns D23 2,52 26,8 41,7 12,4 a 1590 2314 D17 2,24 22,9 39,1 9,7 ab 1464 2996 D11 1,90 22,8 27,6 7,4 b 1703 2989 Sig. ns ns ns * ns ns LR0 2,49 28,6 41,4 10,3 1759 2968 LR1 1,96 19,9 30,9 9,3 1454 2598 2 0 0 6 Sig. * * ns ns * ns
Note: Sig. – Significance level; n.s. – non significant at 5% level by F test; significant at 5% level
(*), 1%(**) and 0,1%(***), by Tukey HSD test. Values followed by equal letters don’t differ significantly, at 5% by Tukey HSD test.
3.3 Yield components
In first place, we must refer the high yield obtained, in every treatment, on a vine variety that until a few years ago was considered low productive.
Table 2 – Influence of shoot density, basal leaf removal and clusters thinning on
yield parameters, in the 2 years. D23 - 23 shoots m-1 row; D17 - 17 shoots m-1 row; D11 - 11 shoots m-1 row; LR1 – with basal leaf removal; LR0 – without basal leaf removal; CT1 – with clusters thinning; CT0 – without clusters thinning.
Y
ea
r
Treatment Ner Clusters/Vine Cluster weight (g) Yield (t/ha) D23 46,5 a 107,9 b 15,9 a D17 34,5 b 111,1 ab 12,3 b D11 27,6 c 126,9 a 11,7 b Sig. ** * ** LR0 38,2 111,2 13,3 LR1 34,2 119,3 13,3 Sig. ns ns ns CT0 45,5 111,8 16,4 CT1 26,8 118,8 10,2 2 0 0 5 Sig. *** ns *** D23 33,7 a 145,1 15,2 D17 29,4 ab 156,8 15,3 D11 25,7 b 170,2 14,5 Sig. ** ns ns LR0 29,3 164,6 15,6 LR1 29,6 147,9 14,2 Sig. ns ns ns CT0 35,5 153,9 17,9 CT1 23,6 161,6 12,2 2 0 0 6 Sig. *** ns ***
Note: Sig. – Significance level; n.s. – non significant at 5% level by F test;
significant at 5% level (*), 1%(**) e 0,1%(***), by Tukey HSD test. Values followed by equal letters don’t differ significantly, at 5% by Tukey HSD test. na – not applicable.
Basal leaf removal had no effects on any of the yield parameters. Cluster and shoot thinning high significantly reduced the clusters number per vine. Increase in cluster weight was more effective in shoot thinning than in cluster thinning, because the first one was applied earlier in the season allowing the compensation of this parameter.
In 2005, the difference in clusters number was the parameter with more responsibility in the decrease of yield. In 2006, has been verified in the higher densities a reduction of cluster number per vine, provoked by a lower fertility of basal buds, probably due to a shaded microclimate at fruit zone. However, the higher hydric resources permitted an efficient compensation of yield, by a greater cluster and berry weights (tables 2 and 4).
On both years, cluster thinning reduced yield (around 6ton/ha) with any improvement of berry quality compounds.
3.4 Vegetative expression and vigour
On table 3, it’s showed that the reduce of shoot density strongly increased the number of laterals per shoot as well as shoot weight, consequently no differences were found between treatments in what concerns to pruning weight. Obviously, the water shoot number per vine was bigger in D23, where only were removed from the trunk.
In 2006, vigour (shoot and pruning weight) suffered an increase in consequence of the higher hydric disposability. One of the most remarkable observations in this study was the differences between pruning times in the three shoot densities. It’s clear that shoot water removal from the cordon in earlier stages (G stadium) is obligatory. At this time it’s much more easy, fast and economic, than in winter.
Table 3 – Influence of shoot density, basal leaf removal and clusters thinning on vigour parameters,
in the 2 years. D23 - 23 shoots m-1 row; D17 - 17 shoots m-1 row; D11 - 11 shoots m-1 row.
Y
ea
r
Treatment Laterals/shoot Water shoots/ vine Shoot weight (g) Pruning weight/ canopy length (kg/m) Pruning time (hours/ha) D23 0,17 b 7,6 a 36,9 b 0,9 nc D17 0,36 b 2,9 b 45,5 b 0,8 nc D11 1,18 a 0,9 c 73,5 a 0,9 nc 2 0 0 5 Sig. *** *** *** ns - D23 0,36 c 9,8 a 40,2 c 1,1 88 D17 0,81 b 2,2 b 56,9 b 1,0 36 D11 1,77 a 1,3 b 92,8 a 1,2 29 2 0 0 6 Sig. *** *** * ns -
Note: Sig. – Significance level; n.s. – non significant at 5% level by F test; significant at 5% level
(*), 1%(**) e 0,1%(***), by Tukey HSD test. Values followed by equal letters don’t differ significantly, at 5% by Tukey HSD test. nc – data not collected.
3.5 Grape composition
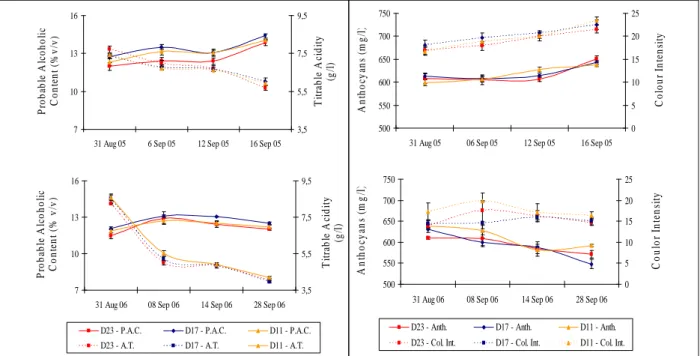
Due to the climatic conditions in the 2 years, remarkable differences on ripening were observed (figure 3). In 2005, PAC increased until harvest (16 Sep 05) reaching values around 14% (v/v) for all treatments, while titrable acidity decreased until interesting values, for this variety (near 6g/l). The skin colour (Anthocyans and Colour Intensity) also presented a positive evolution during ripening, with no significant differences between treatments.
During the ripening of 2006 the higher values of PAC were reached on 8 Sep 06, with a gradual decrease, from that time on. This reduction was provoked by the rainfall after that moment and similar cases were observed all over Dão region, where waiting for new increase of this parameter led the harvest to the end of September. As consequence, no PAC improvement was obtained and a drastic decline of titrable acidity, anthocyans and colour intensity occurred. In this year, harvest should have been done earlier, probably at 8 Sep when all quality parameters
7 10 13 16
31 Aug 05 6 Sep 05 12 Sep 05 16 Sep 05
P ro b ab le A lc o h o li c C o n te n t (% v /v ) 3,5 5,5 7,5 9,5 T it ra b le A ci d it y (g /l ) 500 550 600 650 700 750
31 Aug 05 06 Sep 05 12 Sep 05 16 Sep 05
A n th o cy an s (m g /l ) 0 5 10 15 20 25 C o lo u r In te n si ty 7 10 13 16
31 Aug 06 08 Sep 06 14 Sep 06 28 Sep 06
P ro b ab le A lc o h o li c C o n te n t (% v /v ) 3,5 5,5 7,5 9,5 T it ra b le A ci d it y (g /l )
D23 - P.A.C. D17 - P.A.C. D11 - P.A.C.
D23 - A.T. D17 - A.T. D11 - A.T.
500 550 600 650 700 750
31 Aug 06 08 Sep 06 14 Sep 06 28 Sep 06
A n th o cy an s (m g /l ) 0 5 10 15 20 25 C o u lo r In te n si ty
D23 - Anth. D17 - Anth. D11 - Anth.
D23 - Col. Int. D17 - Col. Int. D11 - Col. Int.
Figure 3 – Probable alcoholic content, titrable acidity, anthocyans and colour intensity evolution, during the last half
of ripening, in the 2 years. Average of 12 samples of 100 berries ± SE. D23 - 23 shoots m-1 row, D17 - 17 shoots m-1 row and D11 - 11 shoots m-1 row.
Table 4 – Influence of shoot density, basal leaf removal and clusters thinning on berry composition, in the 2
years, at harvest. D23 - 23 shoots m-1 row; D17 - 17 shoots m-1 row; D11 - 11 shoots m-1 row; LR1 – with basal leaf removal; LR0 – without basal leaf removal; CT1 – with clusters thinning; CT0 – without clusters thinning. Y ea r Treatment Berry Weight (g) PAC Titrable Acidity (g tar. ac./l) pH Colour Intensity Anthocyans (mg/l) Total Phenols (mg/l) D23 1,52 b 13,9 5,7 3,54 a 18,2 651 129 D17 1,59 ab 14,4 6,0 3,54 a 18,9 643 134 D11 1,67 a 14,1 5,9 3,46 b 19,5 638 137 Sig. * ns ns * ns ns ns LR0 1,56 14,0 6,0 3,51 19,3 648 134 LR1 1,62 14,2 5,8 3,51 18,5 640 132 Sig. ns ns ns ns ns ns ns CT0 1,60 14,0 5,9 3,52 18,7 650 133 CT1 1,58 14,2 5,8 3,51 19,1 638 133 2 0 0 5 Sig. ns ns ns ns ns * ns D23 2,07 12,0 b 4,0 3,49 12,3 571 97 D17 2,09 12,6 a 4,0 3,52 12,8 553 99 D11 1,93 12,1 b 4,2 3,52 13,5 592 100 Sig. ns * ns ns ns ns ns LR0 2,07 12,3 4,0 3,50 12,5 575 98 LR1 2,00 12,2 4,1 3,52 13,2 565 99 Sig. ns ns ns ns ns ns ns CT0 2,03 12,1 4,2 3,48 12,5 576 98 CT1 2,04 12,4 4,0 3,54 13,1 565 99 2 0 0 6 Sig. ns * * *** ns ns ns
Note: Sig. – Significance level; n.s. – non significant at 5% level by F test; significant at 5% level (*), 1%(**)
e 0,1%(***), by Tukey HSD test. Values followed by equal letters don’t differ significantly, at 5% by Tukey HSD test.
At harvest in 2005, significant differences were observed only at berry weight and pH between shoot densities. Unexpectedly, cluster thinning (CT1) reduced anthocyans content in berry skin (table 4). In 2006, the medium shoot density (D17) originated a higher PAC, tendency also observed in the previous year. Significant differences only were observed with the cluster
thinning, which increased PAC and pH, and decreased the titrable acidity. However, these statistical differences don’t have an oenological mean.
The higher hydric disposability observed in 2006 (figure 1), led to heavier berries and the rainfall during ripening decreased all the qualitative parameters.
4. CONCLUSIONS
The vine variety ‘Touriga Nacional’, in the past almost abandoned, due to its low production, showed in this experiment that with genetic selection and a correct trellising can reach high yields with excellent quality.
Although shoot thinning and basal leaf removal have reduced LLN and consequently the shaded leaves and clusters, in this ‘terroir’ no significant improvements on grape composition were obtained. However, the worse (shaded) microclimate on higher densities reduced the fertility of basal buds.
Climate was substantially different in the 2 years, but in any of them, the introduced factors had an evident role in grape composition. On the other hand, for similar yields in both years, we observed smaller and more concentrated berries, in 2005, essentially due to the lower hydric resources.
Cluster thinning, conduced to significant yield losses without any quality improvement. The elevated costs of its execution (manual intensive labour) turn it into a practice that cannot be frequently used. On the other hand, shoot density and basal leaf removal didn’t affect grape composition in both years and, in 2005, shoot thinning reduced yield. As a consequence, we could think that any practice would be desirable. However, a substantial increase on pruning time was verified for D23. So, the best solution is the water shoot thinning from trunk and cordon, in order to obtain the medium shoot density (17 shoots/m of row).
ACKNOWLEDGEMENTS:
The present work was funded by the Project LUSOCASTAS, supported by the “Agência de Inovação” (AdI). We also acknowledge all the students that contributed for the data collection.
5. BIBLIOGRAPHIC REFERENCES
BOUBALS, D. (1989). Comment faire face aux excés de récolte porté par certaines souches de vigne. Le Progrès
Agricole et Viticole. 106: 541-542.
CASTRO, R.; CRUZ, A.; FIGUEIRA, L.; MOREIRA, M.; RIBEIRO, F.; RODRIGUES, C.; GOMES, C. (2005). “Shoot density and leaf removal effects on microclimate, yield, fruit composition and wine quality of the portuguese vine variety ‘Touriga Nacional’”. GESCO XIII journées du groupe d’étude des systèmes de conduite
de la vigne, Geisenheim, Germany, 2, 705-711.
DELOIRE, A; CARBONNEAU, A.; FEDERSPIEL, B.; OJEDA, H.; WANG, Z.; COSTANZE, P. (2003). La vigne et l’eau. Progrés Agricole et Viticole, 120, 4: 79-90.
JACKSON, D.I. and LOMBARD, P.B. (1993). Environmental and management practices affecting grape composition and wine quality: A review. Am. J. Enol. Vitic., 44: 409-430.
LOPES, C.M.A. & PINTO, P.A. (2005). Easy and accurate estimation of grapevine leaf area with simple mathematical models. Vitis. 44 (2):55-61.
OJEDA, H. (2001). Bases ecophysiologiques et choix tecniques dans la gestion de l’eau dans les vignobles d’Argentine. GESCO XI journées du groupe d’étude des systèmes de conduite de la vigne, Montpellier, France,
1, 75-86.
PERCIVAL, D.C.; FISHER, K.H. & SULLIVAN, J.A. (1994). Use of fruit zone removal with Vitis vinifera L. cv. ‘Riesling’ grapevines. I. Effects on canopy structure, microclimate, bud survival, shoot density and vine vigor.
Am. J. Enol. Vitic., 45(2): 123 – 131.
REYNOLDS, A.G. (1989).‘Riesling’ grapes respond to cluster thinning and shoot density manipulation. J. Am. Soc.
Hortic. Sci. 119: 847-880.
SMART, R.E. & ROBINSON, M. (1991). Sunlight into wine. A Handbook for Winegrape Canopy Management. Winetitles, Adelaide, 88 pp