Virtual Reality
Technology for Visiting
World Heritage
Buildings: An
Educational Approach
David Fonseca
1, Isidro Navarro
1,
Isabela de Renteria
2, Fernando Moreira
3,4,
´ 2 5
Alvaro Ferrer , and Oriol de Reina
Abstract
The main aim of this study is to assess the spatial perception of historical world heritage buildings using wearable technologies in an educational framework. The proposal seeks to complement the real experience of visiting the Casa Batllo´ Museum, an emblematic space (1904–1906, Antonio Gaudı´, Barcelona). The main innovative feature of the project is focused on the usability assessment of the video-guide indoor location-based system. The article addresses the first phase of a more complex project, analyzing the behavior of architecture students previously trained in modeling of complex buildings, in order to improve the system for a second phase that will be developed with students with special needs. Using an indoor location system for watching multimedia contents, we can improve the access, the visit, and the spatial perception of historical places for all kinds of students, with or without
1GRETEL – Research Group on Technology Enhanced Learning, La Salle, Ramon Llull
University, Barcelona, Spain
2Department of Architecture, La Salle, Ramon Llull University, Barcelona, Spain
3Research on Economics, Management and Information Technologies – REMIT, Portucalense
Institute for Legal Research – IJP, Universidade Portucalense, Porto, Portugal
4IEETA, Universidade de Aveiro, Portugal
5Department of Engineering, La Salle, Ramon Llull University, Barcelona, Spain
Corresponding Author:
David Fonseca, GRETEL – Research Group on Technology Enhanced Learning, La Salle, Ramon Llull University, C/Sant Joan de la Salle 42, 08022 Barcelona, Spain. Email: [email protected]
any special requirements. The results show a lack of usability of the system, especially due to the design of the mobile interface and to some loss of synchronization between the student position and the multimedia contents. However, the students have a better understanding of the museum’s characteristics because of multimedia content, as a clear improvement compared with the classic audio-guide.
Keywords
mobile indoor content, student mobile usability, student behavior, multimedia content, design architectural education, special needs for architecture contents, attention deficit hyperactivity disorder students
Introduction
Information and communications technologies (ICTs) have revolutionized our society, and consequently, our education (Dede, 2000). Nowadays, the ways we communicate, consult the news, watch television, or simply play have changed in order to adapt to new devices and applications, which mostly include char-acteristics such as mobility, interaction, and interconnection. Cultural activities have been a clear example of this revolution, with many interactive screens, multimedia shows, and a great variety of performances based on the use of ICTs. In addition, we can state that universal accessibility to culture and assistive learning environments are considered as fundamental human rights (Stephanidis & Savidis, 2001; United Nations, 1948).
In this regard, it is still easy to find examples of researches and projects aimed to the development and implementation of ICTs in cultural places, in order to improve the visitors’ experience (Grinter et al., 2002; Haugstvedt & Krogstie, 2012; Shu, 2016) and to o er them additional contents (Burigat & Chittaro, 2007). All these proposals can be classified into two categories: Those placed in a real space (museums, buildings, or expositive places; Chang, 2006) or inside a virtual zone (such as digital environments accessible via mobile devices; Sundar, Go, Kim, & Zhang, 2015). Both proposals link the visitor’s position to the art pieces and cultural heritage sites, giving access to additional informa-tion and content. Nevertheless, it is still di cult to find studies that evaluate how contents can be used for an educational purpose, and even more if the students have special necessities.
Following this last approach, we have performed our experiment in a real space: the World Heritage Building (WHB) and Museum Casa Batllo´ (1904–1906, Antonio Gaudı´, Barcelona, Spain). For that purpose, we have developed an educational system aimed to improve the understanding of the architectural space. The system locates the architecture student’s position, and
his or her position related with the points of interest (POI). Using a mobile indoor location video-guide, the system informs the student about where the next POI is and shows in the device additional virtual three-dimensional (3D) content about the constructive process and the uses designed by the architect.
The motivation behind this project is framed inside the core objectives of the architecture degree studies, which require the student to understand, visualize, and represent the architectural space, and to manage it using all kinds of infographic techniques, as well as critically evaluating the singular architectural spaces (Kray & Baus, 2003; Sharples, Lonsdale, Meek, Rudman, & Vavoula, 2007). In this context, architecture studies are often based on project develop-ment and its technical necessities (construction, structures, installations, etc.). Current approaches based on project-based learning (PBL) are helping students to adapt to a technical and complex learning technique. All these points of view can be resumed in our first hypothesis:
Hypothesis 1: The use of indoor location systems to serve 3D multimedia contents improves the experience when visiting a WHB.
As it will be seen, we have focused our case on students with attention deficit hyperactivity disorder (ADHD). The students with ADHD may be unable to control their impulses and have trouble paying attention. Adults with ADHD may have trouble managing time, being organized, and setting goals, but often they are very creative (Cramond, 1994; White & Sha, 2006), an aspect that enhances their link to architectural studies (Karlins, Schuerho , & Kaplan, 1969). Our job, and second working hypothesis, is located in the intersection of three aspects: the study and interpretation of singular architectural projects, the evaluation of ICTs applied to the visualization of said project, and the adaptation of devices and contents in order to optimize them for being used by students with ADHD.
Hypothesis 2: The indoor location system and the multimedia contents are per-ceived as an additional help that improves the contents understanding of a cultural visit in students with special needs.
The selection of our case study (Casa Batllo´ Museum) and the user sample typology (architecture students) is not fortuitous. The project was created in the technology-enhanced learning investigation group, a group recognized by the Generalitat de Catalunya, and belonging to La Salle Universitat Ramon Llull, based in Barcelona (Spain). Barcelona is the only city in the world with nine buildings recognized as WHB, six of them having been designed by Antonio Gaudı´. Of these six, only the Batllo´House provides a video-guide that locates the visitor’s position. At the same time, the 3D virtual contents that can be
visualized are related to the author’s uses and architectural intentions. In con-clusion, due to the architecture student’s basic competences of knowing and understanding singular architectural spaces, it is clear that we need to work with this kind of users in order to evaluate the proposed system in the visit to this building.
The research questions defined for our project are as follows:
. Research Question 1: Quantitatively evaluate the degree of usability and sat-isfaction of the architecture students in the visit to Casa Batllo´, using (or not) indoor-location video-guide system.
. Research Question 2: Qualitatively evaluate the improvement in the under-standing of WHB, using the interactive visualization system and identifying the critical points for its use in architecture educational framework, and for students with ADHD.
To analyze the proposal and assess the degree of usability of the system, we have adopted a mixed approach. The quantitative aspect of the approach con-sists of an experimental design (control and experimental groups), which explores the impact of the location-based technology when visiting this emblem-atic space from an architectural point of view. For this phase, we have used ISO 9241-11, previously used in educational cases, (Fonseca, Martı´, Redondo, Navarro, & Sa´nchez, 2014; Pe´rez-Cota, Thomaschewski, Schreep, & Gonc¸alves, 2014), which provides usability assessment guidelines of e ciency and user satisfaction. The qualitative aspect is a postvisit interview with a rep-resentative sample of the students involved in the project, who share their experi-ence with the appliance of this new technology to the visit. For this final stage, bipolar laddering assessment (BLA) has been used, a technique also previously validated in other educational experiments (Fonseca, Redondo, & Villagrasa, 2015; Fonseca, Valls, Redondo, & Villagrasa, 2016). Given that in our project we have only worked with four students with ADHD, this qualitative approach is the best option to extract some initial conclusions. As we have referenced, the qualitative studies are suitable for studies with low samples (less than 10), in front of the quantitative analysis that need for a minimum of 30 to 50 samples.
The next section of this article includes an overview of academic performance using ICTs and wearable technologies and discusses how this type of technology can improve students’ 3D spatial skills. We will focus in the education of archi-tecture or construction frameworks taking into account how ICTs can help students with special needs in the process of acquiring competences in an edu-cation where two strands are combined: the creative and the professional one. Then the project and the methodology followed in our experiment are described. Then the research results are included, which are discussed in the final section.
Literature Review
Mobile and Wearable Technologies for Cultural and Educational Issues
Some ICT-based cultural proposals aim at the visualization of 3D contents while others focus on the technological improvements of architectural places. In the first case, the accessible online platforms already allow interaction between the device and the exhibited objects. It enables a 360 view and connects it with systems that have created specific spaces and options for cultural places, such as Sketchfab (https://sketchfab.com/museums, Godin et al., 2002; Wojciechowski, Walczak, White, & Cellary, 2004; Younan & Treadaway, 2015). With the cited proposals, we can enrich the physical space of a museum and the information provided with extended digital data and references. Therefore, the visit can become more engaging, interesting, and generate a better emotional response from both the visitors (Alelis, Bobrowicz, & Ang, 2015; Haywood & Cairns, 2006; Sylaiou, Mania, Karoulis, & White, 2010) and more specifically the stu-dents (Bickmore, Pfeifer, & Schulman, 2011; Bouta, Retalis, & Paraskeva, 2012; Di Blas, Paolini, & Hazan, 2003).
An increasing number of museums are including new technologies in their visits, such as touch screens, interactive projections, new types of video-guides, and so on (Carrozzino & Bergamasco, 2010). With the emergence of mobile technologies, however, some of these experiences mix both elements, giving as a result new proposals where visitors provide the device necessary for the experience. This is known as Bring Your Own Device (Ballagas, Rohs, Sheridan, & Borchers, 2004). In this type of proposals, the mobile appli-cations exhibit additional contents to the physical elements, which benefit the art pieces and buildings. This approach relates to the academic framework, where we can find recent studies that describe the interaction between students and mobile devices as advantageous (AlOkaily, 2015; Song, 2014; Vanwelsenaers, 2012).
The cited projects are aimed at improving the navigation, interaction, and narrative of singular spaces; concepts that students and professionals of archi-tecture need to develop in their projects. In this framework, we can define the use of ubiquitous devices for viewing and interacting with advanced contents and educational proposals as a type of mobile learning. Mobile learning can go a step further by enabling teaching via wireless networks and mobile devices, allowing the learning process to take place anywhere, and at the same time ensuring teacher– student interaction (Moreira & Ferreira, 2015; Tsvetozar, Evgenia, & Smrikarov, 2004). This is known as situational teaching, where the device detects the context and provides relevant information. The combination of the network, a collaborative model, and the participation and sharing of information is able to generate new knowledge (Naismith, 2004). The use of touch screens, smartphones, and medium-sized tablets or iPads equipped with 3G, global positioning system (GPS), and long-life batteries allowed this concept
to develop toward new acquisitions of technological and pedagogical skills, des-pite the screen’s visibility limitations.
New technology implementations in the educational field have been largely extended to all types of levels and frameworks. In recent years, in addition to the use of technology in the classroom, new areas of research are open to assess and recognize more e ective and satisfactory teaching methods, such as gamification strategies (Kapp, 2012), PBL (Markham, 2011), scenario-centered curriculum (Gillani, 2000), and the recognition of capabilities that nonformal and informal education provide (Livingstone, 2012; Mesquita, Moreira, & Peres, 2016). The use of ICT in learning methods, especially in graduate and postgraduate archi-tecture, urban planning and design, or building engineering degrees is defined in the new academic plans (Anthopoulos & Fitsilis, 2010). It is important that students are able to develop competencies and skills related to active and col-laborative learning and digital information management, using roles and PBL exercises inside the context of the new smart cities. These teaching methods aim for a quicker and more e ective learning process, compared with traditional educational methods.
Architecture Education: Spatial Understanding and Special Needs
Visual knowledge is one of the most relevant aspects with which the architec-ture student works, due to the substantial amount of cultural data present (Boeykens, Santana-Quintero, & Neuckermans, 2008). Spatial information is represented in a variety of ways, ranging from traditional methods, such as printed plans and physical models (working from 2D to 3D) to modern meth-ods, such as digitally printed plans and tridimensional models, which allow for a greater level of detail and the ability to navigate and consider potential changes instantaneously. The di erent visualization methods allow both stu-dents and professionals to work collaboratively and to communicate their ideas more e ciently (Bouchlaghem, Shang, Whyte, & Ganah, 2005). Specifically, in our educational framework, we can find works related with excavation, staking, inspection, coordination, or supervision of tasks (Shin & Dunston, 2008); building rehabilitation (Ramos, Siret, & Musy, 2004); the need to predict the impact of construction on the landscape (Sa´nchez & Borro, 2007); and the checking of final proposals at a one-to-one scale (Tonn, Petzold, Bimber, Grundho¨fer, & Donath, 2008).
The Plan of Studies at La Salle Architecture Degree organizes the teaching-learning process so that the students get the abilities established as objectives (abilities), annexed to the Order EDU/2075/2010, and that follow the Directive 2005/36/CE from the European Parliament and Council on minim conditions to be accomplished by any plan of studies for an architectural degree. There are 11 objectives established, from which we extract the one relates to the subject we are dealing in our proposal: ‘‘Ability to understand the relationship between people
and buildings, between buildings and their environment, as well as the need to relate buildings to the spaces around them according to human scale and needs.’’ The specific academic abilities for the profession were defined by the White Book for Architectural studies, promoted by the Agencia Nacional de Evaluacio´n y Acreditacio´n (ANECA). These specific abilities are divided in two kinds: abil-ities (A) and knowledges (B) and are established in the mandatory modules of subjects for the architecture plan of studies collected within the valid Order EDU/2075/2010 annex. Within the design module established by that Order are the following abilities and knowledges:
. Removing barriers (A5): Ability to design and construct buildings and urban spaces fitted to people with di erent physical abilities or to adapt the existing ones to that purpose.
. Practical and symbolic functions (B1): Appropriate knowledge of the meth-ods of study on symbols, ergonomics, and the relationship between human behavior and the environment and the objects around, according to human scale and its requirements.
. Living sociology (B2): Appropriate knowledge of the methods of study on social needs and requirements, on quality of life components, living condi-tions, and basic housing programs.
. Cultural sociology (B3): Appropriate knowledge of implications on the design function and social responsibilities of the architect related to the needs, values, behavior standards and organization, as well as spatial and symbolic patrons that are determined by belonging to a specific culture.
Students with ADHD may struggle with academic tasks that place significant demands on working memory (Martinussen & Major 2011). Visual and spatial comprehension is a remarkable part of the architectural students training. In the Baddeley’s (2000) theoretical model of working memory, one of the two limited-capacity short-term memory components is the visual sketch pad, responsible for the short-term storage of visual-spatial information. That comprehension involves an abstract pattern that provokes working memory overload and hinder the process of learning for students with ADHD (Martinussen & Major 2011).
Related with technology and visual representation, we find described also the following competences: Graphic ideation (A6), space representation (A7), and knowledge of systems of graphic representation (B5–B6). Following these rules, in the last years, and bearing in mind the diversity of possible disabilities (phys-ical, psychic, or sensory; Dodd & Sandell, 2001; Navarro & Fonseca, 2009), there have been carried out some concrete performances to improve of the accessibility in public spaces. In most of the cases, these proposals were not based on the basic rules of ‘‘Universal Design’’ (Connell et al., 1997). The con-cept of ‘‘Universal Design’’ integrates the characteristics and needs for a wide
population’ universe, generating products, and suitable environments for the use of the biggest number of persons without need for adaptations or a specializing design (Choi, Yi, Law, & Jacko, 2006).
Learning design projects and visual proposals that can stimulate their interest and catch their attention in need to ensure an e ective learning process (Ab Aziz, Ab Aziz, Paul, Yusof, & Noor, 2012), and new technology advanced devices may work as support and improve spatial comprehension instructional practices to prevent working memory overload, through the division of the overall explan-ation into smaller pieces and the chunking into a number of subcomponents (Baddeley, 2000). Breaking complex projects into several key steps or compo-nents may reduce the working memory demands of complex academic tasks. A video-guide based on the user’s position o ering 3D virtual contents in mobile devices may help to remember a series of locations, introduce them as passages of an overall story, integrating them in a sequence, and experience and contri-buting to a combining of verbal and visual information integration.
In the last decade, the number of students classified as being a ected with ADHD is reaching a very serious level. The student’s perception through the interaction with mobile devices, virtual, and augmented contents in both, real and artificial worlds are facilitating their learning process. The students can perceive these type of interactions as 3D serious games, a methodology that has demonstrated its utility improving the students’ attention (Roh & Lee, 2014). We consider that combining the use of constructivist pedagogies (based on PBL) and virtual models helps students reflect on the use of related methods and technologies in architecture and urban design and cultivates additional skills such as self-directed learning, intrinsic motivation, and critical thinking (Koutsabasis & Vosinakis, 2012).
The physical and communication barriers tend to disappear in some museums, WHBs, cultural exhibitions, and so on, especially in those of new construction. Nevertheless, many barriers of the communication still exist, both by the absence of formation of the educational equipment and by the absence of adaptations in the designs of exhibitions, material, audio-visual, and so on. Nowadays, numerous entities and museums o er di erent choices of accessibility. The Art Education of the Blind in New York has started numer-ous programs in collaboration with other organizations (Axel, 2003), focusing on people with blindness, which are probably the group with the largest number of solutions for these type of spaces (Ginley, 2013).
These projects synthesize the methodological progress put into practice by Art Education of the Blind in their accessibility programs, focusing on the case study of teaching The History of Art (Mun˜oz Arroyo, 2007). Various British Museums, among which The British Museum (2016) have implemented services to make their content more accessible to all users with visual, auditory, physical, or even learning di culties. In this last case, they have adapted certain
permanent content as temporary for guided tours. To improve the organized tours within the museum environment, it is noteworthy the cases of Omero in Ancona and Anteros in Bologna. In the first one, you can find all the informa-tion in braille and thinking of their mobility they have implemented an electric system (‘‘walk assistant’’) that permits them to receive information about the pieces that are exposed (Grassini, 2012) following a yellow line on the floor with a special cane.
In Spain, outstanding is the e ort put into the creation of the ‘‘Tiflolo´gico’’ Museum assisted by the ONCE (Spain’s National Blind Organization). The objective is to o er people with blindness the possibility to enter a museum in the same way as sighted visitors, without their ocular deficiency creating a barrier for the user at the hour of studying and enjoying the exposition (Benito, 1993). The creation of this museum and the collections gathered in it comes from the detailed studies of di erent historic records (Cano, 2001) in the generation of museums adapted for people with diverse disabilities. In Portugal, the Money Museum and the Interpretation Centre of King Dinis’ Wall aim, for 2017, is to have inclusive spaces, providing all visitors physical, sensory, and intellectual access to the collection’s contents, through immersive museography adjusted to persons with low mobility, blind or visually impaired, mentally handicapped, and deaf and hearing impaired.
Beacons Indoor Positioning
The qualitative leap in the process of displaying specific content to visitors is locating their position and providing them with optimal information related to their surroundings. In this regard, we clearly need to di erentiate outdoor and indoor locations, both with their problems and particular solutions. Outdoor positioning systems that allow users to know and share their physical or geo-graphical location are recognized as a key point in the development of mobile applications (Steinfield, 2004). To achieve practical implementations, we can find previous researches focused on several possibilities, ranging from ultra-sound to radio transmission systems (Pahl, & Radar, 2000), without forgetting the most extended positioning technology, the GPS. In all of these cases, the need of a direct view from satellites precludes their use in closed environments such as o ces, stores, homes, or museums. Their degree of accuracy depends on the area of work (Prost, Godefroy, & Terrenoir, 2008).
Indoor location has various possible approaches, all of them depending on the type of technology used. Among the technologies that have historically been used for such purposes, we can cite the motion capture, cell triangulation, GPS navigation, Wi-Fi positioning systems, Bluetooth connections, hybrid position-ing, and beacons. In our case, Casa Batllo´Museum has adopted the beacons as their indoor positioning system to browse in the video-guide devices the
multimedia contents of the visit. The advantages of working with the Estimote beacons selected are based upon two criteria: their work with Bluetooth 4.0 (type Bluetooth low energy, minimum power consumption with as much data as pos-sible), and its appearance, which recalls the typical forms of Antonio Gaudi’s mosaics (Architect, and author of Batllo´House).
The Beacon is a standard development by Apple that works over a Bluetooth low energy protocol. It is focused on the transmission of data over short dis-tances with low energy consumption and maintenance (Navarro, de Reina, Rodiera, & Fonseca, 2016). The installation of a single device per room is enough to visit an area of interest, but as we can see in our study, it can be better to add more if the space is complex.
Mixed Methods Applied in Educational Approaches Using Technology
In the experimentation and scientific research of working hypotheses based on student’s response, a basic issue is the correct design of methods that allow data extraction. The classic tool in this context is the survey, which is often designed to measure student response concerning the usability of a system, his or her perception in general and the degree of satisfaction with the proposed method, in the context of a teaching environment. If we have many samples, we can manage collected data quantitatively, and the results can be studied and compared in order to find statistically di erences. With fewer users, how-ever, the qualitative approach has proven to be equally valid with the ability to obtain a detailed explanation of the variables of the study (Delamont & Atkinson, 2010).
In this frontier, a hybrid approach to experimental methodology has emerged, which takes a more holistic view of methodological problems: the mixed-methods research approach. We can define the mixed-method research as the natural complement to traditional qualitative and quantitative research (Creswell, 2013; Johnson & Onwuegbuzie, 2004). This model is based on a prag-matic paradigm that contemplates the possibility of combining quantitative and qualitative methods to achieve complementary results. The value of research lays not so much in the epistemology of the method, but in its e ectiveness (Tashakkori & Teddlie, 2004): On the one hand, quantitative research methods are considered objective (Sale, Lohfeld, & Brazil, 2002; Vigo, Aizpurua, Arrue,
& Abascal, 2011). On the other hand, qualitative research focuses on detecting and processing intentions. Unlike quantitative, qualitative methods require deduction to interpret results. The qualitative approach is subjective, as it is assumed that reality is multifaceted and not reducible to a universal indicator (Pfeil & Zaphiris, 2010).
Qualitative methods are commonly employed in usability studies (User experience), inspired by experimental psychology and the hypothetical-deductive
paradigm, employing a relatively limited number of users. Unlike the objective hypothetical-deductive approaches, this psychological model defends the subjective treatment of the user (Fonseca et al., 2015).
Project Description: Methodology
Assessment Methodology
As we said in the introduction section and we have justified in the theoretical framework of the article, we will be doing an evaluation by means of combining quantitative and qualitative methods that will allow us to discuss our hypothesis and its correlation with the results.
For the quantitative approach, we will use the usability rules described on the ISO 9241-11, which provides several usability guidelines. All of the questions were scored on a 5-point Likert scale (1 ¼ never or strongly disagree, 5 ¼ always or strongly agree). The model used was based on prior recommendations from Martı´n-Gutie´rrez (2010) and was successfully used in other teaching experiments (Fonseca et al., 2014). We focused on assessing three main variables for all the groups:
. E ectiveness (E1) defined as the user’s ability to complete tasks during the proposal in relation to ‘‘accuracy and integrity.’’
. E ciency (E2) defined as the assigned resources (questions related to the expenditure of time and e ort for solving the proposed exercise).
. Satisfaction (S1) defined as the subjective reactions of users to the project.
For the qualitative approach, we will use the BLA (Pifarre´& Tomico, 2007). Following the Socratic paradigm stated earlier, we adopted the BLA system (BLA), which works on positive and negative poles to define the strengths and weaknesses of the proposal. After that, the laddering technique is applied to define the relevant product details. The characteristics obtained through ladder-ing help to define what specific factors make an element a strength or a weak-ness. Conducting a BLA consists of three steps:
1. Elicitation of the elements: The interview starts with a blank template for the positive elements (strengths) and an identical template for the negative elem-ents (weaknesses).
2. Marking of elements: Once the list of positive and negative elements is com-pleted, the interviewer will ask the student to score each one from 0 (lowest possible level of satisfaction) to 10 (maximum level of satisfaction).
3. Element definition: The questions ‘‘Why is it a positive/negative element?’’ and ‘‘Why this score?’’ are asked. The answer must include a specific
explanation of the exact characteristics that make the mentioned element a strength or weakness of the product.
From the results obtained, the next step was to polarize the elements based on two criteria: Positive (Px) or Negative Elements (Nx), and Common (xC) or Particular Elements (xP).
In the Results and Discussion section, we will reflect the existing relationship between the results obtained by both methods and the way they may influence in the future experience improvements and its interactions.
Project Design: Indoor Positioning System and Multimedia Contents
The aim is to propose a wireless system, which o ers 3D virtual content that complements the visit, using a video-guide based on the user’s position. The museum o cials detected disorientation problems among the users of the cur-rent video-guide during their visit; visitors did not mark the correct POI guide number associated to their position and therefore missed important content resulting in an unsatisfactory or poor comprehensive visit experience. For that reason, the Casa Batllo´ managers commissioned the design of a new system based on the user positioning through Beacons, so that the video-guide could alert of the multimedia contents to visualize, trying to help to make a well-organized visit through the museum. The development of the project was carried out according to the following phases:
. POI definition: Jointly, Batllo´House managers and the Company Lab4Glass (start-up led by the authors of this article and with the participation of La Salle students) defined the POIs and the type of contents to be displayed in the mobile devices.
. 3D modeling: Once the POIs were defined, The Polytechnic University of Valencia was subcontracted for the production of virtual contents, all under the supervision of Batllo´managers.
. Location studies: Parallel to the previous point, the devices (beacons and mobile devices) were programmed with the information detailed in the fol-lowing section.
. User experience: Finally—with the collaboration of architecture students pre-viously trained in 3D architectural representation—we have conducted a usability study in order to assess the usefulness of the proposed Casa Batllo´ video-guide. The idea was to assess the possibility of using similar proposals in the academic and professional fields to show 3D architectural projects. In addition, we had the opportunity to assess the behavior of a group of students with ADHD, and based on their opinions, identify the future needs of the system that may rise for the architecture comprehension in this special locations and for visitors with the similar problems.
The research design of the study was quasi-experimental with grade students on a volunteer basis. The students were divided into experimental, control group, and students with ADHD.
Evaluation Design
The model of the study was quasi-experimental. This method is used to deter-mine the cause and e ect relationship between variables and to identify the reactions of participants under certain conditions. The quasi-experimental method is a design, which involves disregarding random distribution in sending participants to control and experimental groups.
Plenty of models can be used to design the responses of implementing new technologies in cultural heritage sites for architecture educational proposes, focusing on the e ciency, e ectiveness, and level of satisfaction or usability of a proposal (Martı´n-Gutie´rrez, 2010; Navarro et al., 2012; Stanney, Mollaghasemi, Reeves, Breaux, & Graeber, 2003). In our case, the stages of the method proposed were carried out as follows:
. The first step was to the set the POIs location. This process was necessary in order to configure digital devices, create the multimedia content modeling shown in them, and to set the beacons position, which must locate the visitor’s video-guide and indicate him or her to open the informa-tion available. Succeeding to the study of the Batllo´ House characteristic morphology, and after various trials, Figure 1 shows the beacons location for the proposal.
. In the second step, the multimedia content using AutoCAD, 3DMax, and Revit Architecture1 was created. In addition, an Android application was developed using Unity, which interprets the files programmed in C# and JavaScript for the positioning configuration. This positioning is determined through the user’s triangulation. Because in the Batllo´house there is a large signal oscillation, the radio frequency signal (Bluetooth type) and its power have been studied using a numerical simulation of di erent variables and filters. These oscillations depend on the user’s orientation, the transmitter, the geometry of the spaces, the magnetic interferences, and so on, factors that alter the signals intensity, and therefore shall be taken into account into the calculations (Figure 2).2
. Finally, in the experimental phase of the designed method, the following steps were followed:
1. One experimental group visited the Batllo´House using the video-guide with beacon-based indoor location, and one control group visited the museum using the video-guide without any location system. The students were
Figure 2. Indoor location based on numeric simulation.
provided with the guide systems for the visit and were given 2 hours to com-plete it.
2. The students’ assignments to be developed during the visit were as follows: . To make a complete visit to the visible areas of the museum (three stories). . To make an organized visit following the POIs initially configured.
. To evaluate to what level the video-guide—either with positioning system or without it—was helpful to the organized visit.
. To evaluate to what level the multimedia contents included in the devices have been able to make understandable the uses and the architectural features of the museum.
3. To get the student’s feedback after finishing the visit, the students filled out the inquiry designed for that purpose, whose results can be seen in the Results section. Likewise, back at the school, they made the BLA individually at the department.
Results
As stated earlier, in order to evaluate the degree of adaptation to and satisfac-tion with the proposed method, as well as the advantages of working with a mixed system of data collection, students were invited to voluntarily participate in the study. From the 32 students enrolled, 15 were assigned to the experimental
group (G1, included two students with medium level of ADHD), and 17 to the control group (G2, also with two students that have a 30% of ADHD certified). The experimental group was composed by eight females and seven males, with a average age of 21.5 years old (SD ¼ 1.8), and the control group by nine females and eight males (average age ¼ 20.0 years old, SD ¼ 0.5). We divided them using a random distribution, and after that they passed a user profile test (or pretest), in order to assess their interest and motivation on using mobile technologies in education and in architecture professional work. The goal of this step was to find possible significant di erences between the experimental and the control group, an issue that can bias the results.
We descriptively highlighted the following items: All students (100%) connect online both at home and university, mainly using laptops and mobile devices. The main connection type in mobile devices used by students are Wi-Fi (95.3%) and 3G Internet (65.9%). The most commonly used services are mainly e-mail (100%), browsers and download services (84.3%), and university queries related to architecture (100%). The use of chat rooms, blogs, news, or queries is less frequent (over 25%); 100% of the students have a smartphone, and these stu-dents are more accustomed to working on portable laptops (97.3%) than on desktop computers (64.8%). Only 36% of students have a tablet device. Table 1 contains the principal statistics obtained from the most directly related study
Table 1. Descriptive Statistics for Main Measures of Student Profile Test by Group (G1: Experimental [n ¼ 13], G1*: Students With ADHD [n ¼ 2], G2: Control Group [n ¼ 15], and G2*: Students With ADHD [n ¼ 2]).
User profile test G1 G1* G2 G2* New technologies
General interest in computers and technology advances 4.8 5.0 4.3 4.5 Time spent using computer or laptop per day (in hours) 3.5 3.0 3.0 3.0 Time online using Internet services per day (in hours) 2.5 2.0 2.2 2.0 Time spent using mobile services per day (in hours) 1.5 1.0 1.8 1.5 Level of satisfaction using online services 4.6 4.5 4.7 4.5 New technologies in architecture
Level of knowledge about the 3D technology 4.2 4.5 4.0 4.0 Level perceived of useful related with architecture degree 4.0 4.0 4.2 4.0 Predictable level of improvement using AR or VR in presentations 4.2 4.5 4.1 4.0 Predictable level of difficulty using AR or VR technology 3.6 3.5 3.4 3.5 Help to understand the space and nonvisual elements 3.8 3.5 3.8 4.0
questions. In general, the students are heavy technology consumers, both in usage daily time, and in interest.
Pretest mean scores are similar in all groups (and without any statically dif-ference between students with or without ADHD), and to estimate the prob-ability that groups are significantly similar, we used the student’s t test (Gosset, 1908), using a null hypothesis (H0) that there are no di erences in scores between groups.
Statistical significance (two-tailed) is p ¼ .958, which exceeds the thresh-old of p ¼ .05, meaning that there is a very low probability that the groups are di erent in their perceptions and motivation. One-way between-group analysis of variance using pretest scores as the covariant was conducted to compare personal use: With respect to the use of devices or technologies related to edu-cational use, there are no statistically significant di erences between the di erent groups or by gender (F ¼ 0.279, p ¼ .762).
All data obtained are based on a small sample, and for this reason, we under-stand that at a future line of the work, it would be necessary to reply the work with more students in order to confirm the results obtained. However, we can find previous research that have demonstrated there is no fundamental objection to using a regular t test with small sample sizes, even a sample size of two did not generate problems (de Winter, 2013), neither with only two samples of students with ADHD (Lin, Yu, Chen, Huang, & Lin, 2016). Moreover the qualitative approach is a method that can support this problem and will allow us to estab-lish relations between the variables of the study.
Quantitative Assessment of Usability
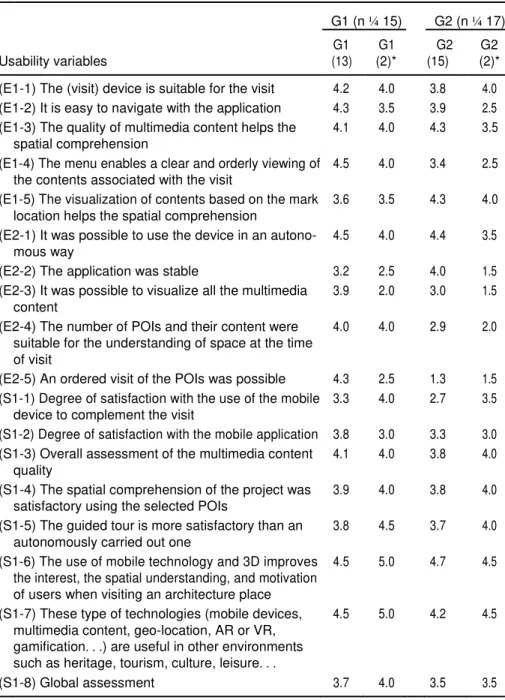
After visit completion, the posttest was completed. The main purpose of this test was to evaluate student visit assessments, the 3D contents, and the support technology. Through the structured test, based on ISO 9241-11, it was possible to evaluate the feasibility of using video-guide with 3D contents based on visitor location on mobile devices in architectural environments while focusing on the usability guidelines of e ectiveness (E1), e ciency (E2), and satisfaction (S1). Table 2 shows the student’s responses of the usability posttest.
Using a null hypothesis (H0) stating that there are no di erences in scores between groups (G1 vs. G2), we find a statistical significance (two-tailed) of p ¼ .0457, which does not exceed the threshold of p ¼ .05, and means that there is a high probability that the groups are di erent in their usability evalu-ation. The results indicate a significant di erence among the G1 (usability aver-age of 3.99, with low variance ¼ 0.15) and the control group (G2 average of 3.56 and with more distributed variance of 0.59). Focusing in the results of the stu-dents with ADHD (and taking into account that is not significant the compari-son due to the little sample), we find the high di erences in the experimental group for E2-3 (1.92 points), E2-5 (1.81), E1-2 (0.81), and E2-2(0.73) questions. In the control group, the high di erences are located in the questions E2-2 (2.5
Table 2. Global Usability Results.
G1 (n ¼ 15) G2 (n ¼ 17)
G1 G1 G2 G2
Usability variables (13) (2)* (15) (2)* (E1-1) The (visit) device is suitable for the visit 4.2 4.0 3.8 4.0 (E1-2) It is easy to navigate with the application 4.3 3.5 3.9 2.5 (E1-3) The quality of multimedia content helps the 4.1 4.0 4.3 3.5
spatial comprehension
(E1-4) The menu enables a clear and orderly viewing of 4.5 4.0 3.4 2.5 the contents associated with the visit
(E1-5) The visualization of contents based on the mark 3.6 3.5 4.3 4.0 location helps the spatial comprehension
(E2-1) It was possible to use the device in an autono- 4.5 4.0 4.4 3.5 mous way
(E2-2) The application was stable 3.2 2.5 4.0 1.5 (E2-3) It was possible to visualize all the multimedia 3.9 2.0 3.0 1.5
content
(E2-4) The number of POIs and their content were 4.0 4.0 2.9 2.0 suitable for the understanding of space at the time
of visit
(E2-5) An ordered visit of the POIs was possible 4.3 2.5 1.3 1.5 (S1-1) Degree of satisfaction with the use of the mobile 3.3 4.0 2.7 3.5
device to complement the visit
(S1-2) Degree of satisfaction with the mobile application 3.8 3.0 3.3 3.0 (S1-3) Overall assessment of the multimedia content 4.1 4.0 3.8 4.0
quality
(S1-4) The spatial comprehension of the project was 3.9 4.0 3.8 4.0 satisfactory using the selected POIs
(S1-5) The guided tour is more satisfactory than an 3.8 4.5 3.7 4.0 autonomously carried out one
(S1-6) The use of mobile technology and 3D improves 4.5 5.0 4.7 4.5 the interest, the spatial understanding, and motivation
of users when visiting an architecture place
(S1-7) These type of technologies (mobile devices, 4.5 5.0 4.2 4.5 multimedia content, geo-location, AR or VR,
gamification. . .) are useful in other environments such as heritage, tourism, culture, leisure. . .
(S1-8) Global assessment 3.7 4.0 3.5 3.5
Table 3. Pooled Data of Usability Variables.
G1 (n ¼ 13) G2 (n ¼ 15) Critical p Variables Mean SD Mean SD t statistic t (two-tailed) Effectiveness (E1) 4.11 0.19 3.87 0.13 1.053 2.306 .323 Efficiency (E2) 3.89 0.15 3.00 0.34 1.943 1.617 .051 Satisfaction (S1) 3.99 0.15 3.73 0.27 1.408 2.178 .184
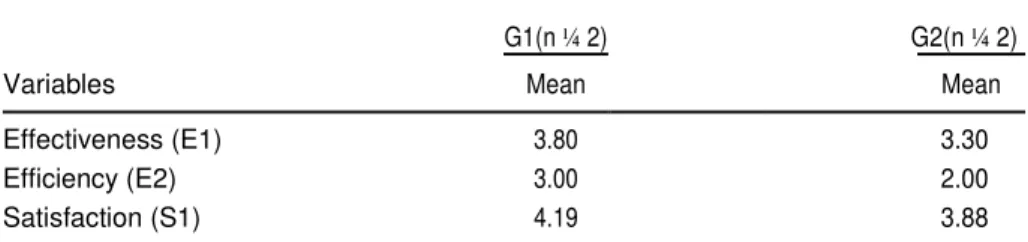
Table 4. Pooled Data of Usability Variables of ADHD Students.
G1(n ¼ 2) G2(n ¼ 2)
Variables Mean Mean
Effectiveness (E1) 3.80 3.30 Efficiency (E2) 3.00 2.00 Satisfaction (S1) 4.19 3.88
points), E2-3(1.5), E1-2 (1.37), and E2-4(0.93). Both control and experimental groups of students with ADHD are clearly di erentiated in the responses to questions: E1-2, about the usability of the system, and E2[2-5], where the 80% of the questions are related with the e ciency of the proposal.
Studying the average responses related to e ectiveness (E1) and satisfaction (S1), we may conclude that they are very similar for both groups (G1 vs. G2) and are not statistically significantly di erent, as shown in Table 3. On the other hand, the comparison of e ciency (E2) between groups has a p ¼ .051, a value that confirms the di erence between our working groups.
Focusing in the results of students with ADHD, the values obtained and grouped according to the main usability variables, the results can be seen in Table 4.
The data show significant di erences in the e ciency (E2) in the experimental group (p ¼ .040, in comparison with the students of the same group, Table 3), being the only usability general factor with a value clearly di erent between the typology of students.
Qualitative BLA
As we have commented earlier, each student was interviewed, based on the BLA, in the University department. The objective of this process is to analyze the visit focusing on the understanding of the space, and the help that can be given the
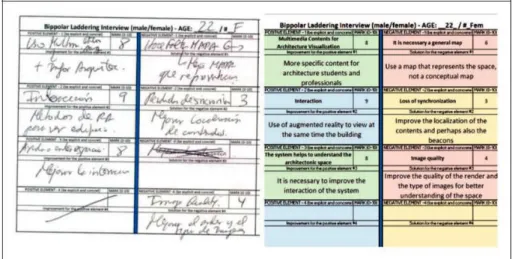
Figure 3. BLA interview example (original and transcription).
Table 5. Positive Common (PC) Elements.
Positive common (PC) Av score (Av) Mention index (MI, %) 1PC The use of VR for viewing additional data 8.42 100 2PC Interactivity or usability 9.00 57 3PC The system helps to understand the space 9.00 57 4PC The combination of audio and video data 9.50 28 5PC Advertisements for near POI 9.50 28
Note. VR ¼ virtual reality; POI ¼ points of interest.
visit system proposed. In Figure 3, we can see an example of categorization of BLA interview responses.
BLA consists of three steps: elements elicitation, marking of elements, and element definition, previously explained in this article. From the results obtained, the next step was to polarize the elements based on two criteria: Positive (Px) or Negative (Nx) elements, (Tables 5 and 6), and based on their number of citations common (xC) or particular (xP) elements.
In this type of analysis, the positive and negative common (PC or NC) elem-ents are the most representative because they are the most cited. Depending on the reference rate and its average obtained value, we can identify the most rele-vant elements.
Once the features mentioned by the students are identified and given values, the third step, the qualitative stage, as defined by the BLA can start. Here,
Table 6. Negative Common (NC) Elements.
Negative common (NC) Av score (Av) Mention index (MI, %) 1NC Loss of synchronization in movement 4.33 85
2NC A digital map is necessary to navigate 3.66 57 3NC Image quality 5.00 42 4NC Screen size 4.33 42 5NC It is difficult to understand the interface 4.00 36 6NC Video details 4.00 28 7NC Screen reliance 3.66 28
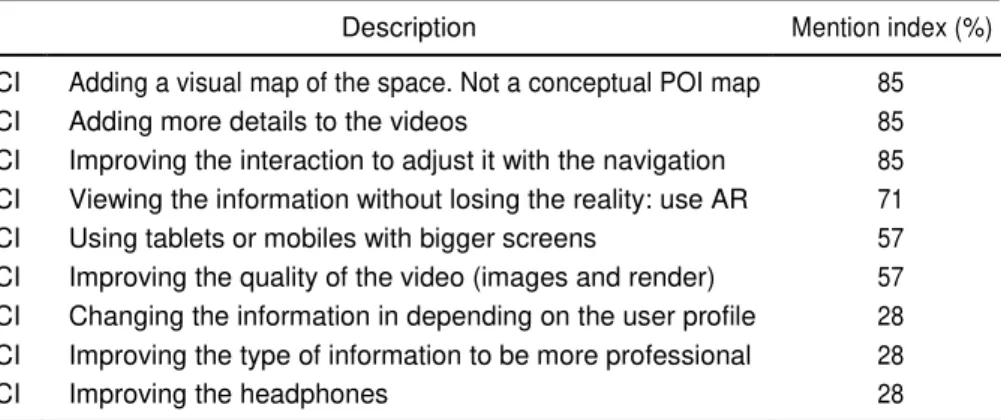
Table 7. Proposed Common Improvements (CI) for Both Positive and Negative Elements.
Description Mention index (%) 1CI Adding a visual map of the space. Not a conceptual POI map 85 2CI Adding more details to the videos 85 3CI Improving the interaction to adjust it with the navigation 85 4CI Viewing the information without losing the reality: use AR 71 5CI Using tablets or mobiles with bigger screens 57 6CI Improving the quality of the video (images and render) 57 7CI Changing the information in depending on the user profile 28 8CI Improving the type of information to be more professional 28 9CI Improving the headphones 28
Note. AR ¼ augmented reality; POI ¼ points of interest.
students describe and provide solutions or improvements to each of their con-tributions in the format of an open interview. The common elements that are mentioned more frequently (Table 7) are the most important aspects to use, improve, or modify (according to their positive or negative sign). Other elem-ents, especially those identified by a single user only, may be ignored or addressed in later stages of development.
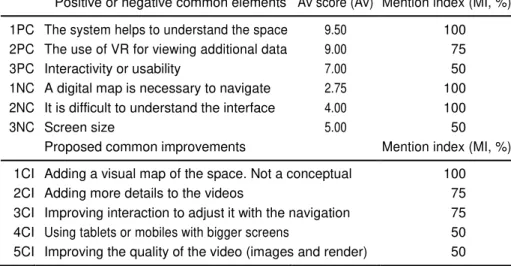
If we focus on the data obtained from interviews with ADHD students, the aspects identified, their assessments, and possible improvements are summarized in Table 8.
The results show a di erent prioritization of these students’ answers regard-ing the result of the interview with the rest of the students. The students with ADHD consider the proposal of great help for the spatial compression of the museum, emphasizing on the need to redesign the graphic interface, which does not help in this task.
Table 8. Positive and Negative Common elements and Main Improvements Proposed for Students With ADHD.
Positive or negative common elements Av score (Av) Mention index (MI, %) 1PC The system helps to understand the space 9.50 100 2PC The use of VR for viewing additional data 9.00 75 3PC Interactivity or usability 7.00 50 1NC A digital map is necessary to navigate 2.75 100 2NC It is difficult to understand the interface 4.00 100 3NC Screen size 5.00 50
Proposed common improvements Mention index (MI, %) 1CI Adding a visual map of the space. Not a conceptual 100 2CI Adding more details to the videos 75 3CI Improving interaction to adjust it with the navigation 75 4CI Using tablets or mobiles with bigger screens 50 5CI Improving the quality of the video (images and render) 50
Note. VR ¼ virtual reality; PC ¼ positive common; NC ¼ negative common; CI ¼ common improvements.
Data Discussion
Based on the homogeneity of both groups assessed in the pretest, we used student’s t test to review the quantitative point of view, with the null hypothesis (H0) that there
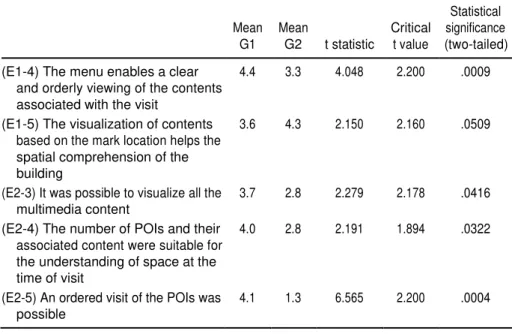
would be di erences in mean scores between the groups. The results show significant di erences between the two groups trough five indicators (Table 9).
By analyzing in detail, the values obtained for these indicators, and by relat-ing them to the answers obtained from the BLA, we can obtain an approach to the significant di erence that we have found.
. E1-4: The lack of help on the POI’s orderly localization su ered by the con-trol group is settled as the main variable causing the low score obtained in this aspect, as opposed to the one obtained from the experimental group. The sequence of the visit depends on the user’s orderly visual search of the POIs, not on the support generated by the video-guide (as it is in the case of the experimental group provided with that visual help). This aspect is directly related to the need of incorporating an installation map to orderly orient the user (see the common negative answer from BLA: NC-2). This need is one of the most mentioned aspects at the BLA, by up to a 57%, and it is very negatively scored (Av: 3.66). We must also add the di culty to understand the graphic interface (NC-5), given that it is another of the most commonly named negative aspects (Av: 4.00, MI: 36%) that would complete the answer obtained at that indicator. The highly positive result from the experimental
Table 9. Usability Variables With Statistic Differences Among Groups (t Student Analysis). Statistical Mean Mean Critical significance
G1 G2 t statistic t value (two-tailed) (E1-4) The menu enables a clear 4.4 3.3 4.048 2.200 .0009
and orderly viewing of the contents associated with the visit
(E1-5) The visualization of contents 3.6 4.3 2.150 2.160 .0509 based on the mark location helps the
spatial comprehension of the building
(E2-3) It was possible to visualize all the 3.7 2.8 2.279 2.178 .0416 multimedia content
(E2-4) The number of POIs and their 4.0 2.8 2.191 1.894 .0322 associated content were suitable for
the understanding of space at the time of visit
(E2-5) An ordered visit of the POIs was 4.1 1.3 6.565 2.200 .0004 possible
Note. POI ¼ points of interest.
group could be based on the positive answer from the BLA, since the announcement of the nearest POI mitigates the menu’s possible interpretation problems (Positive Common #5: Av: 9.50, MI: 28%).
. E1-5: From the analysis of this variable, and reviewing the comments obtained from the BLA, it may be deduced that the low assessment by the experimental group is largely due to the device sync problems (NC-1, Av: 4.33, MI: 85%). One of the identified aspects, both at the initial testing phase and at the final one, is that the lack of beacons, as well as the excess of them generates tuning jumps and loss of the multimedia content visualization. In addition, the singularity of Casa Batllo´’s morphology did not help, and thus a new future phase is needed to refine the localization of those devices and to activate their tuning with the POIs at the video-guide. Nevertheless, the scores are high, and the visualization of multimedia contents for the architectural space comprehension are positively reflected at the BLA answers (PC1, Av: 8.42, MI: 100% and PC3, Av: 9.00 with MI: 57%).
. E2-3: This variable is among the three less scored at the usability test (both in the experimental and control group), being the answer especially negative. Searching its justification from the BLA data, we highlight the following answers: NC-1, with an Av: 4.33 and MI: 85% and the problem of a small screen visualization (NC-4, Av: 4.33, MI: 42%). Both responses are related to the sense of a low image quality (NC-3, Av: 5.00, MI: 42%), and loss in the
capacity to visualize the details (NC-6, Av: 4.00, MI: 28% and NC-7, Av: 3.66, MI: 28%), an issue with previous reports (Fonseca, Pifarre´, & Redondo, 2013). . E2-4: This variable, as it was expected, negatively a ects to the control group. The
lack of indications to localize the defined POI, and the irregular environ-ment like the space at the Casa Batllo´, may generate an incomplete experience (NC-2, Av: 3.66, MI: 57%). We may directly link the need for more POIs and more information associated to each of them (multimedia content), depend-ing on the morphology of space. To understand complicated locations, there is a need for more POIs and the possibility of complementary information in every one of them, as it is reflected at the BLA. Some improvements could be made by adding di erent information depending on the user profile and add-itional details, as highlighted at the common improvement no. 7 and no. 8 both with MI: 28%. . E2-5: The result of this variable is one of the factors that depend directly on the
proposed system, or better said, on the lack of it. The control group’s response is the worst from the test and clearly shows how the current guide does not allow for an orderly visit without the help of a location system, (as reflected both in negative at the BLA, NC-2, Av:3.66, MI:57%, as in positive at the experimental group: PC-5, Av: 9.50, MI:28%). We may extend this aspect to the majority of current guide proposals that we find at museums and emblematic places, since most of them are based on POI’s visual identification and on its selection in the visit device. Consequently, some are easy to skip, if they are not clearly visible or visualized.
By analyzing the data obtained by the students with ADHD —that we have previously presented in the discussion of Table 2— and relating them to the data presented in the BLA (Table 8), we can obtain an approach of results:
. The learning process—where the visual aspects and the fragmentation of content are vital for a better understanding of them—is palpable in the results obtained by two system variables to improve in the future.
The usability (size of the image, of the screen, menu navigation, etc.).
The need for a realistic map that improves the comprehension of the inter-face and the space instead of a symbolic map.
. The use of RV technologies and mobile devices for visiting and visualizing cultural spaces and their educational uses are highly satisfactory (better than in the case of students without ADHD, see Table 4).
Conclusions
As it has been described in our proposal, the main goal of the project consists of assessing the student’s mobile interaction (including students with ADHD), and
understanding of Historical World Heritage Casa Batllo´ Museum by using advanced visual technologies during the visit. In these types of buildings, it is possible to improve the final student’s experience by using mobile and wearable technologies that locate the user and adapt the contents to be viewed in every moment and position of the visit. The performance of the video-guide is based on the selection of a POIs number that the visitor is interested on, either because of its proximity or because the system indicates it.
In line with previous experiences (Fonseca et al., 2015, 2016), one of the first remarkable aspects of the experience has been the usefulness of the mixed method of data analysis used. It has demonstrated its usefulness as a dynamic system for capturing information related to student’s experiences with techno-logical elements in education. With our approach, we can expand the quantita-tive interpretation (especially with little samples), with the user’s emotional subjective responses (a resource very useful with users with disability). Our study has demonstrated how BLA, as a qualitative method, allows obtaining additional information related to the quantitative variables that would otherwise have not been achievable.
If we focus on the main objectives of this study, we can conclude that using visual technologies with an indoor positioning system improves the guided visit in interesting buildings as the one we have studied. This assertion is directly linked to the usability test, as much as to the BLA. On the one hand, as it is shown in Table 3, the e ectiveness, as much as the e ciency and the satisfaction of the proposed method are better than in a video-guide system without indoor positioning (control group), the di erence being significant in the case of the e ciency. On the other hand, and thanks to the BLA, we may confirm that the assessment of the proposal made from the teaching field is of great interest and has possible uses in the field of architectural visualization.
All of the students (PC-1, MI: 100%, Av: 8.42) have remarked the use of the virtual contents to visualize additional information on architectural projects as a positive aspect. This answer, linked to the skill of understanding the 3D space (PC-3, Av: 9.00, MI:57%), and its high interaction and usability (PC-2, Av:9.00, MI:57%), generates a method that can be extrapolated to other issues. The presentation, explanation, and understanding not only of the museum space but also of the architectural project, as well as other technical aims are possible using the method studied, as for example: the structural design, the building facilities, and the construction process.
Focusing on the comparative of the results between the students with ADHD and the others, the first conclusion is that it will be necessary to repeat or realize new studies in order to augment the sample and to obtain more to provide more credibility to the research findings. With regard to this problem, we can find pre-vious studies (de Winter, 2013), that show that it is possible to use the student’s t test with extremely small sample sizes (N < 5) but also we have demonstrated how using a qualitative approach can improve the comprehension of the results
with small samples. It is clear that the proposal of video-guide with localiza-tion improves the 3D space in the realized exercise. However, and in line with what is expressed by other students, it is necessary to redesign the interface and the navigation system for a better adaptation to the museum environment.
Because of the classical problems that we have resumed a ect students with ADHD, it is clear that any mobile system for 3D virtual contents needs realistic spaces for interaction. Considering previous recommendations and logical premises based on such cognitive studies as those of Gantt (1998), that assert that human beings have a small amount of retention capacity—from which 25% is heard, and 75% is seen and done—the capacity of interaction reinforces the memory process, that is one of main handicaps of these type of students.
The menu based on pictograms of the POIs is not clear enough and it slows down the visit. It is clear from the data obtained that the design of the interface is the most criticized aspect by students with certain di culties and that although they are not a sample that can be considered significant, they do not di er from the results of the rest of students of the architectural scope.
This confluence of results allows us to conclude, on the one hand, the good acceptance of the proposal and the significant improvement it provides in the spatial comprehension of complex areas (especially with students with ADHD), and on the other hand, the need to redesign the navigation method, a better adaptation to users with special needs. The use of virtual reality and augmented reality applications in an industrial sector reports higher levels of engagement (Terenzi & Basile, 2013), something that occurs similarly with the motivation of the students, and their academic performance (Fonseca et al., 2015). For these reasons, these type of proposals can help students with or without any disability to improve their education, logically given that the design takes into account specific needs for every type of user. Teachers teaching students visually (Jukes, McCain, & Crockett, 2010) is bound to happen in the digital generation and definitely a main key for teaching in the architectural field. Moreover, the vis-ual experience interacting with students’ own experience of places through frag-menting information and making associations—with new devices that accompany the students visit of places—helps to focus information, paces it, and reinforces comprehension for students with ADHD.
Acknowledgments
This project is a collaboration between Lab4Glass Company, in charge of the position and virtual visualization systems’ design and management, and La Salle Architecture School, Universitat Ramon Llull, in charge of the design of the assessment’s methods and that has contributed with its students to the assessment of the created environment. The authors also thank the Casa Batllo´Museum for its willingness and facilities to access the museum installations and make the visit.
Declaration of Conflicting Interests
The authors declared no potential conflicts of interest with respect to the research, authorship, and/or publication of this article.
Funding
The authors received no financial support for the research, authorship, and/or publication of this article.
Notes
1. An example of the multimedia content created is available at https://www.youtube. com/watch?v¼Gik4ky7lvLA.
2. For example of POIs detection, see https://www.youtube.com/watch?v¼PtFEyQ IOuUw.
References
Ab Aziz, N. A., Ab Aziz, K., Paul, A., Yusof, A. M., & Noor, N. S. M. (2012, February). Providing augmented reality based education for students with attention deficit hyper-active disorder via cloud computing: Its advantages. In Proceedings of the 14th International Conference on Advanced Communication Technology (pp. 577–581). Washington, DC: IEEE.
Alelis, G., Bobrowicz, A., & Ang, C. S. (2015). Comparison of engagement and emotional responses of older and younger adults interacting with 3D cultural heritage artefacts on personal devices. Behaviour & Information Technology, 34(11), 1064–1078.
Alokaily, R. (2015). Mobile learning BYOD implementation in an intensive English pro-gram. In M. Ally & B. H. Khan (Eds.), International handbook of e-learning: Implementation and case studies (Vol. 2, p. 311). New York, NY: Routledge.
Anthopoulos, L., & Fitsilis, P. (2010, July). From digital to ubiquitous cities: Defining a common architecture for urban development. Proceedings of the Sixth International Conference on Intelligent Environments (pp. 301–306). Washington, DC: IEEE.
Axel, E. S. (2003). Art beyond sight: A resource guide to art, creativity, and visual impair- ment. New York City, NY: American Foundation for the Blind.
Baddeley, A. (2000). The episodic buffer: A new component of working memory? Trends in Cognitive Sciences, 4(11), 417–423.
Ballagas, R., Rohs, M., Sheridan, J. G., & Borchers, J. (2004, September 7–10). BYOD: Bring your own device. In Proceedings of the Workshop on Ubiquitous Display Environments, Ubicomp (Vol. 2004), Nottingham, England.
Benito, G. (1993). Inaugurado el Museo Tiflolo´gico [The Tiflological Museum was inau-gurated]. Perfiles, 81, 35–37.
Bickmore, T., Pfeifer, L., & Schulman, D. (2011, September). Relational agents improve engagement and learning in science museum visitors. In H. H. Vilhja´lmsson, S. Kopp, S. Marsella, & K. R. Tho´risson (Eds.), Intelligent virtual agents (pp. 55–67). Berlin/ Heidelberg, Germany: Springer.
Boeykens, S., Santana-Quintero, M., & Neuckermans, H. (2008). Improving architectural design analysis using 3D modeling and visualization techniques. In M. Ioannides, A. Addison, A. Georgopoulos, & L. Kalisperis (Eds.), Digital Heritage: Proceedings of
![Table 1. Descriptive Statistics for Main Measures of Student Profile Test by Group (G1: Experimental [n ¼ 13], G1*: Students With ADHD [n ¼ 2], G2: Control Group [n ¼ 15], and G2*: Students With ADHD [n ¼ 2])](https://thumb-eu.123doks.com/thumbv2/123dok_br/15713517.1069488/16.892.180.698.568.837/descriptive-statistics-measures-student-profile-experimental-students-students.webp)