PRECISE INDOOR LOCALIZATION FOR MOBILE LASER SCANNER
R. Kaijaluoto∗, A. Kukko, J. Hyypp¨a
Finnish Geospatial Research Institute (FGI) - Center of Excellence in Laser Scanning Research, FI-02430 Masala, Finland ([email protected], [email protected], [email protected])
KEY WORDS:Mobile Laser Scanning, Indoor localization, Simultaneous Localization and Mapping, Point Cloud
ABSTRACT:
Accurate 3D data is of high importance for indoor modeling for various applications in construction, engineering and cultural heritage documentation. For the lack of GNSS signals hampers use of kinematic platforms indoors, TLS is currently the most accurate and precise method for collecting such a data. Due to its static single view point data collection, excessive time and data redundancy are needed for integrity and coverage of data. However, localization methods with affordable scanners are used for solving mobile platform pose problem. The aim of this study was to investigate what level of trajectory accuracies can be achieved with high quality sensors and freely available state of the art planar SLAM algorithms, and how well this trajectory translates to a point cloud collected with a secondary scanner.
In this study high precision laser scanners were used with a novel way to combine the strengths of two SLAM algorithms into functional method for precise localization. We collected five datasets using Slammer platform with two laser scanners, and processed them with altogether 20 different parameter sets. The results were validated against TLS reference. The results show increasing scan frequency improves the trajectory, reaching 20 mm RMSE levels for the best performing parameter sets. Further analysis of the 3D point cloud showed good agreement with TLS reference with 17 mm positional RMSE. With precision scanners the obtained point cloud allows for high level of detail data for indoor modeling with accuracies close to TLS at best with vastly improved data collection efficiency.
1 INTRODUCTION
Demand for digital 3D models of building indoors has been grow-ing as the cost of producgrow-ing one has been gettgrow-ing smaller. They can be used for variety of purposes from creating virtual worlds to monitoring building condition. In building monitoring period-ically taken 3D measurements can be used to asses the structural integrity of a building by for example measuring of supporting beams or walls have bulged or moved. 3D model of a building can also help with planning renovations and can also be used for assessing the result. Virtual models of important cultural and his-torical sites can be used as marketing for the lesser known ones and for the popular ones it can serve as a way to visit it alone as crowds of tourists can greatly affect the atmosphere. While virtual visit to a site is not the same as an actual visit, having the option enables people from all over the world without the re-sources or time for actual visit to have the experience. Some sites can also be too delicate for actual visits by tourists so a virtual model can be the only way to provide access for wider public.
To create point clouds and models of building interiors, terres-tial laser scanners (TLS) are commonly employed. While this provides good quality point clouds, data collection requires plan-ning and is time consuming. This is especially true in cluttered spaces with low visibility where the amount of reference targets and scanning locations required for a occlusion free point cloud can quickly grow to a large number yielding also to an excessive data redundancy.
With Mobile Laser Scanner (MLS) continuously taking measure-ments, large area can be covered quickly and occlusions are much less of a problem (Kukko, 2013). To achieve this, the trajec-tory of the MLS platform must be known with high precision. Outdoors, the combination of inertial measurement unit (IMU) and global navigation satellite system (GNSS) can provide good estimate (Kaartinen et al., 2012) but indoors in the absence of GNSS signals other methods must be employed. While there are some interesting experimental localization results (Lehtola et al., 2015), horizontally mounted laser scanners are widely used for
localization and mapping purposes indoors. Scanners typically provide with accurate spatial information about the world with little noise and when combined to a Simultaneous Localization and Mapping (SLAM) algorithms they can provide trajectory of a platform in unknown environment (Thrun et al., 2005, p.153, p.309).
SLAM problem is difficult because there is a circular dependency between a need for a map for localization and a desire to know location for building the map. Fortunately this problem can be solved by iteratively localizing the pose relative to the starting pose and by using this information to construct the map (Thrun et al., 2005, p. 309). A SLAM algorithm can be divided to a fron-tend and a backend. The fronfron-tend deals with sensory input doing scan matching and calculating spatial relations between subse-quent scans. The backend works with collected information and trying to optimize poses to keep the resulting trajectory coherent in relation to reality (Konolige et al., 2010). In practise a SLAM frontend is enough to solve the SLAM problem, but as the small errors in the scan matching will inevitably accumulate reducing accuracy, in complex environments with longer trajectories and many loop closures (returning to an area visited before) a back-end can greatly improve the result.
Aim of this research is to investigate what level of trajectory ac-curacies can be achieved with high quality sensors and freely available state of the art planar SLAM algorithms, and how well this trajectory translates to point cloud collected with a secondary scanner.
2 METHODS
Figure 1: SLAMmer platform consists of IMU (NovAtel UIMU LCI), horizontally mounted scannes for SLAM (FARO Focus 3D120S), and secondary scanner for 3D point cloud genera-tion (FARO Focus 3DX330). The scanners are interchangeable. Tablet computer is used for IMU and timing data recording.
In the setting the 120S laser scanner is mounted horizontally for measuring the platform movement, while the X330 in front of the system is tilted 10 degrees for producing 3D point cloud of the scene (Figure 5) (angle is adjustable at 10 degree steps for optimizing the configuration).
For data processing Robotic Operating System (ROS) framework is used (ROS, 2014). It contains among other things, numerous open source libraries for solving SLAM and localization prob-lems and tools for accompanying data processing. As all of the algorithms can be used within the common framework it provides a straightforward way for trying, comparing and combining dif-ferent algorithms.
As an original approach we combine two SLAM algorithms with different strengths, Karto Open library (SRI International, 2014) and Hector SLAM (Kohlbrecher et al., 2011). Hector SLAM algorithm utilizes the full scan rate of modern high frequency laser scanners, by using every subsequent scan the search space for rigid-body transformation between scans stays small and the transformation can be found in real time. The correct transforma-tion is found by optimizing the alignment of scan endpoints with the map learned so far with Gauss-Newton method (Kohlbrecher et al., 2011).
Hill climbing optimization methods, are prone to getting stuck at local optima so to ensure convergence to global minimum, the algorithm maintains a pyramid of multiple occupancy grids with each having half the resolution of the preceding one. Scan match-ing is started with the coarsest resolution occupancy grid and then repeated on finer grids using the result of scan matching done at the previous resolution as the starting guess. To reach precision greater than available from discrete sized grid cells bilinear fil-tering is employed. Even though the high quality scan matcher gives the algorithm good accuracy, during closing a loop the lack of optimizing backend shows up as a discrete jump in the trajec-tory when the pose recovers.
Karto (SRI International, 2014) uses correlative scan matching algorithm by (Olson, 2009) in its frontend and Sparse Pose Ad-justment (SPA) (Konolige et al., 2010) as its backend.
The scan matcher requires an estimate of movement as its first guess (from example odometer, in our case from Hector SLAM) and then performs a search around it at discrete steps over a search window. To narrow down the search over large 3D space (x, y, θ) of possible transformations the area is first evaluated at a coarser scale to find areas of interest for a finer search. Many transformation candidates around the correct one are evaluated and provide the algorithm with reliable estimate for the covari-ance of the found transformation (Olson, 2009), this value is im-portant for the backend as a weight for the constraint created from the scan match. The downside of discrete steps is the limit on ac-curacy they give. This is especially noticeable if every scan from the scanner is input to the algorithm, the displacement between scans can be less than the search resolution which causes the lo-calization to become unreliable. As we are processing the data offline the resolution of the search grid could be set to a value small enough, in theory this should only result in a longer pro-cessing time but unfortunately the algorithm became unstable at around 2 mm resolution, which still causes jitter to the trajectory.
The SPA based backend of the Karto uses a pose graph struc-ture where scanner poses form the nodes and the edges between them are the scan matching results from the frontend. When re-turning to an explored area and closing a loop, the current scan is matched with a chain of previously processed ones and if the match is sufficiently good, an additional constraint between those poses is created. During optimization the poses are moved around to minimize the error caused by the constraints and this reduces the errors accumulated before the loop closure. The Karto with its SPA backend has been shown to give excellent results when compared to other algorithms (Vincent et al., 2010).
The Karto library is mainly aimed for mobile robots and online use, but as we do the processing offline with all of the data avail-able some changes can be made. In addition to using parameters which provide higher accuracy and processing load too great for online computation, a modification to the loop closing function was made. In its original form a loop is closed immediately when a match between current scan and a chain of nearby processed scans gives a response value greater than a predetermined thresh-old. In the studied approach matching is tried between the chain of old, processed scans and all of the ”current” scans which are located close enough to be possible loop closure candidates. Af-ter trying matching all of them, the one with the highest response value is selected and used for closing the loop. This is advanta-geous as a better match leads to less error and the match generally gets better as the scanning locations get closer together. In orig-inal form, if the threshold is small a suboptimal loop closure is made when the current location is still far away from the chain of scans but if the threshold is too high, some not as good but still useful loop closures might be missed altogether. With our ap-proach more loop closures can be made while ensuring that they are as good as possible.
The movement of the platform and scanner mounted on it causes distortion to the resulting scans, which adds error to scan match-ing. If this movement is known, it can be compensated by trans-forming each measurement of the scan according to the scanner pose at the time of measurement. The IMU deployed is of suffi-cient quality so the IMU measurements could be used for estimat-ing this movement but to keep the estimates from driftestimat-ing away, fusion of the IMU and SLAM estimates with help of for example extended Kalman filter would be required.
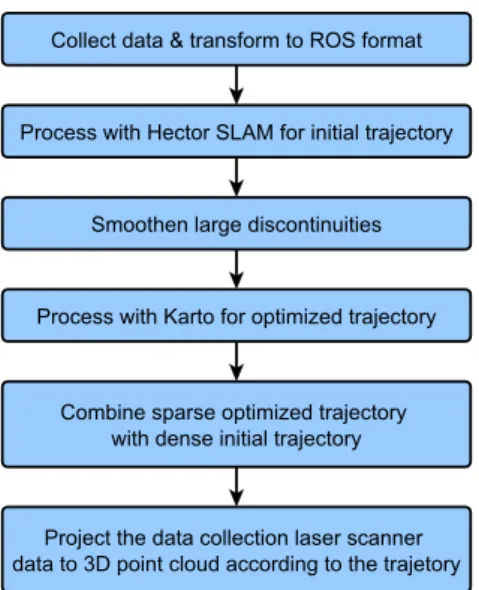
Figure 2: Pipeline from data collection to finalized point cloud.
orientation estimates based on them. Even though the absolute heading (rotation around z-axis) value based on the IMU mea-surements drifts away from the truth, it can be used for estimat-ing relative rotation over short periods of time accurately. Hec-tor SLAM algorithm was augmented with this feature. Currently only the scanner start and end poses within a scan are used while the intermediate poses corresponding to each single scan point measurement are interpolated. Unfortunately Karto algorithm makes assumptions of undistorted scan when doing scan match-ing, which makes implementing this kind of movement compen-sation more difficult, and it is a task of future experimenting to be fully exploited.
In our approach we use the Karto library as an ad-hoc backend for the Hector SLAM by using the trajectory from Hector as the initial guess for Karto. This overcomes the problems caused by the lack of backend in Hector while enabling us to use its high quality scan matcher.
The proposed pipeline can be seen in Figure 2. First the data is transformed to ROS applicable format and then input to Hec-tor SLAM for calculating the initial trajecHec-tory. Before its use in Karto, the large discontinuities caused by loop closures in the Hector trajectory are smoothed away. This is accomplished by checking each transformation between two poses and comparing it to the preceding ones, if there is large change in transformation length or direction from the preceding ones, the transformation is replaced by an average of the preceding transformations.
The smoothed trajectory is then input to Karto and processed. By setting the Karto parameter which penalizes transformations differing from initial guess to a sufficiently large value it can be made to largely follow the initial trajectory. To speed up the pro-cessing only a subset of the scans are processed by Karto, in our case three per second. The sparse and optimized trajectory is then combined with the dense Hector trajectory. This is accom-plished by performing an affine transformation to each subtrajec-tory between two optimized poses which align the subtrajecsubtrajec-tory endpoints with the optimized trajectory. Headings of the poses between optimized endpoints are interpolated.
Finally the complete trajectory is used to transform the scans made by the tilted laser scanner to form 3D point cloud of the whole area.
(a) (b)
Figure 3: Errors of test run X2 as time series. (a) trajectory from Hector SLAM before processing with Karto, (b) the result of the enhancement with Karto. Top row is the position error and bot-tom row is for the rotational error. Without optimizing backend errors can grow unboundedly.
3 EXPERIMENTS
To test our approach we made 5 test runs in the FGI office, which has both long narrow corridors and cluttered spaces with short visibility. The test runs took different routes, details of them are in Table 1. All tests were made with same IMU logging settings, acceleration and angular velocity measurements were logged at 200 Hz and attitude calculated by SPAN at 20 Hz. Horizontal laser scanner maximum range was set to 41 meters which is close to the the length of the longest corridor and enables the scanner to detect everything in its field of view.
Data acquisition settings and trajectory length Test Rot. Rate Ang. Res. p/scan Length Speed
Hz mrad m m/s
X1 59.7 0.767 6828 256.9 0.27
X2 59.7 0.767 6828 265.6 0.25
S1 47.7 0.613 8536 268.5 0.52
S2 47.7 0.613 8536 312.1 0.52
S3 47.7 0.613 8536 232.6 0.49
Table 1: Test runs starting with X were made with X330 scan-ner as the horizontal scanscan-ner and ones starting with S with 120S. Length is the length of the trajectory and speed is the average movement speed.
Faro X330 laser scanner was used in TLS mode to generate a point cloud of the study area for geometric reference. Altogether 31 TLS scans were taken, which were then registered together into a single point cloud by using Faro Scene software and target spheres 199 mm and 145 mm in diameter placed around the area.
For extracting reference trajectories for the test runs, a 50 mm thick slice around the elevation of the horizontal laser scanner from the floor level (about 50 cm) was extracted from the refer-ence point cloud and the scans collected during each of the test runs were matched to it with the Hector SLAM algorithm. The use of Hector SLAM instead of using Monte Carlo Localization or just matching the scans to the reference map is advantageous as there are places (under desks etc.), which were occluded and not seen in the TLS based reference map and the slam algorithm can generate a map for those locations and use it for localization. The parameters of the Hector SLAM were set to only update the underlying map with very low probability so the original geom-etry of the TLS based reference map was preserved and used for matching when available.
Position error Heading error
Test RMSE SD Max RMSE SD Max
mm mm mm deg deg deg
X1h 48.7 22.5 124.1 0.11 0.06 1.04
X1a 42.7 30.5 117.7 0.16 0.11 2.04
X1b 16.4 7.3 40.38 0.13 0.10 1.86
X1d 37.3 22.2 97.6 0.19 0.12 2.00
X2h 71.7 47.9 213.3 0.18 0.09 0.69
X2a 20.8 14.3 68.7 0.16 0.12 2.00
X2b 28.7 20.9 83.4 0.16 0.12 2.02
X2d 19.4 10.1 58.8 0.16 0.12 2.07
S1h 192.9 130.0 520,7 0.56 0.28 7.9
S1a 104.8 70.4 280.2 0.35 0.20 1.78
S1b 283.5 143.4 582.5 1.37 0.72 3.05
S1c 148.8 87.3 376.3 0.53 0.33 2.47
S1d 75.1 45.8 204.1 0.35 0.22 1.80
S2h 128.9 62.1 282.5 0.45 0.26 6.06
S2a 33.6 14.3 205.8 0.32 0.22 3.45
S2b 35.6 11.2 233.4 0.29 0.21 3.59
S2c 33.5 21.5 202.9 0.32 0.22 3.54
S2d 87.1 50.7 177.0 0.37 0.24 3.40
S3h 230.6 157.4 593.0 0.51 0.24 7.76
S3a 72.8 60.7 258.0 0.33 0.23 1.74
S3b 73.3 56.4 239.1 0.33 0.21 1.75
S3c 58.5 29.5 142.4 0.29 0.20 1.82
S3d 81.7 45.9 202.3 0.31 0.20 1.87
Table 2: Trajectory errors for the test runs. h = initial trajectory from Hector SLAM, others are processed by Karto. Letters a to d represent different Karto parameter sets. a,b = 5 mm matching resolution. c,d = 2.5 mm matching resolution. a,c have smaller penalty multiplier for matches differing from initial guess while b,d have larger one.
matches the slice of the reference point cloud. A trajectory mod-ifier tool, which enables easy inspection and modification if nec-essary, was created and used for this task. This inspection was necessary as the matching by Hector SLAM occasionally fails and the trajectory can deviate more than 50 mm from the cor-rect one. With the scans distorted by movement, precise manual correction was extremely difficult and some small (under 10mm) errors remain in the reference trajectories.
Results of processing with SLAM algorithms can be seen in Ta-ble 2 and an example trajectory can be seen in Figure 4. While each test run was different, the main difference was the order in which the different corridors of the library (left hand side of the trajectory) were visited. The error metrics and figures were cal-culated with the help of Rawseeds metrics computation toolkit (Andrea Bonarini and Tardos, 2006). The trajectories were tied to the reference ones and through them to the TLS point cloud only by setting the starting pose to the reference starting pose. While this is not optimal, as the poses in the pose graph of Karto are all anchored to the static starting pose this proved not to cause any problems.
The computed trajectories were combined with the data scanner for generating 3D point clouds of the FGI study area. The point cloud data was scanned with 30 Hz scan frequency and 244,000 points a second, maximum range was set to 6.0 m. The point clouds were validated for geometric accuracy against the TLS ref-erence point cloud also used for the SLAM trajectory evaluation. An example of a point cloud data collected in Test 2 is illustrated in Figure 5. The point cloud in Test 1 includes 31 million points, while the Test 2 cloud has about 40 million points in total.
(a) (b)
0.1 0.2 0.3 0.4 0.5 0.6 0.7 0.8 0.9 1
-16.9 -16.8 -16.7 -16.6 -16.5 -16.4 -16.3 -16.2
x [m]
y
[m
]
(c)
0.1 0.2 0.3 0.4 0.5 0.6 0.7 0.8 0.9 1
-16.9 -16.8 -16.7 -16.6 -16.5 -16.4 -16.3 -16.2
x [m]
y
[
m
]
. (d)
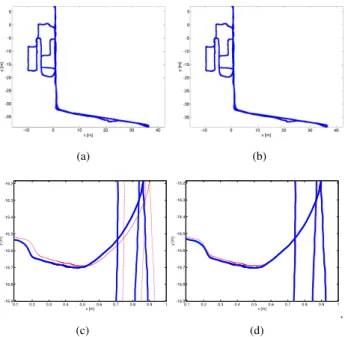
Figure 4: Trajectories of test run X2, start and end in the top-most part, red represents reference. (c) and (d) are detail from the whole trajectory. (a), (c) are initial trajectories from Hector SLAM. (b), (d) are from Karto. Detection of loop closures by Karto’s backend keeps the position from drifting far away.
Figure 5: 3D point cloud collected with the Slammer system from test X2d. The precision and accuracy of the data regardless of the complex scene is well represented. Point coloring is based on the laser intensity and data file number to illustrate the progress of the data acquisition.
The geometric error of the point clouds were analyzed on eight pylons in the study area. Two of them are visible on bottom right in Figure 5. The center of the pylon was measured from the TLS and Slammer point cloud interactively. The resulting errors are seen in Table 3. The maximum errors for both cases were found from the lower corridor. The error grows steadily starting from the bend.
Test X1b Test X2d
n 18 19
m m
Mean 0.021 0.014
SD 0.018 0.010
RMSE 0.026 0.017
Minimum 0.004 0.004
Maximum 0.083 0.036
Table 3: Planar errors in the point cloud. n is the number of locations compared.
Figure 6: Details of the building wall, doors and interior features captured by Slammer. Points are colored by laser intensity.
4 DISCUSSION
The majority of the trajectory error for each test run was caused by a slight error in the estimated orientation when visiting the over 40 m long lower corridor of the building. This can be seen as the large rise in error in Figure 3, while the magnitude of error differs, all test runs showed similar tendency. The corridor is quite feature poor and as such difficult for scan matching and as extra challenge the lobby which connects the two corridors contains glass and metal surfaces on multiple sides.
Most noticeable thing about the results is the difference in po-sition accuracy between the test runs with different laser scan-ners. While the X330 is upgraded version of 120S and should provide better performance, the more likely culprit is the almost halved movement speed of the X1 and X2 trajectories. Slower movement speed and higher scanner rotation rate lead to less of distortion to the scans which helps scan matching.
Another source of error is the combining of the dense initial tra-jectory to the optimized sparse one. Currently when a subtrajec-tory between two optimized poses is transformed to fit between the endpoints, it is scaled same amount in both X and Y direc-tions. When the scanner is almost stationary, this scaling can magnify the small random jitter in the localization to centimetre range. This effect could be reduced by scaling only along the line between the endpoints. As an example, the maximum error spike in Figure 3(b) is caused by this.
Out of the test runs taken with 120S, S2 stands out with its lower errors. The S2 test run was the longest and also the most con-voluted with the trajectory crossing itself numerous times. These provide the Karto algorithm with many chances to perform loop closures which is its main strength, each loop closure ties the tra-jectory together and helps reduce accumulated error. As an oppo-site example in the S1b test the cost the backend tries to minimize somehow became NaN and as a result, no pose optimization was performed. Without the backend Karto library provides no ad-vantages over Hector SLAM.
As can be seen in the Table 2 no parameter combination which would have provided best results for each test was found. In total
the Karto library has tens of different parameters which interact with each other so finding the optimal combination is quite dif-ficult. To ensure robust results, movement should be stable and the path should be planned in a way which leads to many loop closures.
5 CONCLUSIONS
In this study we investigated use and effect of high-end laser scan-ners on providing localization data for SLAM algorithms. The proposed method combines two SLAM algorithms for comput-ing accurate trajectory for 3D point cloud generation. The trajec-tory estimation was first carried out using frontend Hector SLAM with a high quality scan matcher for providing initial odometry for Karto algorithm. Karto has a backend for detecting loop clo-sures and is used to optimize poses drifting due to cumulating error of the scan matching.
We collected five different trajectories, and processed them using different parameter sets. The resulting trajectories were evaluated against TLS reference. The results show, that the scanner version used for SLAM might have a role in in the performance of the algorithm, but most probably is a feat of increased scan frequency and slower data acquisition. The analysis of the 3D point cloud generated from the secondary scanner data based on the resulting SLAM trajectories show good agreement with the TLS reference. The point cloud generated using the best accuracy trajectory show 17 mm RMSE and 36 mm maximum error for horizontal position. The dimensions of the building show 0.1-0.5% error.
While the point cloud quality achievable by TLS scanning might not be reached just yet, the centimetre range localization accu-racy provided by the proposed combination approach is enough to produce coherent and visually pleasing point clouds with vastly faster data collection. With the modular sensor suite of Slammer adding synchronous RGB or infrared cameras to the platform is also possible.
These results are also only preliminary and can expected to be im-proved by further modifying the SLAM algorithm, by integrating the IMU measurements more robustly and by improving the data collection practises. Mounting a second, cheaper laser scanner horizontally should also be tried to make comparison to see how much of the good performance is caused by the expensive laser scanner and how much by the SLAM algorithms.
REFERENCES
Andrea Bonarini, Wolfram Burgard, G. F. M. M. D. G. S. and Tar-dos, J. D., 2006. Rawseeds: Robotics advancement through web-publishing of sensorial and elaborated extensive data sets. In: In proceedings of IROS’06 Workshop on Benchmarks in Robotics Research.
Kaartinen, H., Hyypp¨a, J., Kukko, A., Jaakkola, A. and Hyypp¨a, H., 2012. Benchmarking the performance of mobile laser scan-ning systems using a permanent test field. Sensors 12(9), pp. 12814–12835.
Kohlbrecher, S., Meyer, J., von Stryk, O. and Klingauf, U., 2011. A flexible and scalable slam system with full 3d motion estima-tion. In: Proc. IEEE International Symposium on Safety, Security and Rescue Robotics (SSRR), IEEE.
Kukko, A., 2013. Mobile Laser Scanning–System development, performance and applications. PhD thesis.
Lehtola, V. V., Virtanen, J.-P., Kukko, A., Kaartinen, H. and Hyypp¨a, H., 2015. Localization of mobile laser scanner using classical mechanics. ISPRS Journal of Photogrammetry and Re-mote Sensing 99, pp. 25–29.
Olson, E. B., 2009. Real-time correlative scan matching. In: Robotics and Automation, 2009. ICRA’09. IEEE International Conference on, IEEE, pp. 4387–4393.
ROS, 2014. Robotic Operating System.http://www.ros.org. Accessed 2.11.2014.
SRI International, 2014. Karto.http://www.kartorobotics. com/. Accessed 2.11.2014.
Thrun, S., Burgard, W. and Fox, D., 2005. Probabilistic Robotics (Intelligent Robotics and Autonomous Agents). The MIT Press.