Deep macrobenthic communities from Nazaré submarine canyon (NW Portugal)
10
0
0
Texto
(2) been undertaken in this area. In fact, there is rather sparse information available on macrofaunal communities in submarine canyons of the NE Atlantic continental margins. Data are restricted to Capbreton Canyon (e.g. Rallo et al., 1993), Setúbal Canyon (Gage et al., 1995; Lamont et al., 1995) and Cap-Ferret Canyon (Sorbe, 1999), whereas for Pacific and NW Atlantic much more data are obtainable (Sorbe, 1999). Submarine canyons are examples of unstable environments (Thorne-Miller and Catena, 1991) related to morphology change caused by strong turbidity currents (Shepard et al., 1974). Therefore, special strategies may be necessary for animals to survive in such conditions. Canyon species have been shown to have a greater mobility than those of typical deep-sea assemblages (Rowe, 1971). Suspensivores may benefit from the strong currents (Rowe, 1971; Shepard et al., 1974), while the high sedimentation rates in “inactive” canyons (Sorbe, 1999) and accumulation of macrophyte detritus may increase the amount of food for detritivores (Vetter, 1995; Okey, 1997). The distinct faunal assemblages, and the higher faunal and/or biomass densities, when compared to similar depths in non-canyon areas (Gage, 1997), might reflect the instability and high levels of organic material usually associated with submarine canyons. Submarine canyons may occur along almost all oceanic margins, and may be important conduits of sediment and coastal detritus to the. abyssal plains (Vetter and Dayton, 1998). Generally, the number of species in these areas is reduced when compared to the high diversity normally found in physically more stable areas (ThorneMiller and Catena, 1991). The present work aims to characterise the macrobenthic communities from Nazaré Submarine Canyon in order to assess the potential effects of natural organic enrichment.. MATERIAL AND METHODS The sampling was performed during a cruise of the Ocean Margin Exchange (OMEX II) programme, carried out from the 27th December of 1998 to the 15th January of 1999. The sampling area is located in the Nazaré Submarine Canyon on the western Iberian Margin (Fig. 1). One transect along the lowest part of its middle course (station BC 26, 2894 m) and the upper part of the lowest one (stations BC 25 and BC 27, 3514 and 4141 m respectively) was performed. Information regarding sampling sites, such as depth, positional coordinates and sampled areas, is presented in Table 1. Samples were taken using a USNEL box corer that samples a 50 x 50 cm area of seabed (0.25 m2) and goes up to 50 cm deep into the sediment, although in practice, it rarely penetrates more than 30 cm. Due to bad weather conditions very few samples were taken and as the samples used for the present work were obtained during a multi-disciplinary pro-. FIG. 1. – Location of the sampling stations in the Nazaré Submarine Canyon.. 172 J. CÚRDIA et al..
(3) gramme, the samples were distributed among cruise members. Consequently, three different depths were sampled without replicates, with small but comparable sampling areas ranging from 0.110 to 0.125 m2 (Table 1). Only the upper 15 cm of sediment were sampled, in five sediment layers, 0-1, 1-3, 3-5, 5-10 and 10-15 cm. Each layer was washed carefully through a 0.5 mm mesh screen, but the water overlying the sediment surface, which may include some fauna such as peracarid crustaceans, was not screened. The sieved material was fixed immediately in borax-buffered seawater 4% formalin and left in this preservative until sorting. In the present work, “macrofauna” includes all the organisms retained by a 0.5 mm mesh sieve, excluding “meiofaunal” taxa (i.e. Nematoda, Copepoda and Ostracoda). The designation “other taxa” includes faunal groups that account for a small fraction of total macrofauna, namely Echinodermata, Nemertea, Sipunculida, Chordata and incertae sedis. Prior to sorting, a solution of rose Bengal was added to the samples in order to facilitate the separation of the organisms from the sediment and detritus. The samples were sorted in the laboratory using a low power microscope. The sorted fauna was identified to the level of putative species. Species diversity was estimated using rarefaction, the expected number of species in a sample of 100 individuals E(S100), and the Shannon index H’ (log base 2). The rarefaction method was developed by Sanders (1968) in order to calculate the number of species expected [E(Sn)] in each sample if all samples were of a standard size (n individuals). This method is based on the distribution of individuals among species for the total sample. It is the diversity measure most frequently applied in deep-sea ecology (Rex et al., 2000). In the present work E(Sn) is calculated using the Equation modified by Hulbert (1971) to provide unbiased estimates: N − Ni n E( Sn ) = ∑ 1 − , for n ≤ N N i =1 n S. where S is the total number of species, N the total number of individuals of the sample, Ni the number of individuals of the ith species of the sample and n the number of individuals in the hypothetical sample for which the number of species is estimated.. The Shannon index (H’), described by Shannon and Weaver (1963), is probably the most commonly used diversity measure in ecological studies. It uses the proportion of each species abundance for the total abundance to compute a diversity measure H’ using the Equation: S. H ′ = − ∑ pi log 2 pi i =1. where pi is the proportion of individuals of the ith species given by ni/N, where ni represents the number of individuals of the ith species, N the total sample abundance and S the total number of species in the sample. The log can be of any base, in the present work log2 was used. Shannon J’ (Pielou, 1969) estimates evenness (or equitability), a measure of how equally abundant the species are. In the present work this index is calculated using the Equation: J′ =. H′ log 2 S. where H’ is the Shannon index (explained before) and S the total number of species in the sample. Again, the log can be of any base, but it must be coincident with the log used for the calculation of H’, thus log2 was used. Dominance was measured by Simpson’s D index (Lambshead et al., 1983). This index is calculated by the Equation: S n n −1 ( ) D = ∑ i i i =1 N ( N − 1) . where S is the total number of species, ni the number of individuals of the ith species and N the total number of individuals in the sample. TABLE 1. – Sampling stations’ information from the Nazaré Submarine Canyon and total abundance, number of species, Shannon H’ and J’ (log 2), Simpson’s D (log 2) and Hulbert’s Expected number of Species for a sample of 100 individuals (E(S100)). Station Sampling date Latitude Longitude Depth (m) Sampled area (m2) Abundance Number of species Shannon H´ Shannon J´ E(S100) Simpson D. BC 26. BC 25. BC27. 11-Jan-99 39°29.04’N 9°45.05’W 2894 0.125 9273 42 0.467 0.087 4.46 0.898. 10-Jan-99 39°29.70’N 9°55.50’W 3514 0.110 595 40 3.406 0.640 20.53 0.184. 12-Jan-99 39°33.97’N 10°09.92’W 4141 0.125 408 42 3.037 0.563 22.03 0.315. MACROBENTHIC COMMUNITIES FROM NAZARÉ SUBMARINE CANYON 173.
(4) FIG. 2. – Relative abundance as percentage of total numbers (A) and number of species (B) for each faunal group concerning a 0-15 cm sediment layer at the different stations.. As the Polychaeta was the most abundant taxon, the analysis of the community feeding types is restricted to this faunal group in the present paper. Because there are no data available for deep-sea European polychaete species the feeding guilds were determined after Fauchald and Jumars (1979). Community structure analysis was undertaken using ©BioDiversity Pro and ©Primer software packages.. RESULTS The present survey allowed the identification of 10,276 individuals distributed among 90 species. As shown in Figure 2, the Class Polychaeta is the dominant faunal group of this area with 49 species (54.4% of total number of species) and 9,528 individuals (92.7% of total macrofauna abundance). Despite Polychaeta’s clear dominance especially at stations BC 26 and BC 27, at station BC 25 the phylum Mollusca is also well represented, although only few species are responsible for this, namely Scaphopoda sp. A and Prochaetoderma sp., both accounting for 69.4% of molluscs’ abundance at this site. However, according to the analysis of the faunal groups distribution in the different sediment layers (Fig. 3), particularly for relative abundance (graph A), it is observable that for station BC 25 the co-dominance of polychaetes and molluscs is only evident in the upper 0-1 cm sediment layer. The ratio 174 J. CÚRDIA et al.. of Polychaeta to Mollusca increases with increasing sediment depth. On the other hand, the presence of a high number of Thyasiridae bivalves are evident at the first sediment layer at BC 26, a value even higher than the one for polychaetes. Values of total abundance and number of species are plotted against sediment depth in Figure 4. The two deeper stations present decreasing abundances with sediment depth. In the first centimetre of sediment, we observe the highest value of relative abundance (51.8% for BC 25 and 35.8% for BC 27). If we pool the values from the two first layers, we can see that at BC 27 69.9% of total macrofauna is concentrated in the upper 3 cm of sediment, while for BC 25 this is 79.7%. However, the opposite pattern was observed for the shallowest station, both for number of species and abundance, showing higher values in the deeper sediment layers. At this station, only 12.3% of total macrofauna was sampled in the 0-3 cm sediment layer. BC 26 presents an extremely high number of individuals (9,273), due to the abundance of a single species, the polychaete Cossura sp. A, with 8,782 individuals (94.7% total abundance) at this station (Table 2). This observation also agrees with the results obtained for diversity, dominance and equitability indices applied, and for E(S100), which values are given in Table 1. In fact, Simpson’s D value is significantly higher at this station, reaching more than two times the second higher value (BC 27) and, as expected, diversity is extremely low, as well as.
(5) FIG. 3. – Relative abundance (A) and number of species (B) of each faunal group in the 0-1, 1-3, 3-5, 5-10 and 10-15 cm sediment layers at the different stations.. FIG. 4. – Total abundance (A) and number of species (B) plotted against sediment depth for the three sampling stations.. MACROBENTHIC COMMUNITIES FROM NAZARÉ SUBMARINE CANYON 175.
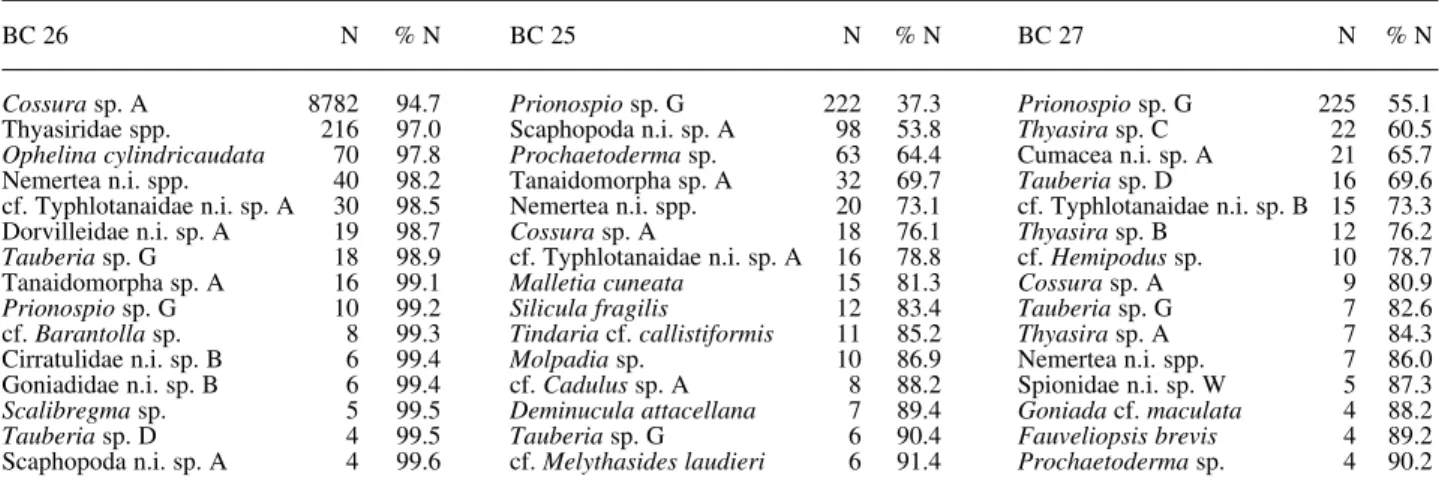
(6) TABLE 2. – Fifteen most abundant species at each station (BC 26, BC 25 and BC 27). The abundance (N, individuals) and the cumulative percentage for the station total abundance (% N) of each species are presented. n.i., not identified. BC 26. N. %N. BC 25. N. %N. BC 27. Cossura sp. A 8782 Thyasiridae spp. 216 Ophelina cylindricaudata 70 Nemertea n.i. spp. 40 cf. Typhlotanaidae n.i. sp. A 30 Dorvilleidae n.i. sp. A 19 Tauberia sp. G 18 Tanaidomorpha sp. A 16 Prionospio sp. G 10 cf. Barantolla sp. 8 Cirratulidae n.i. sp. B 6 Goniadidae n.i. sp. B 6 Scalibregma sp. 5 Tauberia sp. D 4 Scaphopoda n.i. sp. A 4. 94.7 97.0 97.8 98.2 98.5 98.7 98.9 99.1 99.2 99.3 99.4 99.4 99.5 99.5 99.6. Prionospio sp. G 222 Scaphopoda n.i. sp. A 98 Prochaetoderma sp. 63 Tanaidomorpha sp. A 32 Nemertea n.i. spp. 20 Cossura sp. A 18 cf. Typhlotanaidae n.i. sp. A 16 Malletia cuneata 15 Silicula fragilis 12 Tindaria cf. callistiformis 11 Molpadia sp. 10 cf. Cadulus sp. A 8 Deminucula attacellana 7 Tauberia sp. G 6 cf. Melythasides laudieri 6. 37.3 53.8 64.4 69.7 73.1 76.1 78.8 81.3 83.4 85.2 86.9 88.2 89.4 90.4 91.4. Prionospio sp. G Thyasira sp. C Cumacea n.i. sp. A Tauberia sp. D cf. Typhlotanaidae n.i. sp. B Thyasira sp. B cf. Hemipodus sp. Cossura sp. A Tauberia sp. G Thyasira sp. A Nemertea n.i. spp. Spionidae n.i. sp. W Goniada cf. maculata Fauveliopsis brevis Prochaetoderma sp.. FIG. 5. – Hulbert’s rarefaction curves for the three sampling stations.. N. %N. 225 22 21 16 15 12 10 9 7 7 7 5 4 4 4. 55.1 60.5 65.7 69.6 73.3 76.2 78.7 80.9 82.6 84.3 86.0 87.3 88.2 89.2 90.2. the Hulbert’s expected number of species for a sample of 100 individuals (E(S100)). Figure 5 presents Hulbert rarefaction curves for the three sampling stations. The station BC 26 is clearly different from the other ones, corroborating the results previously presented. The extremely low evenness value (Shannon J’) reflects diversity and dominance measures obtained for this station. With regard to polychaete feeding strategies, the sediments from station BC 26 are colonised mainly by subsurface deposit feeders (SSDF; identified as burrowing in Fig. 6) mostly from the families Cossuridae, Ophelidae and Capitellidae, which always account for more than 80% of the total layer abun-. FIG. 6. – Relative abundance as the percentage of total numbers of each Polychaeta feeding guild for all sediment layers analysed. (C/S) Carnivores/Surface deposit feeders; (H/S) Herbivores/Surface deposit feeders.. 176 J. CÚRDIA et al..
(7) FIG. 7. – Cluster (Unweighted Pair Group Average) and Multidimensional Scaling diagram performed using Bray-Curtis similarities for untransformed species abundances. The numbers in data labels refer to the sediment layers (0-1; 1-3; 3-5; 5-10 and 10-15 cm).. dance. Thus, at this station the remaining feeding guilds are vestigial. At BC 25 there is a perceptible increase of SSDF’s relative abundance and a decrease of the relative abundance of surface deposit feeders (SDF) with sediment depth increase. However, this latter feeding guild clearly dominates this station’s abundance in all sediment layers. Only one suspensivore was found in the present study at BC 25’s 0-1 cm sediment layer (the owenid Myriochele sp.). At BC 27, SDF dominate in the superficial 5 cm of sediment, but in the deeper sediment layers they contribute for less than half of the abundance (Fig. 6). The proportion of animals classified as herbivore or deposit feeders (H/S) increases in the deeper sediment layers (515 cm), as a result of the abundance of two species from genus Tauberia (Paraonidae). Figure 7 presents cluster and multidimensional scaling (MDS) diagrams for the different layers of the three stations. These analyses emphasise all the results presented, opposing station BC 26 to the other ones (BC 25 and BC 27), which appear very similar to each other. In fact, BC 25 and BC 27 form a unique cluster composed by three subgroups, one with the superficial sediment layers (01 and 1-3 cm), another with the intermediate layers (3-5 and 5-10 cm) and the last one with the deeper layer. The MDS diagram (Fig. 7B) confirms the vertical gradient across sediment depth, from superficial to deeper layers, suggested by cluster analysis for all sites sampled.. DISCUSSION The importance of sampling size in diversity and abundance patterns is well known (eg. Magurran, 1988). In the present work, the sampling size may be a serious handicap, therefore results must be interpreted carefully. However, there are some indications that the data presented is representative. Unpublished data regarding samples from the margin off Vigo (NE Iberia) when compared to samples of higher sampling size from the Goban Spur [NE Atlantic (Flach and de Bruin, 1999)] provided similar interpretations regarding abundance, species richness and diversity patterns. Furthermore, two replicates with similar sample size presented similar values of abundance, number of species, E(S100), H’, J’ and Simpson’s D (Table 3). TABLE 3. – Sampling information from two replicate samples from the continental shelf off Vigo. Total abundance (individuals), number of species, Shannon H´ and J´ (log2), Simpson’s D (log2) and Hulbert’s Expected number of Species for a sample of 100 individuals (E(S100)) are presented. Sample Depth (m) Sampled area (m2) Abundance Number of species Shannon H´ Shannon J´ Simpson D E(S100). 20-1. 20-3. 218 0.150 243 47 4.715 0.849 0.950 32.6. 218 0.125 314 50 4.599 0.815 0.932 32.3. MACROBENTHIC COMMUNITIES FROM NAZARÉ SUBMARINE CANYON 177.
(8) The most striking result of the present work is the contrast observed between BC 26 (2894 m) and the two deeper stations, which is demonstrated by cluster and multidimensional scaling analysis. BC 26 is characterised by a very high abundance of polychaetes compared to the deeper stations due to just one species, Cossura sp. A. This difference in species abundance has markedly affected the value for Simpson’s D, Shannon’s H’ and for E(S100), resulting in a very exceptionally low value of evenness (Shannon J’). The presence of a very high number of individuals from the species Cossura sp. A at this station is not surprising, as species of this genus are known to aggregate in dense populations (Blake and Hilbig, 1994). This polychaete is also responsible for the increasing values of total abundance with sediment depth verified at BC 26. If we calculate the mean abundance of this species per cm of sediment, we can see that the mean number of Cossura sp. A follows a parabolic pattern with a maximum of 841.0 ind cm-1 at 3-5 cm depth layer. The presence of cossurids in deeper sediment layers was also recorded by Jumars (1978) who states that different species of the family Cossuridae present dissimilar vertical distributions. On the other hand, the results obtained at the lower section of the canyon (BC 25 and BC 27), specifically high concentrations of individuals in the top centimetres of sediment, followed by a rapid decrease below are the most common (Jumars, 1978; Gage and Tyler, 1991; Schaff and Levin, 1994). The exceptionally depressed species richness and low evenness values obtained for BC 26 are atypical for macrobenthos on the continental slope (e.g. Levin and Gage, 1998; Flach and de Bruin, 1999) and might be interpreted as reflecting disturbance due to organic enrichment. The influence of organic enrichment is now well known in shallow-water macrobenthic communities. According to the Pearson and Rosenberg (1978) model, along a gradient of increasing organic enrichment, higher numerical dominance and lower species richness is expected, reflecting increasing disturbance of the community. Similar responses have been observed for deep-sea macrofaunal communities in areas of oxygen depletion and organic enrichment on Pacific seamounts (Levin et al., 1994) and in areas associated with patches of macrophytes (Grassle and Morse-Porteous, 1987; Vetter and Dayton, 1998). In the present work, there is some evidence that supports the hypothesis that BC 26 presents a dis178 J. CÚRDIA et al.. turbed community. In fact, according to Vetter and Dayton (1998) the most likely canyons to experience high levels of organic loading are those near macrophyte communities (such as kelp forests, seagrass beds and estuaries) as it is the case of the Nazaré Submarine Canyon. Based (1) on the largely terrigenous character of canyon sediment samples at all depths (van Weering et al., 2002); (2) on C/N ratios exceeding Redfield stoichiometry for marine organic matter (Epping et al., 2002), and (3) on the presence of small wood pieces and fresh-water algae debris in BC 26 samples (pers. obs.; Schmidt et al., 2001) there are strong indications that the organic carbon that is being deposited in these areas is of terrestrial origin. Furthermore, based on the reactivity of organic carbon deposited in the canyon, Epping et al., (2002), suggest that the canyon is being enriched in old, laterally advected organic matter. According to van Weering et al. (2002), the middle part of the Nazaré Submarine Canyon (around 3000 m, therefore corresponding to BC 26) is characterized by high mass flux, high rates of organic carbon burial, and high excess fluxes. Franke (2000) states that stations BC 26 (2894 m) and BC 25 (3514 m) of the Nazaré Canyon show high oxygen demand values and also high mineralization rates, suggesting an important input of organic material into the canyon. Schmidt et al. (2001) also observed high rates of sedimentation within the canyon, arguing that this is not due to peculiar events, like a pulse of sedimentation from a phytoplankton bloom as the comparison of the results from two samples just outside of the canyon with others inside the canyon provided clear differences. These results suggest sedimentation focusing inside the canyon rather than regional sedimentation (Schmidt et al., 2001). Furthermore, marked nepheloid layers were observed in the Nazaré Canyon extending down to considerable water depths, indicating that there is significant transport of fine grained particles within the canyon (van Weering et al., 2002). These authors proposed the idea that the shelf is cut in its full width by Nazaré Submarine Canyon. Therefore, a large portion of the sediment being transported laterally along the shelf is being intercepted and transported through the canyon. Together with the material resuspended at the canyon head, it rapidly settles down in the upper and middle reaches of this feature where it is stored temporarily, forming a major carbon depocenter, and from where it is episodically.
(9) released to the deep sea (van Weering et al., 2002). But, transport and rapid accumulation is not enhanced in the final part of the canyon, at around 4000m, as radioisotope fluxes are only slightly higher than at comparable depths on the Galician margin (van Weering et al., 2002). All these ideas reinforce the importance of canyons, especially the Nazaré Submarine Canyon, in the connection and mass transfer from shallower to abyssal depths (Vanney and Mougenot, 1990). The high amount of organic matter associated with station BC26 (van Weering et al., 2002; Epping et al., 2002) might be available for the local communities, resulting in the high number of individuals of a few number of species that might be acting as opportunists. The results obtained from the analysis of Polychaeta feeding strategies, also support the idea of high sedimentation rates at the BC 26 area, as SSDF largely dominate this macrofaunal community, mainly because of Cossura sp. A abundances. Ophelina cylindricaudata is also a SSDF and the second most abundant polychaete at this station (70 individuals), being absent from the others. The association of SSDF with high sedimentation rates was also observed by Flach et al. (1998) in the Goban Spur. Finally, in a study undertaken by Levin et al. (1994) in areas submitted to organic enrichment inputs, the authors verified that this potential sort of disturbance was responsible for the high polychaete abundance, high dominance of relatively few species and also for the reduced diversity and species richness obtained. One of the most abundant species was also a nonidentified cossurid. That study revealed that bathyal polychaete responses to persistent organic enrichment were similar to the ones of shallow water macrofauna to organic pollution. The results obtained for BC 26 fit all these observations, supporting the hypothesis of disturbance due to organic enrichment. ACKNOWLEDGEMENTS The authors would like to thank Dr. Marc Lavaleye, Dr. Leon Moodley, Ms. Carla Garcia and Ms. Hilda Bouma and RV Meteor’s crew for all the help provided during sampling. We are also very grateful for the taxonomic help given by Dr. Marina Cunha (crustaceans) and Mr. Peter Lamont (polychaetes). This work was undertaken during M43/2 cruise of the EU’s OMEX II programme, financially supported by the EU and Germany’s government.. REFERENCES Blake, J.A. and B. Hilbig. – 1994. Dense infaunal assemblages on the continental slope off Cape Hatteras, North Carolina. DeepSea Res. II, 41(4-6): 875-899. Epping, E., C. van der Zee, K. Soetaert, and W. Helder. – 2002. On the oxidation and burial of organic carbon in sediments of the Iberian margin and Nazaré Canyon (NE Atlantic). Progr. Oceanogr., 52(2-4): 399-431. Fauchald, K. and P.A. Jumars. – 1979. The diet of worms: a study of polychaete feeding guilds. Oceanogr. Mar. Biol. Ann. Rev., 17: 193-284. Flach, E. and W. de Bruin. – 1999. Diversity patterns in the macrobenthos across a continental slope in the NE Atlantic. J. Sea Res., 42: 303-323. Flach, E., M. Lavaleye, H. de Stiger and L. Thomsen. – 1998. Feeding types of the benthic community and particle transport across the slope of the N.W. European continental margin (Goban Spur). Progr. Oceanogr., 42: 209-231. Franke, U. – 2000. Charakterisierung des Benthals des nordwestlichen Kontinentalhangs der Iberischen Halbinsel: Biogeochemische Stffflüsse. Diplomarbeit, Universität Rostock. Gage, J.D. – 1997. High benthic species diversity in deep-sea sediments: The importance of hydrodynamics. In: R.F.G. Ormond, J.D. Gage, and M.V. Angel (eds.), Marine biodiversity: Patterns and processes, pp. 148-177. Cambridge University Press, Cambridge. Gage, J.D., P.A. Lamont and P.A. Tyler. – 1995. Deep-sea macrobenthic communities at contrasting sites off Portugal, preliminary results: I Introduction and diversity comparisons. Int. Revue gest. Hydrobiol., 80 (2): 235-250. Gage, J.D. and P.A. Tyler. – 1991. Deep-sea biology: A natural history of organisms at the deep-sea floor. Cambridge University Press, Cambridge. Grassle, J.F. and L.S. Morse-Porteous. – 1987. Macrofaunal colonization of disturbed deep-sea environments and the structure of deep-sea benthic communities. Deep-Sea Res., 34(12): 19111950. Hulbert, S.H. – 1971. The nonconcept of species diversity: a critique and alternative parameters. Ecology, 52(4): 577-586. Jumars, P.A. – 1978. Spatial autocorrelation with RUM (Remote Underwater Manipulator): vertical and horizontal structure of a bathyal benthic community. Deep-Sea Res., 25: 589-604. Lambshead, P.J.D., H.M. Platt and K.M. Shaw. – 1983. The detection of differences among assemblages of marine benthic species based on an assessment of dominance and diversity. J. Nat. Hist., 17: 859-874. Lamont, P.A., J.D. Gage and P.A. Tyler. – 1995. Deep-sea macrobenthic communities at contrasting sites off Portugal, preliminary results: II Spatial dispersion. Int. Revue gest. Hydrobiol., 80(2): 251-265. Levin, L.A. and J.D. Gage. – 1998. Relationships between oxygen, organic matter and the diversity of bathyal macrofauna. DeepSea Res. II, 45(1/3): 129-163. Levin, L.A., G.R. Plaia and C.L. Hugget. – 1994. The influence of natural organic enhancement on life histories and community structure of bathyal polychaetes. In: C.M. Young and K.J. Eckelbarger (eds.), Reproduction, larval biology, and recruitment of the deep-sea benthos, pp. 261-283. Columbia University Press, New York. Magurran, A.E. – 1988. Ecological diversity and its measurement. Princeton University Press, New Jersey. Okey, T.A. – 1997. Sediment flushing observations, earthquake slumping, and benthic community changes in Monterey Canyon head. Cont. Shelf Res., 17 (8): 877-897. Pearson, T.H. and R. Rosenberg. – 1978. Macrobenthic succession in relation to organic enrichment and pollution of the marine environment. Oceanogr. Mar. Biol. Ann. Rev., 16: 229-311. Pielou, E.C. – 1969. An introduction to mathematical ecology. Wiley, New York. Rallo, A., L. García-Arberas and I. Isasi. – 1993. Fauna macrobéntica de los fondos del cañón de Capbretón: análisis faunístico de poliquetos, crustáceos y cnidarios y caracterización de puntos de muestreo según estos descriptores. Cah. Biol. Mar., 35: 69-90. Rex, M.A., C.T. Stuart and G. Coyne. – 2000. Latitudinal gradients of species richness in the deep-sea benthos of the North Atlantic. Proc. Nat. Acad. Sci., 97(8): 4082-4085.. MACROBENTHIC COMMUNITIES FROM NAZARÉ SUBMARINE CANYON 179.
(10) Rowe, G.T. – 1971. Observations on bottom currents and epibenthic populations in Hatteras Submarine Canyon. Deep-Sea Res., 18: 569-581. Sanders, H.L. – 1968. Marine benthic diversity: a comparative study. Am. Nat., 102 (925): 243-282. Schaff, T.R. and L.A. Levin. – 1994. Spatial heterogeneity of benthos associated with biogenic structures on the North Carolina continental slope. Deep-Sea Res. II, 41(4/6): 901-918. Schmidt, S., H.C. de Stiger and T.C.E. van Weering. – 2001. Enhanced short-term sediment deposition within the Nazaré Canyon, North-East Atlantic. Mar. Geol., 173: 55-67. Shannon, C.E. and W. Weaver. – 1963. The Mathematical Theory of Communication. University of Illinois Press, Urbana, Illinois. Shepard, F.P., N.F. Marshall and P.A. McLoughlin. – 1974. Currents in submarine canyons. Deep-Sea Res., 21: 691-706. Sorbe, J.C. – 1999. Deep-sea macrofaunal assemblages within the Benthic Boundary Layer of the Cap-Ferret Canyon (Bay of Bis-. 180 J. CÚRDIA et al.. cay, NE Atlantic). Deep-Sea Res. II, 46(10): 2309-2329. Thorne-Miller, B. and J. Catena. – 1991. The living ocean. Understanding and protecting marine biodiversity. Island Press, Washington D.C. van Weering, T.C.E., H.C. de Stigter, W. Boer and H. de Haas. – 2002. Recent sediment transport and accumulation on the NW Iberian margin. Progr. Oceanogr., 52(2-4): 349-371. Vanney, J.-R. and D. Mougenot. – 1990. Un canyon sous-marin du type “gouf”: le Canhão da Nazaré (Portugal). Oceanol. Acta, 13(1): 1-14. Vetter, E.W. – 1995. Detritus-based patches of high secondary production in the nearshore benthos. Mar. Ecol. Prog. Ser., 120: 251-262. Vetter, E.W. and P.K. Dayton. – 1998. Macrofaunal communities within and adjacent to a detritus-rich submarine canyon system. Deep-Sea Res. II, 45: 25-54..
(11)
Imagem

Documentos relacionados
Conforme os princípios da escola inclusiva, o ideal seria que as crianças com necessidades educativas especiais, frequentassem as turmas de ensino regular e que
Data related to indicator species, extracted from the complete dataset, per height zone (Z): total number of species (S), total number of records (N), average number of species
Uma cidadania activa enquanto uma prática educativa dialógica, participativa e democrática deve superar uma cultura autoritária, presente nas diferentes relações sociais, tendo
The abundance (number of specimens registered) of each sex of Streblidae on the host species and the abundance and prevalence (number of parasitized hosts divided by the total
Não posso deixar de referir alguns elementos estruturantes na minha formação enquanto futura médica e pessoa: o período de Erasmus no ano lectivo 2013/2014 na
In the transportation sector, since the 1970s oil crisis, Brazil has developed its energy matrix towards an important rate of sugarcane ethanol contribution and, more recently,
Para estes motivos, a elasticidade pode ser medida como Elasticidade-preço cruzada da demanda, quando avalia a mudança de preço de um bem relacionado refletindo na
