(Annals of the Brazilian Academy of Sciences)
Printed version ISSN 0001-3765 / Online version ISSN 1678-2690 www.scielo.br/aabc
http://dx.doi.org/10.1590/0001-3765201520140560
Energy trends and the water-energy binomium for Brazil
GISELE O. DA ROCHA1,2,3, JEANCARLO P. DOS ANJOS1 and JAILSON B. DE ANDRADE1,2,3
1Universidade Federal da Bahia/UFBA, Instituto de Química, Rua Barão de Geremoabo, 147, Campus Universitário de Ondina, 40170-290 Salvador, BA, Brasil
2Centro Interdisciplinar de Energia e Ambiente/CIEnAm, Universidade Federal da Bahia/UFBA, Rua Barão de Geremoabo, 147, Campus Universitário de Ondina, Ondina, 40170-290 Salvador, BA, Brasil
3INCT de Energia e Ambiente, UFBA, Rua Barão de Geremoabo, 147, Campus Universitário de Ondina, 40170-290 Salvador, BA, Brasil
Manuscript received on October 10, 2014; accepted for publication on January 26, 2015
ABSTRACT
According to the demands of energy saving and carbon emission reduction, the water vs. energy nexus
has become a major concern worldwide. Brazil occupies a singular position in the global energy system. A major portion of the Brazilian occupancies has electricity and the energy system expansion that, at first, possesses adequate means for supporting the economic growing may experience some turnovers. The Brazil determination through alternative fuels was a natural choice, given its large hydropower potential and land agricultural base. In the transportation sector Brazil has developed its energy matrix towards an important rate of ethanol and biodiesel. Although those fuels are low carbon emitter, they may probably not be an affordable alternative regarding land use, food security and water footprint. In this way, considering the recent advances in the exploration of oil from Pre-salt (9-15 million barrels) and the discovery of shale gas wells up to 245 tcf, together to unfavorable social and environmental issues associated to biofuels, the Brazilian energy matrix might turn back to the fossil fuels again. These represent challenges to the Brazilian policymakers and how they will be solved will reflect not only in Brazil but also to the world at large.
Key words: renewable energy, fossil fuel, water-energy nexus, Brazilian energy matrix.
Correspondence to: Jailson Bittencourt de Andrade E-mail: [email protected]
INTRODUCTION
Water and energy are the most fundamental elements that support life and major aspects of the modern civilization. If there would have scarcity of either one of them it would bring major concerns for the popu-lation’s survival. Water and energy are comple tely interconnected since for producing energy, water is consumed and for water supplying, treatment, and distribution, energy is required. In the same way, water is the one of the most indispensable requisites
In spite of that, there are many places where water is becoming scarce due to more frequent and longer drought periods as well as there are others suffering with intense floods, due to climate change (IPCC 2013). By the year 2025, about 60 % of the global population may suffer physical water scarcity (Sato et al. 2013, McMahon and Price 2011). The humanity is already facing important challenges regarding not only the water-energy nexus to meet water of quality and energy security but also the food demand for the next generations. Taking into account the synergy between water and energy, the only way to solve these problems is to consider them together in a point of view of environmental sustainability.
There are 1,386,000,000 km3 of water in the Earth but 97 % of it is saline water. From the 3 % of freshwater, about 99.7 % is trapped in ice caps or found in the ground level, which requires energy for removal. In turn, only 0.1 million km3
of freshwater are found in lakes and rivers as well as about 13,000 km3 in the atmosphere (McMahon and Price 2011). Since about 70 % of the freshwater in the world is currently used for irrigation (for food production, livestock need for a stable food supply, and biomass crops for production of biofuels), agriculture remains the largest user of water bodies (Service 2009, FAO 2013, Sato et al. 2013). In some countries, irrigation goes as high as 95% of the developed water supply. The competition for freshwater allocation among municipal, industrial and agricultural sectors results in a gradual shift to non-agricultural uses. In turn, this shift generates large amount of wastewater driven by the rapid growth of population, urbanization, improved living conditions and economic development thus contributing for the worsening of aquatic environment. It is also important to point out that the more wastewater is produced the more energy is required for its treatment. In places where water is scarce and the wastewater production is increasing without a proper treatment, wastewater is used for
irrigation in agriculture (Sato et al. 2013). But it is noteworthy to remember that agriculture by itself is an environment threatening. The indiscriminate use of fertilizers and pesticides for improving food production in the same available land area is leading to significant pollution of the air, surface and groundwater, and soils, putting at risk the natural ecosystems and human health (FAO 2012). Yet, there are not conclusive studies dealing with what happens when compounds and their metabolites derived from fertilizers and pesticide applications, in long-term basis, take part in the food chains and in the aquatic ecosystems.
In turn, the energy sector is the second biggest water consumer, in terms of withdrawals. It accounts for 20% of the total water withdrawals worldwide (Hadian and Madani 2013). Water is ubiquitous in the entire energy supply chain. Water is required for energy generation, exploration, processing and transport of fossil fuels (EIA 2012). For instance, water is used for drilling and fracturing in oil and gas exploration, large amounts of water is needed for cooling systems in thermo power plants and nuclear power stations, large amounts of water is required for hydropower stations to produce electricity, and feedstock for biofuel production need considerably large amounts of water for their growing (Service 2009, Mekonnen and Hoekstra 2012, Da Rocha et al. 2013, Hadian and Madani 2013, Zhang and Anadon 2013).
geological formations to the atmosphere during shale gas extraction that could lead to other major environmental concerns. In coal and nuclear plants, a large amount of water is circulated for cooling purposes. Part of this portion of water is reused for energy production in those plants and the rest is evaporated or discharged into original source, causing a range of environmental issues, such as fish mortality and algae growth (Hadian and Madani 2013). Renewable and clean ways of energy production such as hydropower, wind power, ocean power and geothermal energy are recently regarded as good alternatives to meet energy production requirements and reduce the water stress (IPCC 2011).
Some studies argue that the pointed renewable bioenergy processes are good alternatives when carbon footprint is regarded but they still consume water and would contribute for the calculations of water footprint of the energy sector. Hydropower consumes water in the way large extension surface dams lose water via evaporation (Haddad 2011, Herath et al. 2011, Mekonnem and Hoekstra 2012, Ackerman and Fisher 2013, Bahadori et al. 2013). According to Hadian and Madani (2013), the amount of water that is evaporated on a daily basis from hydropower stations across USA is enough for meeting the demand of 50 million people. Moreover the amount of water required for manufacture the turbines for wind power stations and solar photovoltaic plates are considerable (Hadian and Madani 2013) but much lower than other power resources. Since these technologies are immature, with low efficiency and subjected to interruptions (Wang et al. 2013) it becomes necessary to have energy production from non-renewable resources as backup to guarantee the sufficient supply of energy (Hadian and Madani 2013). Water and carbon footprints in different energy and government scenarios for the next 40-50 years should be taken into account in the water-energy-food discussions.
Under the background of energy saving and carbon emission reduction, the water-energy nexus has also become a major concern worldwide. In relation to the global energy system, Brazil occupies a singular position. The Brazilian dwellings have almost universal access to electricity (99% of them) and the energy system expansion that, at first, possesses adequate means in order to guarantee a fast growing economy through the diversified energy matrix may suffer some turnovers (EIA 2013). Brazil population in 2013 was 200.4 million people and United Nation projects it to be around 231 million by 2050. Taking into account the Brazilian population is considered to be young (only 11% of total population was aged at 60 or over in 2013) (United Nations 2012), together to estimates of population growth up to 2050, and its growing economy (GDP was US$ 2.253 trillion in 2012 and US$ 2.503 trillion in 2013) (World Bank 2013), the increase in the energy demand in Brazil is clear and real and will press the domestic energy matrix to be adjusted to face these challenges.
exploration of oil from the Pre-salt (estimated to be 9-15 million barrels) and the discovery of shale gas/oil wells up to 245 tcf (EIA 2013, Da Rocha et al. 2013),together to the unfavorable social and environmental issues associated to the biofuels, there would be a chance the Brazilian energy matrix could be probably turn back to the fossil fuels again. These represent challenges to the Brazilian policymakers and how they will be solved ahead will have implications not only for Brazil but also to the world at large.
ENERGY MATRIX IN BRAZIL
This subject is related by two main topics: the electric energy matrix in Brazil (hydropower, nuclear power, wind power and other forms of electricity generation) and the energy matrix for road transport and transformation sector in Brazil (oil, natural gas, and biofuels).
THE ELECTRIC ENERGY MATRIX IN BRAZIL
Hydropower
Hydropower is a renewable energy source where power is derived from energy of water moving from higher to lower elevations (IPCC 2011). Hydroelectricity is an alternative to obtain electricity from the use of the hydraulic potential of a certain portion of a river, often ensured by a construction of a dam and the consequent formation of a reservoir (Bermann 2007). It is a proven, mature, predicable, low carbon emitter, cost-competitive technology and a renewable energy source (IPCC 2011, Fu et al. 2014). Hydropower is a very efficient technology for energy production. About 96% of the water movement in the turbines is converted in electric energy (IPCC 2011). It currently provides about 16% of the global electric energy production and 86% of all electricity from renewable sources. The annual global technical potential of hydropower generation is 14,576 TWh with a corresponding estimated total capacity potential of 3,721 GW. This is four times the currently installed global
hydropower capacity. Asia and Latin America have the largest technical potential (IPCC 2011).
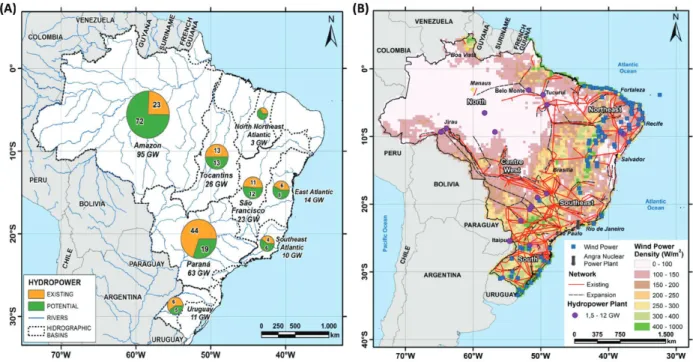
Today, Brazil possesses 1106 hydroelectric stations, coordinated countrywide via a large interconnected transmission network (Figure 1), producing 86.7 GW. It represents 67.7% of domestic matrix of electric energy. It is planned for the coming years more 38 hydropower stations begin to produce energy in the order of 14.4 GW (ANEEL 2014). But the amount of energy produced today is around one-third of the estimated 245 GW of potential in Brazil (Figure 1a) (EIA 2013). However, around 80% of Brazilian electrical energy demand is met by hydropower plants (IPCC 2011, EIA 2013). The remaining Brazilian energy needs are met by wind power, nuclear energy and thermoelectrics, in spite the fact it yet has to be to the imported around 6% of total electricity demand (ANEEL 2014).
Total electric energy matrix in Brazil produces more than 128 GW of energy, considering all ways of energy production (ANEEL 2014). In recent estimates from EIA, in the new policies scenario (NPS), it will increase to 260 GW in 2035. Hydropower, that is the main way of producing electricity in Brazil, will increase to 142 GW in 2035 (EIA 2013). But since large hydropower projects become more and more controversial in Brazil and in the world, there is no such a guarantee they will be ready to work in the expected time as well as the costs, environmental and social problems would be exacerbated over time. If no enough hydropower stations would be available to 2035 for covering the increase in the demand of electricity or there would have drought periods in the way it would compromise electricity production. Other ways for producing energy, such as natural gas-fired power stations, wind power, and bioenergy should fill this gap (EIA 2013).
in the Amazon Region, Teles Pires (1,82 GW) and Colider (300 MW) on the Teles Pires River, Garibaldi (192 MW) on the Canoas River, and Ferreira Gomes (252 MW) on the Araguari River Basin (IHA 2013). They are planned to be operational by the end of 2015. Large and continued investments are highly necessary for construction and operation of new HPP as well as in the improvement of existing and prospective energy transmission lines is fundamental in order to the supply energy follows the increase of energy demand and do not constrain the emerging economy growth in the next decades. Planning is necessary in order to avoid electricity shortage as it happened in Brazil in 2001-2002. In that time, in order to avoid eminent blackouts around the country, the population and all economic sectors had to save energy (to use about 80% of the total electricity rate of that time), which reflected negatively in the economic growth.
Hydroelectricity has been regarded to have a large water footprint on global average (Herath et al. 2011) since the large the reservoir the higher the
water loss via evaporation. When large amounts of water is evaporated it would take part in the water cycle and be transported to long distances before it goes back to the Earth surface via rainfalls. In the attempt to evaluate water footprint from hydroelectricity, there are three components that should be addressed: the blue water footprint (consumptive use of ground or surface water), the green water footprint (consumptive use of rainwater) and the grey water footprint (the volume of polluted water produced) (Hoekstra et al. 2011, Mekonnen and Hoekstra 2012). Until recently there are no comprehensive estimates about water footprint for HPP. This budget in water for HPP still is unclear. But Mekonnen and Hoekstra (2012) have calculated the blue water footprint from 35 hydropower plants (HPP) around the world (among them 8 HPP from Brazil) and the average blue water footprint of the selected HPP is 68 Gm3 yr-1. However, this may vary largely from one place to another according to reservoir surface and climate characteristics. For instance, the blue
water footprint for the following Brazilian HPP, such as Estreito (70.6 m3 GJ-1), Itaipu (7.6 m3 GJ-1), Itumbiara (52.5 m3 GJ-1), Jaguari (14.4 m3 GJ-1), Marimbondo (38.3 m3 GJ-1), São Simão (40.8 m3 GJ-1), Sobradinho (399 m3 GJ-1), and Tucuruí (49.5 m3 GJ-1) (Mekonnen and Hoekstra, 2012), vary largely from one another. However, if considering the quantity of HPP in Brazil and its continental size, there would be necessary to develop a wider study about HPP water footprint in order to have a clearer and more precise idea about this topic.
The quantity of stored water in hydropower reservoirs represents a huge amount of stored energy. In this way, HPP is subjected to freshwater availability. The volume of stored water energy has been declining in relation to the overall size of the Brazilian power sector since the mid-1980s (EIA 2013). In addition, climate change may contribute to exacerbate unequal freshwater distribution in Brazil. In spite the fact Brazil is very famous as a country with plenty of freshwater, this is mainly located in the Amazon (where less than 20% of the Brazilian population lives). On the other hand, in the South, Southeast and Northeast regions (where more than 80% of the Brazilian population lives) there is much less water available or even places facing water scarcity. For illustration, recently there have been flood events in the North (in the states of Rondonia and Acre) and drought events in the Southwest (in the state of São Paulo) due to climate change. São Paulo metropolitan area, the most populated and industrialized region in Brazil, has been experiencing water scarcity in the present day due to abnormal decline of water levels in the Cantareira basin due to insufficient rainfall. This area is already facing the real possibility of water shortage if no effective rain events come up until the end of Spring 2014 and Summer 2014-2015 (Southern Hemisphere Spring and Summer). Although electric energy for São Paulo is not at risk since it is mainly supplied from Itaipu HPP (that is not suffering of water restriction), this is an
example of what would happen in other regions of Brazil if there were no planning to meet the increase in the energy demand for the next decades. In order to assure energy security under this scenario, it becomes also necessary to invest in energy generation from sources other than hydropower. These could be bioenergy and thermoelectrics.
Nuclear power
Nuclear power is a very dense and highly concentrated form of energy (Figure 2) (WNA 2014a). A single uranium fuel pellet contains as much energy as 480 m3 of natural gas, 807 kg of coal or 149 gallons of oil (WNA 2014b, c). Currently there are 435 nuclear power reactors operating in 31 countries plus Taiwan, with capacity of over 370 GWe in total. In 2011 these provided 2518 billion kWh, about 13.5% of the electricity worldwide. Concerns about energy security and greenhouse gases emission restrictions on coal have put nuclear power back on the agenda for construction of new energy facilities in many countries (Karakosta et al. 2013, WNA,, 2014a) even though there is always a risk of nuclear accidents as have happened in the Three Miles at 1979 (Pensylvania, USA), Chernobyl at 1986 (Ukraine) and more recently in Fukushima at 2011 (Japan). Indeed, estimates account that without nuclear power, the EU power plant carbon dioxide emissions would have been about one-third higher (Karakosta et al. 2013).
Land use and water footprint have been quantified for the whole cycle of nuclear power. The steps considered are uranium mining, milling, and refining, the conversion of the yellowcake to uranium hexafluoride, enrichment, management, and/or disposal of depleted uranium, fuel fabrication, and transportation associated with materials to and from nuclear facilities (Table I) (Schneider et al. 2013).
imported fuel. At this moment, nuclear power in Brazil plays only a small role in the overall supply of electricity. But government plans on long-term basis suggest that nuclear will continue to be seen as being one of a number of options for additional energy capacity considering domestic sources of low and zero-carbon energy (EIA 2013).
Current generation capacity comes from two nuclear power reactors, Angra I (640 MW, operational in 1985) and Angra II (1.35 GW, operational in 2000), which have been operating at Angra dos Reis city, in the Rio de Janeiro state, around to the most populated and industrialized Brazilian regions. It was also started the
Figure 2 - Comparison of energy density among selected forms of energy (Energy density values are from Dilon 2009 and Elert 2005).
amodified from Schneider et al. 2013. bincludes mining, milling and refining base in the current
mix of mining technologies. cassumes centrifuge enrichment and UOX fuel fabrication. *Liters of water use per tonne uranium. #square meter of land use per tonne uranium.
TABLE I
Land and water uses for nuclear power stations.a
Water use (L tU-1)* Land use (m2 tU-1)#
Uranium extractionb 6.3 x 10⁶ 362
Conversion 1.1 x 10⁶ 8.7
Enrichment (diffusion) 1.1 x 10⁶ 10.7
Enrichment (centrifuge) 3.1 x 10⁴ 6.17
Fuel fabrication (UOX) 1.68 x 10⁴ 0.63
Fuel fabrication (MOX) 6.88 x 10⁴ 2.13
Depleted uranium management 1.1 x 10⁴ 9.1
transportation -
preliminary work on a third reactor, Angra III (1.35 GW), since 1980s, but it was suspended after the Chernobyl disaster and re-started only in 2010. After that, construction to an upgraded design has been delayed by stricter regulations due to the 2011 Fukushima accident (EIA 2013).
According to Energy International Agency (EIA) and the World Nuclear Association (WNA), projections about when Angra III is assumed to come online are around 2020 (EIA 2013, WNA 2014d). In November 2006 the government has announced plans to build four further 1000 MWe nuclear plants. In turn, Eletronuclear Company announced early in 2013 two possible sites that could be installed nuclear power plants: in the Brazilian Northeast region, on a large dam in the São Francisco River (between the states of Pernambuco and Bahia) for up to 6600 MWe, and other in the North of the state of Minas Gerais for 4000-6000 MWe (WNA 2014d). But according to predictions from EIA, beyond 2020, expansion of nuclear capacity is expected to remain limited and gradual, with total installed capacity reaching 4 GW by 2035 compared with 2 GW in 2012. On the other hand, the availability of other low carbon technologies at lower costs, such as hydropower and wind power, would limit the prospects for nuclear power (EIA 2013).
Wind Power
Wind power is a renewable source of energy production, which kinetic energy from moving air is converted to electricity. The primary use of wind energy of relevance to mitigation of CO2 emissions and water-energy nexus is to generate electric energy from large and grid-connected wind turbines developed either on land (onshore) or in seawater/ freshwater (offshore) (IPCC 2013). It is expected that wind energy could play a major role in the transition from finite and polluting energy sources (such as fossil and fissile fuels) to a sustainable and renewable form of generating energy (Archer and Jacobson 2013).
Generating power from wind turbines varies with the wind speed. Generally, the best wind sites are typically close to the sea, in flat open spaces and/or on hills or ridgelines. But a site, to be considered ideal, should be accessible and relatively close to load centers. Wind turbines located offshore can take advantage of stronger and more consistent sea breezes. Wind speeds tend to increase with increasing distance from the shore, but this also increases the sea profundity, requiring more complex foundation structures (EIA 2013).
In global terms, for moving towards the direction of energy saving and carbon-emission reduction, the integration of wind power increases fast in the power system. In light of that, the bigger would be the wind power share in the energy mix the lower would be the need for the production of electricity from fossil fuels (Wang et al. 2013). However, due to interruptions of wind power together to the still necessary investment in R&D to make it a mature technology, wind power requires additional reserves of energy from other sources. Regarding the water footprint, this is very favorable to employs wind energy since its direct water consumption is essentially negligible. Life cycle water consumption of wind power (both direct and indirect consumption) is 0.64 L kWh-1 (Li et al. 2012).
Other sources of electricity generation in Brazil
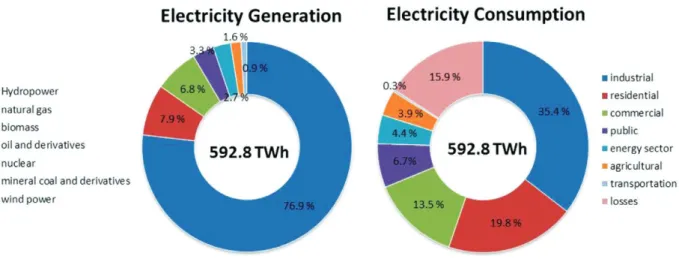
As noticed from what was discussed previously, the Brazilian electric energy matrix is essentially from renewable resources, such as hydropower (76.9 %), biomass (6.8 %), and wind power (0.9 %) according to data from 2012 (Figure 3) as well as electric energy importation from the Paraguay share in the Itaipu Binational HPP. But there are contributions from non-renewable sources such as nuclear power (2.7 %), natural gas (7.9 %), oil and derivatives (3.3 %), and coal (1.6 %) utilized either in nuclear power stations, thermoelectric
stations, and/or sugar cane plants (Figure 3) (MME 2013). Today there are 21 thermoelectric stations, distributed in every region in Brazil, which have produced an average of 2,699 MW per day all together (Petrobras 2014a) yet 20 other stations are under construction (MME 2012). Brazilian thermoelectric stations are either natural gas-fired or petroleum derivatives-fired. Main electricity consumers are industries (35.4 %), buildings (19.8 %), commercial (13.5 %), and agricultural (3.9 %) as well as losses in energy as high as 15.9 % (MME 2013).
Figure 3 - Electric Energy Matrix in Brazil at 2012 (MME 2013). For interpretation of the references to color in this figure legend,
the reader is referred to the web version of this article.
Based on the Brazilian GDP and population growing rates projections, the Energy International Agency estimates primary energy use increases to 2035 by between 56% and 88%, depending on the scenario. Demand in electric energy will go upward rising by nearly 3% per year on average over the period from 2011 to 2035, doubling from 471 terawatt-hours (TWh) to 940 TWh. These projections will demand investments in the electric energy sector in the order US$ 567 billion, at a rate of US$ 24.3 billion per year, on average, until 2035. In the same period, it is projected that Brazil continues to be a minor electricity importer, at 30-40 TWh per year. Final energy consumption by sector in Brazil
at 2035 will be 148 megatonnes of oil equivalents (Mtoe) by the industrial sector, 132 Mtoe by the transport sector, 57 Mtoe by buildings, and 51 by other sectors, including agriculture (EIA 2013).
the advance in the negotiation for a continued delivery of conventional natural gas from Bolivia, the decision on whether or whether not to explore conventional and unconventional sources of shale formations as well as the following to carbon emission reduction agreed by the Copenhagen Accord and the IPCC scenarios for climate change).
THE ENERGY MATRIX FOR ROAD TRANSPORT AND
TRANSFORMATION SECTOR IN BRAZIL
Fossil power
Fossil fuels such as coal, petroleum, and natural gas have been widely used by humanity for energy production. Energy density for natural gas is 55.6 MJ kg-1as well as it is 45.8, 45, 44.2, and 21.5 MJ kg-1 for diesel, gasoline, crude oil, and coal, respectively (Figure 2). Fossil fuels have been providing energy for transportation of people and goods, industrial sector, agricultural purposes, and private and public buildings (McMahon and Price 2011, Nicolini et al. 2011). Traditionally fossil fuels have been claimed to be finite and non-renewable resources as well as being the main environmental stressors regarding carbon emissions to the atmosphere. Nowadays emerging concerns about the continued and widespread use of fossil fuels for energy generation is also related to the water footprint. Water is a necessary component in every step in the fuel production chain, which begins in the mining process and going through the extraction and processing of fuels, cooling equipments, and the suppression of dust. Yet, water is also utilized for land reclamation and revegetation of affected areas (US GAO 2009, 2010, 2012, McMahon and Price 2011). Nevertheless, in the present day, every nation depends, in some extension, on the exploration and production of oil and gas, either from its own territory or by importation from the producing countries, in order to meet the energy demand, to reach energy security, and not to constrain its economical growing.
Water withdrawal and consumption requi-rements are major issues for hydrocarbons (oil and gas) exploitation and/or exploration (US GAO 2012, EIA 2013). Depending on the kind of geological formation coal, oil and natural gas resources are found they are regarded as either conventional or unconventional fuels. In general terms, when fossil fuels are found in porous deep rock formations they can easily flow to the surface after conventional and vertical drilling are named conventional fuels. On the other hand, when oil and gas are trapped in impermeable and tight rock reservoirs such as shale formations or sandstone and carbonate rocks they are called shale gas/shale oil and tight gas/tight oil, respectively. They are considered unconventional fuels since for their extraction it is necessary both vertical and horizontal drilling and the injection of large amounts of water and chemicals under high pressures to expel the oil and gas from their reservoirs to the surface, through a process called “hydrofracturing” or “fracking” (McMahon and Price 2011, Grubert et al. 2012, US GAO 2012, Jenner and Lamadrid 2013, Da Rocha et al. 2013, Chang et al. 2014, Mangmeechai et al. 2014 and references therein).
contaminants present in produced water discharged from oil and gas operations may threaten human health and the environment (US GAO 2012).
Conventional reservoirs are located both onshore and offshore but unconventional fuels are found onshore only. World reserves of proven conventional natural gas are 6,707 trillion cubic feet (tcf). China, United States, Canada and Australia have the biggest conventional natural gas reserves. In turn, proven and recoverable world unconventional natural gas from shale formations is 7,299 tcf (US EIA 2014a). In 2035, projections account that around 50% of natural gas demand in the world will be met by extracting it from unconventional reserves (US EIA 2014b). According to US Energy Administration, Brazil has a reserve up to 245 tcf natural gas from proven shale formations (US EIA 2014b). Shale gas reservoirs in Brazil are located in the Paraná, Solimões, Amazonas, Recôncavo and São Francisco Basins. In turn, recently published by US EIA, there were around 345 billion barrels of proven world reserves of shale oil (US EIA 2014a, b). The estimates for Brazil are 34.8 billion barrels of shale oil (Campos 2013). Figure 4 show both conventional and unconventional hydrocarbon reserves in Brazil. Unconventional shale oil and shale gas exploitation/exploration have not yet been started in Brazil. However, the Brazilian Agency for Petrol, Natural Gas and Biofuel Regulation (ANP) had auctions for shale gas exploration in 2013.
In regard to water footprint, shale gas extraction demands 50-100 times more water than extraction of conventional natural gas. It happens due to additional steps in recovering natural gas from shale formations, such as the drilling and fracking processes. For instance, the drilling step in Marcellus shale needs 296 thousand liters of water and the fracking step needs 140,600 thousand liters of water per well. In spite the fact shale gas consumes more water than conventional gas it consumes less water than coal. In comparison, while coal extraction consumes 11-53 L water per
MWh (L MWh-1) and shale gas extraction consumes 29.4 L MWh-1, water requirement for extraction of conventional natural gas is negligible (Jenner and Lamadrid 2013, also see Dale et al. 2013). In turn, water needs for traditional oil production is 28-73 L GJ-1, enhanced oil recovery is 75-9,065 L GJ-1, and oil sands are 70-1,800 L GJ-1 (McMahon and Price 2011). Additionally, water requirements for on-site consumptive water use for shale oil production are 629-703 L of water per barrel for surface production, and 159-322 L of water per barrel for in situ production (Mangmeechai et al. 2014).
ten years, in the order of a trillion dollars, which means about half of Brazil's GDP in 2012 to a full exploitation of oil from Pre-salt basins of Campos and Santos (The Economist 2013). But, estimates of EIA the Santos basin are by far the largest source of projected supply growth in Brazil to 2035.
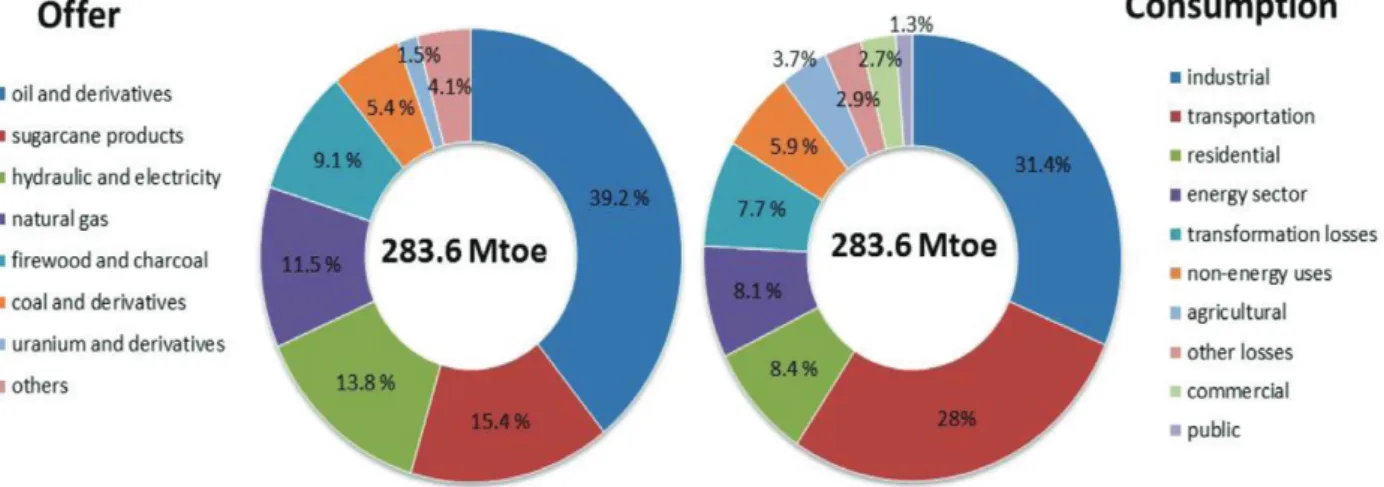
In 2012, the total energy production was 283.6 megatonnes equivalent oil (Mtoe) in Brazil (Figure 5). Different forms of energy generation have contributed to these fi gures, such as oil and derivatives (39.2%), sugarcane products (15.4%), natural gas (11.5%), electricity (13.8%), fi rewood Figure 4 - Map showing onshore and offshore Brazilian Basins for conventional and
main raw materials used in biodiesel plants (FAO 2013, ANP 2014a, Galembeck 2010).
Brazil possesses a total area of 851 million hectares and it is estimated that the portion used for agricultural production is around 67 million
hectares. Among the main Brazilian crops, it should be highlighted the areas used for the plantations of soybean (30,173,100 ha) and sugarcane (9,004,500 ha) in 2014/2015, which together occupy 58% of the total agricultural area. These are the main raw
Figure 5 - The gross energy fl ux for Brazil in 2012 (MME 2013). For interpretation of the references to color in this fi gure legend,
the reader is referred to the web version of this article.
and charcoal (9.1%), coal (5.4%), and uranium (1.5%), among others (4.1%). Main consumers were industries (31.4%), transport sector (28%), buildings (8.4%), and losses (2.9%), among other minor consumers (MME 2013).
Projections of the Brazilian conventional oil and gas resources have risen as the estimated Pre-salt resources became clearer. The estimative about conventional hydrocarbons in Brazil are as high as 120 billion barrels. But until the end of 2012 only 14 billion barrels have been produced. Of the 106 billion barrels remaining, i.e. around 90% of the reserves, only 14% of the latter are proven reserves. An additional of 3 billion barrels of unconventional oil is present in the Irati formation in the Paraná Basin (EIA 2013). According to a recent evaluation done by the US Energy Information Administration (US EIA) in the Solimões, Amazonas and Paraná onshore basins, technically recoverable light tight oil resources are estimated to be around 5.4 billion barrels of oil (US EIA 2013). Almost 90% of recoverable resources in Brazil are still waiting to
be produced. In terms of natural gas resources in Brazil, it is potentially interlinked to oil production. The conventional natural gas resources of about 12 trillion cubic meters (tcm) are associated to both onshore and offshore oil resources. Half of it is found in the Santos basin. In the EIA projections, Brazil has the potential to become a major gas producer, with output rising from 18 bcm in 2012 to 38 bcm in 2020, and 92 bcm in 2035 (EIA 2013).
Biofuels
materials used in the country for the production of biodiesel and ethanol, respectively (Table II) (CONAB 2014a, b).
In 2011, world production of liquid fuels from biomass totaled 2.1 million barrels per day, or about 2% of the energy supplied by all liquid fuels. Among the projections to 2040, it is estimated that will be produced almost 6 million barrels of biofuels per day, registering an increase of about 200% (EIA 2013).
Since the 1970s, ethanol production in Brazil has increased considerably with the creation of the Brazilian government program Pro-Alcohol, for trying to solve the energy crisis at that time. This program aimed to increase the production of agro-energy crops and industrial processing capacity, in order to obtain alcohol to replace gasoline (Bray et al. 2000). Ever since, Brazil utilizes sugar cane for ethanol production through fermentation. In turn, the ethanol produced in United States and Europe is mainly from maize, and from wheat and barley, respectively. In Brazil, the widespread availability of flex-fuel vehicles (promoted through tax incentives) combined with the rising oil prices have led to a rapid growth in bio-ethanol and sugar cane production since 2000. Today, more than 80% of the current Brazilian automobile production has flexible-fuel capability (Balat and Balat 2009).
On the other hand, diesel specifications in Brazil have historically changed, especially with the creation of National Program for Production and Use of Biodiesel (PROBIODIESEL) in 2002, to encourage the use of transesterified vegetable oils in the national energy matrix (Ramos et al. 2003). In 2005, there was a significant change in Brazilian diesel through the Biodiesel Program, which determined a gradual addition of 2% to 5% biodiesel to diesel (that are then named B2 and B5, respectively) fuel that would be implemented up to 2013. Instead, from 2010 to June 2014, the B5 mixture and then B6 had already been adopted. Currently, the Brazilian Government adopts the addition of 7% of biodiesel (B7) to diesel, since November 2014 (Martins et al. 2012, Matoso 2014, MME 2014).
Crop Planted area (million ha)
Soybean 30.2
Corn 15.8
Sugarcane 9.0
Bean 3.3
Rice 2.4
TABLE II
Planted area of the main Brazilian crops, in 2014.
Source: CONAB (2014a, b).
The largest user of water is agriculture with about 70% of the available freshwater in the globe. However, the amount of freshwater used for irrigation purposes in arid developing countries may account for as much as 90% of total water use (Brazilian et al. 2011, Sato et al. 2013). Thus, over the next 40 years agriculture will have to become increasingly efficient in its use of water through improved management of irrigation, the development of cropping and livestock production systems that use water more efficiently. Also reductions in water loss from agricultural systems and improved watershed management are highly suggested (FAO 2010).
The blend of biodiesel in mineral diesel is a reality in Europe, the United States and Brazil. In late 2010, Brazil had 64 plants producing biodiesel authorized by the Brazilian National Agency of Petroleum, Natural Gas and Biofuels (ANP) for operation, corresponding to a total authorized capacity of 13,155.33 m3 day-1. Of these 64 plants, 47 had authorization for commercialization of the biodiesel produced, corresponding to 11,542.80 m3
day-1 capacity. Today, there are 61 plants producing
biodiesel authorized by the ANP for operation in the country, corresponding to a total authorized capacity of 21,167.79 m3day-1, with a total production of 2,917,488 m3, in 2013, and of 1,253,333 m3 between January and May 2014. However, the total capacity of authorized biodiesel production can be increased to 1,326.72 m3 day-1, which represents a 6% increase in current capacity (ANP 2010, 2014a).
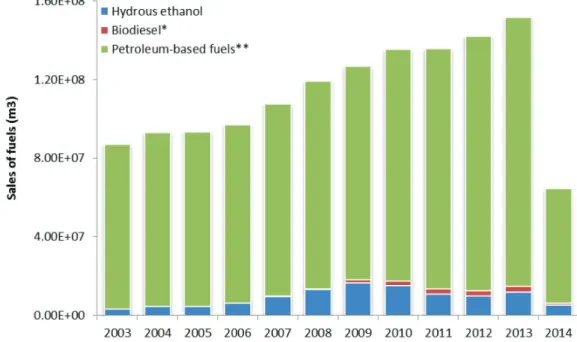
In 2013, Brazil accounted for the sale of 11,754,963 m3 of hydrous ethanol and 2,917,488 m3
of biodiesel, which corresponds to 8.6% and 2.1%, respectively, of total volume of petroleum-based fuels sales (ANP 2014b). Nowadays, with the significant increase in the Brazilian fleet (increase of 36,658,501 vehicles in 2003 for 84,063,191 vehicles in June 2014) (DENATRAN 2014), the sales of ethanol and biodiesel are increasing every year as can be observed by the evolution of fuel sales in Brazil in recent years, with a consequent increase in demand by the production of these fuels (Figure 6). However, since the ethanol production is regulated by the fluctuation of sugar price in the International Market, the availability of ethanol in domestic market has been decreasing in late-2013 and 2014. In this way, the ethanol price has been suffering a sharp rise what has been obligating Brazilian consumers to decrease the proportions of ethanol use in their cars, then using more gasoline. This would potentially change the panorama of ethanol sales in the next one or two years if this trend continues.
Despite the biofuel use contributes for redu-cing greenhouse gas emissions, the production of these fuels could demand a more intensive water use than the production of some kinds of fossil fuels. Some authors assert that the large-scale biofuels production can significantly affect the overall water footprint, although the actual stress of water resources depends on the feedstock type and cultivation practice and on the local hydrological background (Bernardi et al. 2013, Cai et al. 2013).
Some authors cite the criticisms that biofuels receive due to the need of large amounts of water for their feedstock production, and this could cause large-scale water scarcity. Compared with the other fuels, ethanol from sugar cane stands out for its higher water demand in the industrial process. It is estimated that around 2,516 liters of water are used to produce one liter of ethanol from sugar cane. According to studies about water footprint, in 2030, to meet the demand of gasoline and sugar cane ethanol will be needed 613.2 km3 year-1 of green water to cultivate sugar cane. However, recent studies have shown that through planning the reuse of water in the process of producing biofuels, the figures for water demand can be significantly reduced (Gerbens-Leenes et al. 2009b, Rodriguez and Nebra 2010, Chavez-Rodriguez et al. 2013). On the other hand, there are reports that when considering irrigation system for the corn ethanol production, it is used between 350 and 1,400 L water per liter of ethanol, depending on the region where corn is cultivated (Dominguez-Faus et al. 2013). Thus, in the 2013/2014 harvesting season, Brazil produced about 27,735,856 m3 of ethanol from sugar cane per day, which may have led to a consumption of up to 321 billion liters of water during the production of this fuel (UDOP 2014).
Generally, estimates indicate that are used of aproximately 108,000 L GJ-1 of water with soybean for biodiesel production as well as 394,000 L GJ-1 with sugar cane for ethanol production. Moreover, there also are values about to 50 L GJ-1 and 14 L GJ-1 in the transformation of ethanol and biodiesel,
respectively (McMahon and Price 2011). For the production of biodiesel from soybean, it is estimated that is used, on average, 13,676 liters of water per liter of fuel produced, distributed at different stages of the production process (Gerbens-Leenes et al. 2009b).
In Brazil the total consumption of water needed for the production of sugar cane ethanol is distributed in different steps in the production process, such as sugar cane washing (5,330 L), extracting/grinding (400 L), juice concentration (30 L), electrical power generation (70 L), fermentation (4,000 L), distillery (4,000 L) and other steps (800 L), considering the total water consumption in each stage per metric ton of sugar cane (McMahon and Price 2011).
In Brazil, only 1% of the total area used for sugar cane growing is irrigated. In turn, approximately 45% of sugar cane production is used for ethanol production. It is noteworthy that the total consumption of water in cane sugar crop may vary from 1100 to 1800 mm per year, reaching peaks in the range of 6 to 15 mm per day, depending on the duration of culture or location of farming (Carr and Knox 2011). But in Brazil, this amount of water mainly comes from rainfall. As for the soybean crop the water requirement increases with the development of the plant, which the amount of water required by the crop for optimum performance, varies between 450 and 800 mm per cycle (7-8 mm per day) (Catuchi et al. 2012). However, the rapid growth and sheer scale of the biofuel sector has potentially negative implications for all four dimensions of food security – availability, access, stability and utilization – as it may increase the competition for land and water resources (FAO 2013).
To meet the increased demand for biofuels is necessary intensification of agricultural activities such as tilling more land and higher agrichemical application. Despite the potential of biofuels to alleviate dependence on foreign oil, there is the aggravating that often there may be water pollution by agricultural drainage containing fertilizers and pesticides, contaminating streams, rivers and lakes, and cause eutrophication of receiving water bodies. Solute transport processes can result in the migration of pesticides from the soil surface, facilitated by water from irrigation or rain, leading to the movement of these chemicals, which can contaminate water resources (Smith et al. 1999, Dominguez-Faus et al. 2009, Rodríguez-Liébana et al. 2014, Zhang et al. 2014).
Studies on the impact of biofuel production on water quality have shown that the eutrophication process (increased concentration of nutrients, especially nitrogen and phosphorus in water bodies) can promote excessive plant growth and decay of aquatic systems, leading to an increase of phytoplankton, decreased dissolved oxygen, increased turbidity, loss of biodiversity, reduction of commercially important fish, and other undesirable ecological effects (Delucchi 2010).
The various fertilizers applied are not used by different cultures, promoting leaching of large amount of it into water resources, resulting in increased concentrations of nitrates, nitrites, ammonia, sulfates and phosphates in water (Azizullah et al. 2011). Intensive agricultural activities and improper rural infrastructure are recognized as the main causes of water pollution of groundwater in biofuels production. In most cases, the negative impacts result from use of fertilizing products, improper storage of fertilizers and poor wastewater management. In this way, analysis of groundwater quality revealed that agricultural activities cause a significant increase in the total nitrogen concentration (27.5 mg Ntot. dm-3), nitrates (20.6 mg N-NO
3 dm-3) and sulfates
(296.2 mg SO4 dm-3) (Orzepowski et al. 2014). Overuse and mismanagement of mineral fertilizers have polluted groundwater to different degrees in almost all developed countries and, increasingly, in many developing countries (FAO 2010).
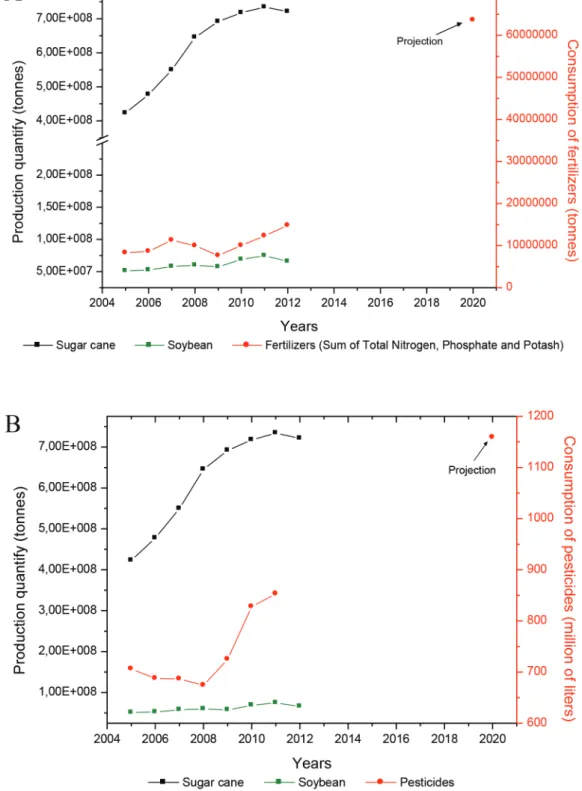
The national average amount of fertilizers marketed by Brazilian State presented about to 170 kg ha-1, in 2011, highlighting the states of Minas Gerais (310 kg ha-1), Goiás (240 kg ha-1) and Espírito Santo (230 kg ha-1), being the first two among the largest consumers of pesticides in the country as well. It is estimated that, in 2013, has been marketed 31 million tons of fertilizers in Brazil, which may cause the risk of contamination of underground aquifers. The regions whose basins have headwaters in Minas Gerais (such as the Rio Doce and Rio Grande Basins) are those in which there is greater consumption of fertilizers mainly of nitrogen and potassium, by acreage (ANA 2013, ANDA 2014).
Brazil has presented significant constraints to the expansion of agricultural land since this increase would necessarily occur through productivity growth, i.e. produce more in the shortest possible space (Zarbin et al. 2009). Thus, the use of agricultural fertilizers and pesticides should become even more intensive, which would be necessary for agricultural productivity to meet the demand for biofuel production. This fact is shown in Figure 7, which it is possible to note that between 2005 and 2012 there was an increase in the consumption of fertilizers and pesticides. The observed increase in those years have been alarmingly risen principally after 2010, showing an increase of about 20% per year. However, it is now observed some stagnation in the production of these crops.
can persist in soil for several years, and may reach the surface and groundwater. Thus, drinking water may be an important form of human exposure to contamination by pesticides transported and dissolved in water. For environmental and drinking water, the maximum admissible concentration of a single pesticide compound established by the European Union (EU) is 0.1 μg L-1 as well as 0.5 μg L-1 is the maximum allowed for the total concentration for all pesticides found together (Menezes Filho et al. 2010, Azizullah et al. 2011, ANA 2013).
There are studies reporting the presence of pesticides in surface and groundwater in Brazil has been performed mainly involving the class of organochlorines, which many of them have been banned in the country since the 1980s. This is attributed to the large amount of pesticides used in agriculture to maintain the high productivity of different crops such as soybeans, sugar cane, corn and cotton (Nogueira et al. 2012).
This fact causes great concern because only 0.1% of the amount of pesticides used in the field reaches the specific target, while the remaining 99.9% possess the potential to affect different environmental systems, such as air, soil, surface water and groundwater. Accordingly, water pollution by overuse of agrochemicals in cropping systems has negative impacts on a very large scale and can cause aquatic dead-zones that spread out over large areas. Therefore, the presence of pesticide residues in water, and other environmental compartments, has been related as a probable cause of increased rates of cancer and the incidence of other diseases that affect the human population (Pinheiro and de Andrade 2009, FAO 2010).
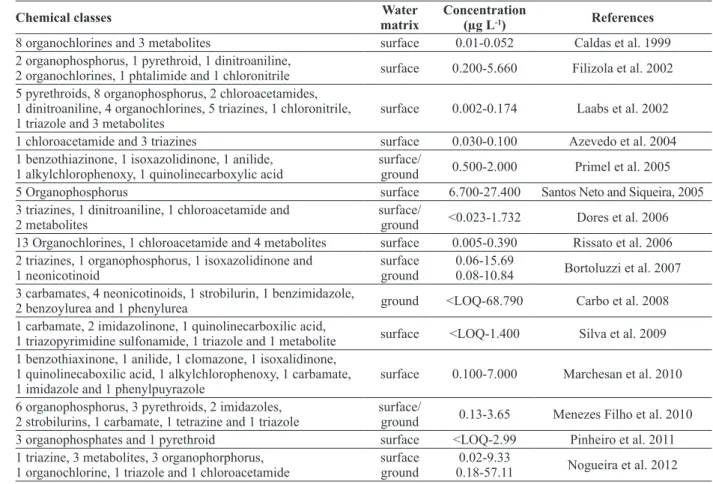
Pesticides of different chemical classes have been detected in studies of surface and groundwater in Brazil (Table III). Some pesticides commonly used in soybean crops are chlorpyrifos, α-endosulfan, β-endosulfan, flutriafol, malathion, methyl parathion and glyphosate (Nogueira et al. 2012). In the cultivation of sugarcane has been registered the
current use of the following pesticides hexazinone, diuron, tebuthiuron, 2,4-D, glyphosate, ametryn, paraquat, endosulfan, metribuzin, clomazone, imazapic, atrazine, acetochlor, terbufos, imidachlopid and chlordecone (Lehtonen 2009).
It is noteworthy that, in Brazil, the presence of some pesticide residues in water bodies is regulated, in which the presence of the substances listed in Table IV shall be handled in accordance with their respective maximum values allowed (Brasil 2006).
Analysis of the pesticides presence belonging to different chemical classes in surface water and groundwater samples in the Brazilian State of Sergipe showed that compounds found presented concentrations up to 3.65 µg L-1. It is noteworthy that the levels of contamination by methyl parathion in groundwater samples were quite significant compared to the maximum limit established by the Ministry of Health in Brazil (0.04 µg L-1). This fact is of extreme concern since the local population uses groundwater for personal consumption (Menezes Filho et al. 2010). Pesticides such as dimethoate, methyl parathion, permethrin and ethion were detected in water samples collected in an irrigation field in São Francisco River, located in the state of Sergipe (Brazil), in concentrations up to 2.99 µg L-1 for dimethoate. The concentrations of the pesticides analyzed exceeded the maximum permissible limit values set by European Union legislation for the individual pesticides. However, tap water samples were analyzed and showed that the concentrations of permethrin and methyl parathion were below the maximum permissible levels by the Brazilian Legislation (Pinheiro et al. 2011).
Chemical classes Water matrix
Concentration
(µg L-1) References
8 organochlorines and 3 metabolites surface 0.01-0.052 Caldas et al. 1999 2 organophosphorus, 1 pyrethroid, 1 dinitroaniline,
2 organochlorines, 1 phtalimide and 1 chloronitrile surface 0.200-5.660 Filizola et al. 2002 5 pyrethroids, 8 organophosphorus, 2 chloroacetamides,
1 dinitroaniline, 4 organochlorines, 5 triazines, 1 chloronitrile, 1 triazole and 3 metabolites
surface 0.002-0.174 Laabs et al. 2002 1 chloroacetamide and 3 triazines surface 0.030-0.100 Azevedo et al. 2004 1 benzothiazinone, 1 isoxazolidinone, 1 anilide,
1 alkylchlorophenoxy, 1 quinolinecarboxylic acid
surface/
ground 0.500-2.000 Primel et al. 2005
5 Organophosphorus surface 6.700-27.400 Santos Neto and Siqueira, 2005
3 triazines, 1 dinitroaniline, 1 chloroacetamide and 2 metabolites
surface/
ground <0.023-1.732 Dores et al. 2006 13 Organochlorines, 1 chloroacetamide and 4 metabolites surface 0.005-0.390 Rissato et al. 2006 2 triazines, 1 organophosphorus, 1 isoxazolidinone and
1 neonicotinoid
surface ground
0.06-15.69
0.08-10.84 Bortoluzzi et al. 2007 3 carbamates, 4 neonicotinoids, 1 strobilurin, 1 benzimidazole,
2 benzoylurea and 1 phenylurea ground <LOQ-68.790 Carbo et al. 2008
1 carbamate, 2 imidazolinone, 1 quinolinecarboxilic acid,
1 triazopyrimidine sulfonamide, 1 triazole and 1 metabolite surface <LOQ-1.400 Silva et al. 2009 1 benzothiaxinone, 1 anilide, 1 clomazone, 1 isoxalidinone,
1 quinolinecaboxilic acid, 1 alkylchlorophenoxy, 1 carbamate, 1 imidazole and 1 phenylpuyrazole
surface 0.100-7.000 Marchesan et al. 2010 6 organophosphorus, 3 pyrethroids, 2 imidazoles,
2 strobilurins, 1 carbamate, 1 tetrazine and 1 triazole
surface/
ground 0.13-3.65 Menezes Filho et al. 2010 3 organophosphates and 1 pyrethroid surface <LOQ-2.99 Pinheiro et al. 2011 1 triazine, 3 metabolites, 3 organophorphorus,
1 organochlorine, 1 triazole and 1 chloroacetamide
surface ground
0.02-9.33
0.18-57.11 Nogueira et al. 2012
TABLE III
Levels of pesticides of different chemical classes found in surface and ground water in Brazil.*
* Modified from Nogueira et al. 2012.
Pesticides Maximum allowed
values (µg L-1
) Pesticides
Maximum allowed values (µg L-1
)
Alachlor 20 Hexachlorobenzene 1
Aldrin and Dieldrin 0.03 Lindane (γ-BHC) 2
Atrazine 2 Metolachlor 10
Bentazone 300 Methoxychlor 20
Chlordane (isomers) 0.2 Molinate 6
2,4-D 30 Pendimethalin 20
DDT (isomers) 2 Pentachlorophenol 9
Endosulfan 20 Permethrin 20
Endrin 0.6 Propanil 20
Glyphosate 500 Simazine 2
Heptachlor and
Heptachlor epoxide 0.03 Trifluralin 20
TABLE IV
Maximum values of pesticides recommended for drinking water in Brazil* (Brasil, 2006).
CONCLUSION
The Brazilian energy matrix is diversified. After the World War II, at the end 1940s and the beginning 1950s, with the start of the nuclear age in the world, Brazil started to invest in S&T for the development of nuclear power stations for electric energy generation. In advancing the knowledge about nuclear science in the country together to agreements with other countries, Brazilian scientists were able to get the needed expertise in the field and the country could start the nuclear power stations in the Rio de Janeiro coast. Just after some years, at 1953, it was found oil reserves in the state of Bahia. Under the slogan “O Petróleo é nosso” (“The oil is ours”) the Brazilian Government has created the state oil company Petrobras and has established the state monopoly on the petroleum exploration, refining and transportation.
Following, with the oil crisis in the 1970s, Brazil has decided, in order to not to be excessively dependent of oil imports, to start the Pro-Alcohol Program. This program has helped to develop the use of sugarcane ethanol as an alternative fuel to fossil diesel and gasoline. For this, it was necessary to scale up the process for producing commercial ethanol plants and to either adjust or develop vehicle engines. Today, this is a reality since the Brazilian fleet is divided by flexfuel, gasoline, ethanol, and diesel automobiles. Our petrol stations commercialize sugarcane hydrated ethanol, gasoline blended to 20-25% of anhydrous ethanol, and diesel. In 2002, the Brazilian Government has started the National Program for Production and Use of Biodiesel and in 2005 the decree that established the compulsory and gradual addition of biodiesel to fossil diesel up to the proportion of 5% (v/v) biodiesel to diesel (B5). Nowadays it is adopted B7. The alternative biofuels have been implemented in the Brazilian energy mix together to the renewable forms of electric energy generations (such as hydropower stations and wind power) have given to Brazil a unique position in the global energy matrix system.
More recently, in 2008, Brazil has found the ways to exploit conventional oil and the associated natural gas in the Pre-salt what has virtually given the oil independency from importations. This fact has been celebrated since then. However, Brazil has been investing large amount of money in S&D in order to get adequate technology and enough innovation to fully exploit the recoverable oil from Pre-salt in the Santos and Campos Basins. But the Pre-salt oil production still has to be raised to address the domestic oil demand. Perhaps it might cost more and take more time than estimated previously. And the country must be ready and get planned for this situation. The recent discoveries of unconventional extraction by fracking process of oil and natural gas from shale formations would be such a way to have a good fossil fuel alternatives until all bottlenecks regarding Pre-salt oil exploitation be overcome as well as to get an even more diversified energy matrix for Brazil. However, the exploitation of unconventional oil and gas in Brazil will also depend on the domestic expertise development together to a real evaluation about environmental (water, carbon, and ecological footprints), and social (land use) issues. The viability of these endeavors still needs to be reached by the Brazilian policymakers. But we will see what come next.
ACKNOWLEDGMENTS
Authors thank the INCT for Energy & Environment, Conselho Nacional de Desenvolvimento Científico e Tecnológico (CNPq), Coordenação de Aperfeiçoamento de Pessoal de Nível Superior (CAPES) and Fundação de Amparo à Pesquisa do Estado da Bahia (FAPESB).
RESUMO
na matriz energética mundial. A maior parte das habitações brasileiras tem eletricidade; e a expansão da matriz energética que, a princípio, possui meios adequados para sustentar o crescimento econômico, pode experimentar transformações. A determinação do Brasil pelos combustíveis alternativos foi uma escolha natural, dado seu potencial hidrelétrico e a extensão de terras agriculturáveis. No setor de transportes, o Brasil desenvolveu sua matriz energética com importante contribuição do etanol e do biodiesel. Embora esses combustíveis sejam baixos emissores de carbono, não são alternativas acessíveis quando considerados o uso da terra, segurança alimentar e water footprint. Desta forma, considerando os recentes avanços na exploração de petróleo do Pré-Sal (9-15 milhões de barris) e as recentes descobertas de jazidas de gás de xisto (245 tcf), juntamente às questões sociais e ambientais desfavoráveis dos biocombustíveis, a matriz energética brasileira poderá voltar a ter como foco os combustíveis fósseis. Estes desafios deverão ser resolvidos nas próximas décadas, refletindo não só no Brasil, mas também em todo o mundo.
Palavras-chave: energia renovável, combustível fóssil, água-energia, matriz energética brasileira.
REFERENCES
ACKERMAN F AND FISHER J. 2013. Is there a water-energy nexus in electricity generation? Long-term scenarios for the western United States. Energy Pol 59: 235-241. ANA - AGÊNCIA NACIONAL DE ÁGUAS. 2013. Conjuntura dos
recursos hídricos no Brasil: 2013. Brasília, Brazil. ANDA - ASSOCIAÇÃO NACIONAL PARA DIFUSÃO DE ADUBOS.
2014. Estatísticas: Principais indicadores do setor de fertilizantes. Available on http://www.anda.org.br, accessed at 10th April 2014.
ANEEL - AGÊNCIA NACIONAL DE ENERGIA ELÉTRICA. 2014. Available on http://www.aneel.gov.br/capacidadebrasil/ , accessed at 20th April 2014.
ANP - AGÊNCIA NACIONAL DO PETRÓLEO, GÁS NATURAL E
BIOCOMBUSTÍVEIS. 2010. Boletim mensal do biodiesel - março/2010. Available on http://www.anp.gov.br/?id=472, access at 15th April 2010.
ANP - AGÊNCIA NACIONAL DO PETRÓLEO, GÁS NATURAL E BIOCOMBUSTÍVEIS. 2014a. Boletim mensal do biodiesel - junho/2014. Available on http://www.anp. gov.br/?pg=65538&m=&t1=&t2=&t3=&t4=&ar=&ps= &cachebust=1366737978185, access at 23rd July 2014.
ANP - AGÊNCIA NACIONAL DO PETRÓLEO, GÁS NATURAL e Biocombustíveis. 2014b. Dados estatísticos mensais - agosto/2014. Available on http://www.anp.gov.br/?pg= 64555&m=&t1=&t2=&t3=&t4=&ar=&ps=&cachebu st=1407156064123, access at 04th August 2014.
ARCHER CL AND JACOBSON MZ. 2013. Geographical and seasonal variability of the global “pratical” wind resources. Appl Geog 45: 119-130.
AZEVEDO DA, GERCHON E AND REIS EO. 2004. Monitoring of Pesticides and Polycyclic Aromatic Hydrocarbons in Water from Paraíba do Sul River, Brazil. J Braz Chem Soc 15: 292-299.
AZIZULLAH A, KHATTAK MNK, RICHTER P AND HÄDER DP. 2011. Water pollution in Pakistan and its impact on public health - A review. Environ Intern 37: 479-497.
BAHADORI A, ZAHEDI G AND ZENDEHBOUDI S. 2013. An overview of Australia’s hydropower energy: Status and future prospects. Renew Sustain Energy Rev 20: 565-569. BALAT M AND BALAT H. 2009. Recent trends in global
production and utilization of bio-ethanol fuel. Appl Energy86: 2273-2282.
BERMAN C. 2007. Impasses and Controversies of hydroelectricity. Estudos Avançados 21: 139-154.
BERNARDI A, GIAROLA S AND BEZZO F. 2013. Spatially explicit multiobjective optimization for the strategic design of first and second generation biorefineries including carbon and water footprints. Ind Eng Chem Res 52: 7170-7180. BORTOLUZZI EC, RHEINHEIMER DS, GONÇALVES CS,
PELLEGRINI JBR, MARONEZE AM, KURZ MHS, BACAR
NM AND ZANELLA R. 2007. Investigation of the occurrence of pesticide residues in rural wells and surface water following application to tobacco. Quim Nova 30: 1872-1876.
BRASIL. 2006. Ministério da Saúde – Secretaria de Vigilância em Saúde. Vigilância e controle da qualidade da água para consumo humano. Brasília: Ministério da Saúde.
BRAY SC, FERREIRA ER AND RUAS DGG. 2000. As políticas da agroindústria canavieira e o PROÁLCOOL no Brasil. Marília: UNESP, 104 p.
BRAZILIAN M ET AL. 2011. Considering the energy, water and food nexus: Towards an integrated modeling approach. Energy Pol 39: 7896-7906.
CAI H, HU X AND XU M. 2013. Impact of emerging clean vehicle system on water stress. Appl Energy 111: 644-651. CALDAS ED, COELHO R, SOUZA LCKR AND SIBA SC. 1999.
Organochlorine pesticides in water, sediment, and fish of Paranoá Lake of Brasilia, Brazil. Bull Environl Contam Toxicol 62: 199-206.
CAMPOS JR. 2013. EUA avaliam reserva de gás de xisto em três rios brasileiros. Rev Val Econom, published at 11th June 2013.
CARBO L, SOUZA V, DORES EFGC AND RIBEIRO ML. 2008.
CARNEIRO FF, PIGNATI W, RIGOTTO RM, AUGUSTO LGS,
RIZOLLO A, MULLER NM, ALEXANDRE VP, FRIEDRICH K
AND MELLO MSC. 2012. Dossiê ABRASCO: Um alerta sobre os impactos dos agrotóxicos na saúde. Rio de Janeiro: ABRASCO, 1a Parte, 98 p.
CARR MKV AND KNOX JW. 2011. The water relations and irrigation requirements of sugar cane (Saccharum
officinarum): a review. Expl Agric 47: 1-25.
CATUCHI TA, GUIDORIZZI FVC, GUIDORIZI KA, BARBOSA
AM AND SOUSA GM. 2012. Respostas fisiológicas de
cultivares de soja à adubação potássica sob diferentes regimes hídricos. Pesq Agropec Bras 47: 519-527. CHANG Y, HUANG R, RIES RJ AND MASANET E. 2014.
Shale-to-well energy use and air pollutant emissions of shale gas production in China. Appl Energy125: 147-157.
CHAVEZ-RODRIGUEZ MF, MOSQUEIRA-SALAZAR KJ, ENSINAS
AV AND NEBRA SA. 2013. Water reuse and recycling according to stream qualities in sugar–ethanol plants. Energy Sustain Develop 17: 546-554.
CHAVEZ-RODRIGUEZ MF AND NEBRA SA. 2010. Assessing GHG emissions, ecological footprint, and water linkage for different fuels. Environ Sci Technol 44: 9252-9257. CONAB - COMPANHIA NACIONAL DE ABASTECIMENTO. 2014a.
Acompanhamento da safra brasileira de cana de açúcar – Safra 2014/2015. v. 1, Brasília: Conab, 27 p.
CONAB - COMPANHIA NACIONAL DE ABASTECIMENTO. 2014b.
Acompanhamento da safra brasileira de grãos – Safra 2014. v. 1, Brasília: Conab, 89 p.
DALE AT, KHANN V, VIDIC RD AND BILEC MM. 2013. Process based life-cycle assessment of Natural gas from the Marcellus Shale. Environ Sci Technol 47: 5459-5466. DA ROCHA GO, DE ANDRADE JB, GUARIEIRO ALN, GUARIEIRO
LLN AND RAMOS LP. 2013. Química sem fronteiras: o desafio da energia. Quim Nova 36: 1540-1551.
DELUCCHI MA. 2010. Impacts of biofuels on climate change, water use, and land use. Ann New York Acad Sci 1195: 28-45. DENATRAN - DEPARTAMENTO NACIONAL DE TRÂNSITO. 2014.
Frota de veículos. Available on http://www.denatran.gov. br/index.htm, access at 04th August 2014.
DILON C. 2009. How far will energy go? An Energy density comparison. Available on http://www.cleanenergyinsight,org/ interesting/how-far-will-your-energy-go-an-energy-density-comparison/, accessed at 13th July 2014.
DOMINGUEZ-FAUS R, FOLBERTH C, LIU J, JAFFE AM AND
ALVAREZ PJJ. 2013. Climate change would increase the water intensity of irrigated corn ethanol. Environ Sci Technol 47: 6030-6037.
DOMINGUEZ-FAUS R, POWERS SE, BURKEN JG AND ALVAREZ
PJ. 2009. The water footprint of biofuels: A drink or drive issue? Environ Sci Technol Feat 43: 3005-3010.
DORES EFGC, NAVICKIENE S, CUNHA MLF, CARBO L, RIBEIRO
ML AND DE-LAMONICA-FREIRE EM. 2006. Multiresidue determination of herbicides in environmental waters from Primavera do Leste Region (Middle West of Brazil) by SPE-GC-NPD. J Braz Chem Soc 17: 866-873.
EIA - ENERGY INTERNATIONAL AGENCY. 2012. World Energy Outlook 2012. EIA, France, 690 p.
EIA - ENERGY INTERNATIONAL AGENCY. 2013. World Energy Outlook 2013. EIA, France, 708 p.
ELERT G. 2005. The physics factbook. Available on http:// hypertextbook.com/facts/index-topics.shtml, accessed at 13th July 2014.
ESTRELLA G, DE ALMEIDA A, PINTO A, BRANCO J, FILHO J AND
DE AZEVEDO R. 2011. Doha Meeting. Energy solutions for all. Doha: Qatar.
FAO - FOOD AND AGRICULTURE ORGANIZATION OF THE UNITED
NATIONS. 2010. Biodiversity for Food and Agriculture. Contributing to food security and sustainability in a changing world. Rome: FAO, 66 p.
FAO - FOOD AND AGRICULTURE ORGANIZATION OF THE UNITED
NATIONS. 2012. World Agriculture towards 2030/2050: the 2012 revision. ESA Working paper No. 12-03. Global perspective team: Alexandratos N. and Bruinsma J: World food and agriculture. Rome: FAO, 154 p.
FAO - FOOD AND AGRICULTURE ORGANIZATION OF THE UNITED
NATIONS. 2013. Sustainability dimensions. In: FAO. Statistical Yearbook 2013: World food and agriculture. Rome: FAO, 307 p.
FAOSTAT - FOOD AND AGRICULTURE ORGANIZATION OF THE
UNITED NATIONS. 2014. The Statistics Division of the FAO. Available on http://faostat.fao.org/, accessed at 15th July 2014.
FILIZOLA HF, FERRACINI VL, SANS LMA, GOMES MAF AND
FERREIRA CJA. 2002. Monitoramento e avaliação do risco
de contaminação por pesticidas em água superficial e subterrânea na região de Guaíra. Pesq Agrop Brasil 37: 659-667.
FU B, WANG YK, XU P, YAN K AND LI M. 2014. Value of ecosystem hydropower service and its impact on the payment for ecosystem services. Sci Tot Environ 472: 338-346.
GALEMBECK F. 2010. Synergy in food, fuels and materials production from biomass. Energy Environ Sci 3: 393-399. GERBENS-LEENES PW, HOEKSTRA AY AND VAN DER MEER
TH. 2009a. The water footprint of energy from biomass: A quantitative assessment and consequences of an increasing share of bio-energy in energy supply. Ecolog Econom 68: 1052-1060.
GERBENS-LEENES PW, VAN LIENDEN AR, HOEKSTRA AY AND
VAN DER MEER TH. 2012. Biofuel scenarios in a water perspective: the global blue and green water footprint of road transport in 2030. Global Environ Change 22: 764-775. GERBENS-LEENES W, HOEKSTRA AY AND VAN DER MEER TH.
2009b. The water footprint of bioenergy. Proc Natl Acad Sci 106: 10219-10223.
GRUBERT EA, BEACH FC AND WEBBER ME. 2012. Can switching fuels save water? A life cycle quantification of freshwater consumption for Texas coal- and natural gas-fired electricity. Environ Res Lett 7: 1-11.
HADDAD MS. 2011. Capacity choice and water management in hydroelectricity systems. Energy Econom 33: 168-177. HADIAN S AND MADANI K. 2013. The water demand of energy: