MASTERS IN FINANCE
E
QUITY
R
ESEARCH
FTTH/HFC network – NOS has 3.6 million homes passed with FTTH and HFC technology. MEO and Vodafone have 2.2 and 2 million, respectively. The European Commission ordered MEO to share with Vodafone its FTTH network in non-competitive areas. This deal can be used to encourage a share agreement between the operators which will reduced the levels of CAPEX (25% of it is related with network expansion) and probably it will increase the EBITDA margins due to a more efficient use of the networks. Increasing on market shares – MEO has been losing market share across all sub-segments. For instance, in the 4P bundles, MEO’s market share decreased 22 pp, which were gained by NOS (that has 86% on this segment). On the mobile segment, NOS’ market share increased 10 pp (to 26%) on the past 6 years, while Vodafone lost 6 pp (to a 29% market share).
ZAP’s potential – It acquires the exclusivity to broadcast Globo in Angola (this is the second largest market for Globo) and it aims to expand the FTTH network until 2020. Angola is an important road to overcome the future Portuguese market stagnation. With the population growing around 3% per year and with low penetration rates (below 70% of households).
Dominance on the Audiovisuals – Portugal aside with Finland were the European countries where the number of cinema spectators grew more between 2014 and 2015 (20%). NOS has a market share of 75% and it owns 40% of the theatres in Portugal. Company description:
NOS is a Telecommunications company that provides mobile, fixed voice, internet, TV and convergent services. It also operates on the Audiovisuals market where it is leader. Moreover, it holds operations of the same type in Angola and more recently, in Mozambique.
NOS
SGPS
C
OMPANY
R
EPORT
T
ELECOMMUNICATIONS
5
THJ
ANUARY2017
S
TUDENT
:
N
ELSON
A
ZEVEDO
20489@novasbe.pt
A New Season Begins
Recommendation: BUYWith an upside of 18%
Price Target FY17: 6.50 € Including dividends
Price (as of 5-Jan-17) 5.51 €
52-week range (€) 5.19 – 7.25 Market Cap (€m) 2,840 Outstanding Shares (m) 512.13 Source Bloomberg Source: Bloomberg (Values in € millions,
excluding ratios) 2015 2016E 2017E Revenues 1,444 1,569 1,582
EBITDA 530 544 569
Net Profit 80 104 169
EPS 0.15 0.20 0.33
EV/EBITDA 9.0 8.7 8.5 Source: NOVA Sbe Research
NOSSGPS COMPANY REPORT
Table of Contents
EXECUTIVE SUMMARY ... 3
VALUATION ... 4
COMPANY OVERVIEW ... 4
History ... 4 Business Units ... 5 o Telco ... 6 o Audiovisuals ... 8 Shareholder’s Structure ... 8THE SECTOR ... 9
Telco – Market overview ... 9
Telco – The Competitors ... 11
Telco – Market Shares ... 12
Audiovisuals - Market Overview ... 14
Audiovisuals - Market Shares ... 14
COMPARABLES ...15
ASSUMPTIONS ...17
WACC for the Portuguese businesses’ segments ... 17
Telco ... 19
o Financial Forecasts... 19
o Terminal Value and FCF map ... 20
Audiovisuals ... 21
o Financial Forecasts... 21
o Terminal Value and FCF map ... 22
ZAP ... 23
o Angola - Overview ... 23
o ZAP and its Competitors ... 23
o Assumptions ... 24
o WACC ... 25
o Scenarios ... 26
o Impact on Share Price ... 28
Sport TV – General Assumptions ... 29
Net Debt ... 30
SENSITIVITY ANALYSIS ...30
APPENDIX ...31
NOSSGPS COMPANY REPORT
Executive summary
The merge allow NOS to benefit from some synergies (estimated in €800 m). The EBITDA margin increased to around 37% (Optimus’ was 34% and ZON’s was 36%). Before the merge, the markets were the following: Optimus had a market share of around 15% in 2013, while MEO was leader (and still is) with a market share of 45%. Vodafone, at its turn, was the runner up, with a market share of almost 40%. On the other hand, ZON was the leader of TV + internet bundle with 60%. However, the higher penetration rates did not allowed ZON or Optimus to grow anymore. Therefore, the Optimus/ZON merge allowed NOS to take advantage from the higher penetration rates and market share of ZON, by giving it the opportunity to add one or two services to the existing ZON’s bundles (the mobile and/or the fixed voice from Optimus). This strategy increased NOS’ market share on the mobile services in 10 pp, between 2013 and 2015, while in the bundles market, its market share increased 25 pp and 5 pp on 4P and 5P bundles sub-segment, respectively.
In Portugal the telco’s penetration rates are high, which means it will not be easy for any operator to increase its market share by increasing the customer base. Consequently, to overtake this upper limit, Telco companies are now including upgrades on their services (e.g. Vodafone has a super speed internet as an upgrade to its bundles; NOS has the UMA TV service as upgrade for its regular TV system), and extra products/services as well (e.g. Vodafone are including a projector for more €7.5/month; NOS is now offering an NPlay (VOD system with access to TV shows) subscription for €7.5/month) for the customers that already have their services. Thus, and since this is a very dynamic market I do not expect the Telco market to lose weight on Portugal’s GDP, and therefore I expected a perpetual growth in line with the GDP growth forecasts (above 1%). NOS, also has another potential way to grow which is in Angola, through its participation of 30% in ZAP. Angola’s population is growing fast, around 3% annually, and the penetration rates for telco services are low, especially outside Luanda. The aggressive strategy adopted by ZAP of acquiring several exclusive contents that please the Angolans also works as an accelerator to gain market share quickly. In 4 years, it gained more than 1 million subscribers.
In conclusion, my price target for NOS is €6.50 (including a dividend payment of €0.19/per share in 2017) with a recommendation to BUY. The consensus is around €6.70 and the recommendation varies between NEUTRAL to BUY. The investor must follow the news about the intention of Altice to acquire Media Capital, that owns TVI. Miguel Almeida, NOS’ CEO, already states if this happens “there will be war” - perhaps by buying Impresa (that owns SIC) (?).
NOSSGPS COMPANY REPORT
Valuation
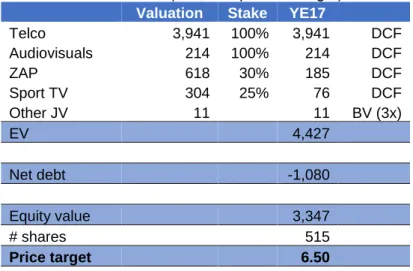
To value NOS’ equity I used the Sum-of-Parts (SoP) method. Thus, I valued the different NOS business units separately: the telco segment, the Audiovisuals segment, the 30% stake in ZAP and the 25% stake in Sport TV were valued through the Discounted Cash Flow (DCF) approach; other minorities, due to their minimum impact on the Group’s overall results, were valued through their Book-value times a market multiple. From this procedure I obtained a 2017 year-end target price of €6.50 (which includes a dividend to be paid in 2017 of €0.20/per share), which reflects an 18% upside considering the close price of €5.51 registered in 5th January of 2017. Hence Sum-Of-Parts were the following:
Table 1 - Sum-Of-Parts (€ m, except Price Target)
Valuation Stake YE17
Telco 3,941 100% 3,941 DCF Audiovisuals 214 100% 214 DCF ZAP 618 30% 185 DCF Sport TV 304 25% 76 DCF Other JV 11 11 BV (3x) EV 4,427 Net debt -1,080 Equity value 3,347 # shares 515 Price target 6.50
Source: NOVA Sbe Research
Company overview
NOS is one of the most relevant telecommunications company that operates in Portugal, Angola and Mozambique (through participation in local companies), offering mobile, broadband and fixed voice services and Pay-TV. They also play a major role in the production, distribution and exhibition of movie/TV contents through NOS Audiovisuals.
History
NOS results from the merge of Optimus and ZON Multimedia. Optimus was the first Portuguese operator to fully integrate all the services. In 2008 ZON Multimedia was created (until this point TV Cabo dominated the Pay-TV and broadband market). In 2010, With all the know-how and experience in the sector (that had been built since 1999, when it was TV Cabo) ZON Multimedia started its international expansion, establishing the joint-venture ZAP in Angola, for the
NOSSGPS COMPANY REPORT
supply of satellite TV. Then, in 2013, Optimus and ZON Multimedia decided to merge, hatching NOS.
Business Units
NOS business can be divided into two segments, Telco and Audiovisuals. Telco will include everything related with Pay-TV, broadband, fixed and mobile services that are offered in Portugal. On the other hand, Audiovisuals will include all the operations related with the cinema exhibition, distribution and production of contents, and broadcast rights (mainly due to the Video-On-Demand (VOD)). As shown on the Graph 1, Telco has been accounting for around 90% of total revenues, on average since 2013. When we assess their weight on NOS’ EBITDA, Telco contributed with 91% in 2015. However the Audiovisuals’ EBITDA margin, tends to be higher than Telco’s (42% vs. 35%, in 2015) which means a Group’s margin of 37%. As we can see, NOS’ revenues and EBITDA relies heavily on the performance of the Telco unit. The merge between ZON and Optimus allowed some synergies that were estimated to be around €80 m/year. Which were related with savings on operational costs and investments in the following areas: 26% in network investments and maintenance; 24% in IT; 20% in FTTH (Fiber-to-the-Home) migration; 16% in corporate centre; 6% in contents; 4% in clients area; and 4% in operations and logistics. At this point, only the projects related with IT which demand higher investments and are at long-term, did not benefit from any synergy. On what operational costs concerns, we can see some effect of these synergies since the EBITDA margin of Optimus and ZON was 34% and 36%, respectively, and the EBITDA margin of NOS is now 37%, which reflects an improvement of at least 1 pp.
Looking to the profitability and the dimension of NOS compared with the main competitors we conclude the following: NOS, in 2015, increased its revenues by 4.4% to €1,400 m, having an EBITDA margin of 37% that lead to a net income of around €80 m. Thus NOS’ Return-On-Equity (ROE) was around 7.8%, and its market capitalization is about €2,500 m. Vodafone Portugal, being a subsidiary of Vodafone Europe and Vodafone Group (making impossible to invest directly on it) registered revenues of €975 m (- 0.5% YoY). Its EBITDA margin has been decreasing since 2012 from 33% to 29% in 2015, this could be a consequence of the low-cost strategy adopted by Vodafone Portugal on the bundled services. With a net income of about €30 m, its ROE stood at 10.7%. MEO is also a subsidiary owned entirely by Altice, a multi-national telecommunications company with operations in Western Europe, Indian ocean region and Dominican republic, that has a market capitalization of €23,000 m. MEO had revenues of €2,300 m in 2015 which represented a decrease of 7.3%. When Altice took over Graph 1 - Revenues
by business unit (€ m)
Graph 2 - EBITDA by business unit (€ m)
NOSSGPS COMPANY REPORT
the management it announced a cut on the operational costs, in order to solve MEO’s financial problems, thus in 2015 its EBITDA margin was 48% (+ 10 pp YoY), while Altice’s margin stood in line with the market, 38%.
o Telco
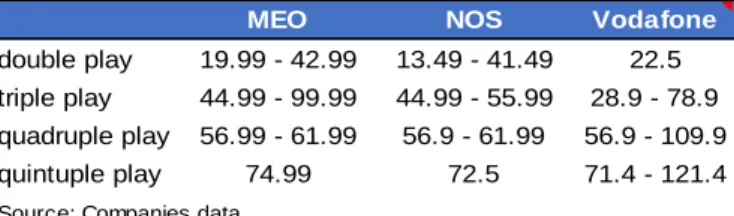
Currently, the bundled services are the main service provided by this business unit. The Portuguese market offers four types of bundled services: the double Play (2P) bundle that normally offers TV and fixed voice or internet access; the triple play (3P) bundle which offers TV, fixed voice and internet access; the quadruple play (4P) that usually offers the 3P pack plus one SIM card (mobile); and the quintuple play (5P), the most complete bundle that offers the 4P bundle plus mobile internet. Along with NOS, MEO and Vodafone are the other two main competitors operating with these kind of service.
Starting on the 2P bundle, NOS has “NOS 2” (TV + internet or fixed voice) where the price can go from €13,49/month up to €41,49/month depending on the TV access type (Fiber or Satellite), variety of channels available (can go from 4 to 105 channels), if the second service is Fixed voice or Internet access, and lastly which loyalty contract the client is willing to sign (the longer the agreement is, the cheaper it is). MEO, on the other hand presents a broader 2P bundles portfolio, since it offers three different services’ combinations (TV + internet; TV + fixed voice; internet + fixed voice). The two most expensive MEO’s 2P services, offer 50 more channels than NOS similar bundles, as well as 3 free months of Premium channels and €30 on VOD services. Despite this, the price range is slightly higher than NOS’, but the type of services and conditions are basically the same. Vodafone offers a 2P pack that includes Internet and Fixed voice for €22.5 a month.
MEO NOS Vodafone
double play 19.99 - 42.99 13.49 - 41.49 22.5 triple play 44.99 - 99.99 44.99 - 55.99 28.9 - 78.9 quadruple play 56.99 - 61.99 56.9 - 61.99 56.9 - 109.9 quintuple play 74.99 72.5 71.4 - 121.4
Table 2 - Price range for Bundled services (€/month)
Source: Companies data
In terms of 3P bundled services, NOS has the “NOS 3” (TV + internet + fixed voice). The price varies between €42.99/month and €55.99/month according to the features required by the client, namely internet speed, channels available, TV service (Iris or UMA) and the length of the loyalty agreement. Again, MEO offers an identical pack of services with the same extraordinary offers as for the 2P packs (Premium channels and €30 on VOD), with the exception that the most expensive bundled service which costs €99.99, offers 400/100 Mbps Internet
NOSSGPS COMPANY REPORT
speed (twice as faster that NOS) and access to 200 channels. Vodafone is the most recent player on this 3P bundles market, and it differentiated itself from the competition by offering the same type of services, with a special focus on the quality and speed of the internet with a price of 60% of its competitors. Currently, Vodafone provides an upgrade for this base pack with a 1Gbps/100Mbps Internet speed (the fastest in the Portugal) that costs €78.9.
Regarding the 4P pack, NOS has “NOS 4” (UMA TV + Internet +Fixed voice + SIM card) and the price range is justified by the same reasons pointed above and the number of SIM cards wanted by the client. For this bundle, MEO offers the same services (on average, it offers access to more TV channels) for the same price. There is no significant differences, excluding the offers with the Premium channels and VOD. Regarding Vodafone, it is in line with competition, since it offers 3 4P bundled services, with the exception that the most expensive one costs €109.9, due to the 1Gps/100Mbps internet speed.
Lastly, for the quintuple play service. NOS has “NOS 5”, which is the “NOS 4” pack plus mobile Internet, up to 7 Gb. The same applies to MEO that offers a 5P pack for €74.99, more expensive than NOS’ bundle but with higher Internet speed and access to more TV channels. Vodafone offers this pack (identical to MEO’s) for the lower price €71.4, and to enjoy the super-speed internet the customer has to pay €121.4/month.
As shown, NOS presents a large bundled services portfolio that is capable to cover all the potential customers by taking into consideration what type of service each customer prioritize and his purchasing power. No doubt Vodafone is the player that provides the same pack of services for the lower prices, but its network do not cover the entire country at this point, and the low-cost strategy is only meaningful on the 3P bundle. The biggest strength of NOS is its Pay-TV system. In June of 2016 NOS launched UMA, the new system that comes to update Iris, which is a superior system compared with MEO’s or Vodafone’s. Customers value this type of innovative products which is reflected in the increase of 16% YoY on the total number of subscribers of these services, from 0.83 to 0.93 million. On the other hand MEO’s biggest strength is its cable and fiber network. In 2002 MEO has bought the fixed network in Portugal for €365 m, and currently reaches 4.8 million homes, of which 2.4 million are cable and the remaining 2.4 million are FTTH (there is a share agreement of this network with Vodafone, that was not being fulfilled). The European Commission already requested ANACOM to force MEO to share this network in non-competitive areas, such as rural areas). Due to years of dominance, back when MEO was a public entity, nowadays only 20% of the operational costs are related with network operations.
NOSSGPS COMPANY REPORT
On what operational indicators concern, at the third quarter of 2016, NOS registered a growth of 8% YoY on the RGUs Total to 8 million. Contributing to this growth were increases of around 12% and 11% YoY, on the number of broadband and multiple play services subscribers, respectively. However, the information about the net additions, reveal a more pessimistic scenario, they were highly negative (more people are leaving the service). The high penetration levels make no room to the subscribers base to grow. For instance, the number of homes passed decreased 47% YoY on the 3Q16, while the RGUs decreased 21% YoY. As exposed in the Graph 3 the company’s Telco revenues has grown at a CAGR of 25% between 2012 and 2015. The EBITDA margin however, has been reduced from 39% in 2012 to 35% last year (probably due to the progressive FTTH network expansion).
o Audiovisuals
NOS has a 73% market share, which shows a clear dominance. During the third quarter of 2016, NOS cinemas sold around 2.5 million tickets with an average revenue per ticket of €4.7. However this represents a decrease of 0.5% and an increase of 2% YoY on the number of tickets sold and on the revenue per ticket, respectively. Nevertheless the same items registered an increase of 55% and a flat growth QoQ, respectively. This is due to the fact this segment presents some seasonal effect by having better results on the third quarters of every year. In terms of screens (NOS has 215 across the country), NOS launched 2 4DX movie theatres, one in Oporto and the other in Lisbon. This technology gives the spectator a new experience by having moving chairs that replicates movements such as acceleration and inclination, and systems that reproduce wind, rain and even aromas. The NOS Audiovisuals that contemplates the Video-On-Demand also registered an increase of 1% YoY in the third quarter in the number of subscribers (43% of these subscribers are in Africa). The revenues of this segment were declining since the third quarter of 2015, but one year after it registered a strong growth of 10% YoY. This situation can be explained by the season effect, the release of the 2 new 4DX rooms and by the fact that NOS distributed 9 of the Top 10 movies in this quarter. Lastly the EBITDA margin was 42% in last year, a very robust margin that has been increasing since 2013.
Shareholder’s Structure
As we can see on Graph 5, the main shareholder is ZOPT that holds 52.14%. This is a qualified holding that was created by Mrs. Isabel dos Santos (that had 28% of ZON) and Sonaecom (that owned 100% of Optimus) when both parties agreed on the merge. Therefore, the control on ZOPT is divided equally between its shareholders, 50% are hold by Mrs. Isabel dos Santos, while the other 50%
NOSSGPS COMPANY REPORT
are owned by Sonaecom. The second biggest shareholder is Banco BPI with a 2.77% stake, followed by Norges Bank with a participation of 2.11%. The remaining 40.97% stake is free float for small and medium investors, with below 2% stakes. Recently there was not any significant changes in NOS’ shareholders structure.
The Sector
Telco – Market overview
The Telco segment can be divided into five sub-segments, which are mobile, fixed voice, internet, subscribed TV and bundled services.
Fixed voice is the most “outdated” service provided by this market, however as we can see on Graph 6, the number of subscribers of this service, in Portugal, did not change too much between 2002 and the second quarter of 2016. However, due to the introduction of the bundled services, which in most cases include fixed voice services, the number of subscribers have increased to almost 4 million subscribers, in June 2016. On the other hand, the number of mobile services subscribers almost double between 2002 and 2015. In 2002 there were nearly 10 million mobile subscribers. This number has increased since then, reaching its peak in 2010, when there were 20 million mobile services subscribers. Probably due to the introduction of smartphones that brought new ways of communication, and to the new payments plans that eliminated the costs of communication with people from another operator.
In terms of internet subscribers, as expected the number increases every year. Nowadays internet is used by everyone and for everything. In Portugal, until 2007 it only existed internet by fixed access, but with the arrive of mobile access there was a fresh boost on the service subscriptions. Currently, there is around 9 million internet subscribers, which represents a CAGR 07 – 16 of 13%. The internet penetration levels confirm this is a service that is increasingly fast, in around 10 years, the internet by mobile access has reached a penetration level of 55% (vs. 30% for the fixed access). This data shows that more than 85% of Portugal habitants have access to the internet (independently from the type of access), so the market is nearly saturated and only a few potential customers are left to explore. However in Europe, 71% of households have 30 Mbps Internet speed access (which is the common internet speed in Portugal). The European Commission is optimistic with the next 2020 Digital Plan that aims a 100 Mbps internet speed penetration rate of 50% (as a percentage of households) in Graph 6 - Subscribers of
mobile and fixed voice services, in millions
Graph 7 - Subscribers of Internet services, by type of connection, in
millions
Graph 8 - Penetration rate on Internet
NOSSGPS COMPANY REPORT
Europe. It also wants to implement 5G in at least one city on each European country.
The number of TV subscribers increased from around 1.5 million in 2002 to around 3.5 million in the second quarter of 2016. This means that in the second quarter of 2016, around 90% of the Portuguese families had a TV subscription. This service can be provided in several ways, such as by satellite, by FTTH, by cable or others. The satellite TV service is usually more expensive and implies the installation of an antenna, which is not always feasible. The FTTH started being used in 2007, but until 2010 it was too expensive since it demanded considerable investments made by the operators. However this type of connection is the one that allows a better image and sound, and also increases the speed of the internet. Thus, since its inception until today, the “optic fiber” service has been replacing the others connection systems, persuading nearly 25% of the families to adopt this type of connection, and converting approximately 1 million subscribers in the second quarter of 2016. Therefore, my conclusion for this submarket is that is also highly saturated, with a 85% penetration level.
Portugal is in the European Top 10 of countries with higher Pay-TV penetration rate, close to Denmark and Romania with 91% and 92%.. Netherlands is the country in Europe with the highest Pay-TV penetration rate, 98%, followed by Belgium and Norway with 97%. However, when we focus on the FTTH penetration levels the conclusions change a bit. According to FTTH Council Europe and its research partner IDATE, the subscribers of FTTH and FTTB (Fiber-To-The-Building) increased in Europe by 19% in 2015. In terms of household penetration, Portugal is again in the Top 10 with a penetration rate of 18%. The only countries that have a superior FTTH and FTTB territorial coverage are Eastern countries, such as Russia and Romania with 30% and 26% household penetration rate, and the Baltic countries namely Lithuania, Latvia, Sweden with a coverage of 37%, 36% and 35% of households. On the other hand, some of the richest countries such as Germany, Switzerland and France have FTTH + FTTB household penetrations of 0.5%, 5% and 9%, respectively. This shows that the Portuguese Telco companies and subsidiaries are seriously investing on this new technology. For instance Vodafone Portugal has currently 2.2 million homes passed with FTTH, MEO has 2.2 million homes as well, and the European Commission wants MEO to share its network with Vodafone in non-competitive locations (i.e. rural areas). MEO also has the intention to increase the number of homes passed to 5.3 million until 2020. NOS had 3.6 million homes passed in 2015, with FTTH and HFC (Hybrid Fiber Coax). Portugal Graph 9 - Subscribers of TV,
by type of access, in millions
Graph 10 - Penetration rate on Subscribed TV
NOSSGPS COMPANY REPORT
is known as a benchmark on this new technology since the operators are upgrading the network faster than in other European companies.
The most recent services provided by telecom operators are the bundled services. These services have been a great success with an increasingly number of subscribers. In 2011 this service was only formed by double play bundles and never overcame the 0.75 million subscribers mark. In 2014, with the introduction of the new triple, quadruple and quintuple play, the total number of bundled services subscribers went up to around 3.5 million. When we look to the penetration levels of these services, the conclusions are the same, double play bundled services are losing interest and quadruple and quintuple play bundled services are gaining an increasingly number of families. In the second quarter of 2016, 35% of the Portuguese families had a quadruple or quintuple play bundle. This means that families are valuing the benefits and the easiness of having only one operator and one invoice for all of their communication and TV services. With the bundled services the operators can boost their revenues by offering a pack that includes several or all the services they have to offer for a more competitive price, and also gives the operators the possibility to provide upgrades or extra services/products for which it can demand a higher price, and thus overcome the upper limit made by the higher penetration rates.
Telco – The Competitors
Besides NOS, the telecom market has other 2 major players as I mentioned in previous sections (and even a third show up in some sub-segments). These players are Vodafone Portugal, MEO and NOWO (former Cabo Visão).
Vodafone is in Portugal since 1991, and for a few years it was one of the two biggest operators in the mobile services sub-segment, competing with TMN (nowadays is part of MEO). Until some years ago Vodafone Portugal only operated with mobile services, then started selling internet services, and recently started the subscribed TV business. All these aggregated and we have the low cost 3P bundle from Vodafone. The strategy adopted by Vodafone Portugal follows the guidelines made by Vodafone Europe. At the moment Vodafone Portugal has already completed the Project Spring which was basically an expansion of the FTTH network to 2 million houses and companies. For the following years, the goals set by Vodafone Europe are the upgrading of the mobile network, the expansion of the FTTH network (the sharing of MEO’s network is an example of it), a more customised service by giving the customer what they want (a strategy very similar to NOWO’s). The elimination of roaming is also something that an European company such as Vodafone aims to take advantage for, thus the “Internet of Things” initiative started. With this, Vodafone Graph 11 - Subscribers of
Bundled services, in millions
Graph 12 - Penetration rate on Bundled services
NOSSGPS COMPANY REPORT
plans to focus on the development of mobile internet (improvement of the 4G and 5G technology) in order to encourage the international communication through this system instead of the traditional ways that are more expensive.
NOWO brand has been released in September 2016 with the goal to offer freedom of choice to the consumer in a market dominated by bundles. Therefore NOWO provides every services, fixed voice, mobile, subscribed TV and internet services. However it offers a base service of internet (100 Mbps) + TV (33 channels) for €19.99/month, and the client can then add any extra service or upgrade (higher internet speed, more TV channels, fixed voice and/or mobile), without any loyalty agreement. Currently, NOWO has 200,000 clients and 900,000 homes passed with optic fiber. Also NOWO do not have any infrastructure for mobile services, which forces it to rent capacity to MEO.
The ruinous investment on Rio Forte (a Grupo Espírito Santo company) produced a financial hole of €900 m that has led PT (Portugal Telecom) to a segregation into two holdings: PT Portugal, which includes MEO and all the infrastructures, and PT SGPS (known as Pharol) that kept the investment on Rio Forte and the participation in the Brazilian Oi. Banco Espírito Santo (BES) was one of the oldest partners of PT, and it had a 12% stake on PT also. When BES collapsed, the several links between these two entities brought PT down as well. Thus, the French Altice bought PT Portugal in 2014, gaining an important position in the Portuguese market. MEO is the market leader in all the segments. This dominance can be explained by the fact that PT Portugal have been a public entity until 1996, which allowed it to expand its infrastructures and services more easily than its private competitors. In 2002, in a very controversial tender, PT Portugal bought the fixed network in Portugal for €365 m which allowed them to regain an important negotiation power over its competitors. The new management team pointed by Altice, started having a special focus on cost reductions, which explains the higher EBITDA margins when compared to other comparables. Many employees were fired and several departments were merged, for instance the number of directors decreased from 76 to 42. Altice also used its bargain power and send letters to several suppliers, such as Siemens, Ericsson, Visabeira among other medium companies, in order to negotiate a reduction on the supply contracts. However, all this situation negatively affected the notoriety and the quality of service perceived by the consumers, as well as the financial health of the company.
Telco – Market Shares
On the fixed internet, MEO had a 43% market share at 2Q16. However, this market share has evolved negatively by 8 pp (percentage points), between 2013 Graph 13 - Fixed Internet
Source: ANACOM Graph 14 - Fixed Voice
NOSSGPS COMPANY REPORT
and the second quarter of 2016. This loss of market position highlights the deterioration on the service quality perceived by the client that was affected by the successive controversies. NOWO also loss market share by losing almost 2 pp. During this period, other Telco companies, such as NOS and Vodafone took advantage from the MEO’s situation. NOS gained 1 pp on its market share and Vodafone gained a bit more than 9 pp on the same period.
On what fixed voice services concerns, the evolution is similar. While MEO lost 7 pp on its market share, to 45%. NOS and Vodafone gained 2 and 8 pp, respectively, between 2013 and the second quarter of 2016. NOWO also lost 2 pp during this period.
About the mobile sub-segment, MEO did not register any significant changes in its position. In this sub-segment, MEO is also market leader with a 45% market share. The biggest moves on this sub-segment were made by NOS and Vodafone. NOS took directly from Vodafone’s market share 10 pp. Historically, Optimus (before the merge with ZON) was the weakest of the three operators on this sub-segment. After the merge, NOS started to focus on the convergent packs, and started adding the mobile service to the TV + Internet (where ZON was market leader). This lead to significant gains on market share across all the sub-segments, especially on the mobile services.
The convergent products are a recent innovation offered by the operators. In this sub-segment NOS is market leader in the majority of the bundles. The 2P bundle is losing importance, as we saw earlier on the number of subscribers, since the the majority of 2P bundles are formed by TV + fixed voice, and people do not see too much value added on this combination. In fact, only MEO offers TV + internet on 2P bundled, and NOWO are now trying the same. On the 3P bundle, from 2014 and until the second quarter of 2016, NOS, MEO and NOWO lost market share by 3, 5 and 1 pp. On the other hand Vodafone increased its market share by 9 pp, which can be explained by the low-cost pack (almost half of the competitors’ prices) with super speed internet. The 4P bundle is dominated by NOS. On the past 2 years NOS gained 25 pp on its market share, while MEO lost 22 pp. When ZON merged with Optimus, the first step was to create a 4P bundled service where the new NOS was able to take advantage from the ZON’s customer base by adding Optimus products and services to it. Thus, for the people who had the 3P bundle from ZON it was easy and comfortable to add the mobile as well, eliminating the inconvenient from having 2 invoices from 2 different operators. The 5P bundle is the most recent convergent service, on the last 2 years MEO has lost 6 pp, while NOS gained 5 pp. So it is expected to see NOS to approaching MEO in a near future. MEO is leader on this convergent Graph 15 - Mobile Graph 16 - Multiple play bundles Graph 17 - 2P bundles Graph 18 - 3P bundles Graph 19 - 4P bundles Graph 20 - 5P bundles
NOSSGPS COMPANY REPORT
service due to the higher penetration of its mobile services, being easier to add the fifth service that is mobile internet.
Audiovisuals - Market Overview
Over the last few years the revenues decreased, this might be due to the high ticket prices, which are between €7 and €10, and to the easiness of downloading movies on internet. According to MarkMonitor there is on average 55 million infrigements every day related with illegal downloading. In 2014, around 40% of these infrigements were related with illegal donwload of movies. Data also points to Europe as the main region contributing to this problem, being responsible for around 46%. However, Europe has been decreasing this infringement rate, while North and South America has been increasing their particpation to 13% and 11%, respetively. Between 2010 and 2014 this segment suffered its biggest crisis, downing the revenues to less than €65 m in 2014. This sharp decrease demanded an intervention by the operators, in order to offer something new and disruptive to spectators, otherwise revenues would continue to drop. Thus, in 2015 the segment starts its recovery, increasing its revenues to €75 m. For this increase contributed factors such as the implementation of Film Festivals, the number of Film Festivals happening in Portugal every year increase from 19 in 2012 to 27 in 2015, the new technology like IMAX that enhance the spectators experience by providing an ultra HD screen and sound, and partnerships with other entities that aim to cut the ticket price (NOS has a “Buy one, get one free” ticket campaign for its Telco clients.) The launch of a 4D cinema room in the North of the country is an example of the disruptive innovation we are facing in this segment. As shown on the graph 22, the revenues have some seasonality. People go more to the cinema in the summer, July and August, and in December. This can be explained by the free time available, and also by the increase on income that happens in these periods with the vacation and Christmas subsidy payments.
Audiovisuals - Market Shares
The market leader is clearly NOS Audiovisuals, with a market share of 73% in spectators. The second distributor has a market share of 15% and it is the Big Picture 2 Films, where NOS has a 20% participation. The differences between the distributors are brutal, for instance, in 2015 NOS had around 10.6 million spectators for 320 movies, generating gross revenues of €54.9 million according to ICA. The runner-up, Big Picture 2 Films only had 2.2 million spectators for 40 movies, with €11.5 million in gross revenues. These differences are explained by facts such as: the increasing number of screens hold by NOS, currently it has 215 screens across the country, of a total of 547; in 2015 NOS debuted 150 Graph 23 - Market share - 2015
Source: ICA Source: ICA
Graph 21 - Box office (€ m)
Graph 22 - Box office - monthly average(€ m)
NOSSGPS COMPANY REPORT
movies (of a total of 355, in Portugal) and exhibited 320 (of a total of 1,037), while Big Picture 2 Films and Pris Audiovisuais only debuted 29 and 25, and exhibited 40 and 56, respectively; the increasing discounts on ticket prices by having partnerships with other entities such as Millennium BCP, where its clients also benefit from the “Buy one, get on free” campaign. The expectation for the future is that NOS increases its market share since it is the competitor that has better conditions to invest in innovation and screens, and to promote partnerships with other companies in order to lower the prices.
Comparables
It is not easy to find comparable companies for NOS that are operating in identical markets. NOS is a mix of telco, cable, multimedia and Audiovisuals firm. This type of mixed portfolio is not as common as we might think. For instance, Vodafone Portugal, that would be a very good comparable (apart of the lack of Audiovisuals segment) is a subsidiary, and it is not listed. MEO is now controlled by Altice, being a subsidiary as well. To capture in the best way possible, the risks and consequently ratios, I took into consideration telco, cable, Audiovisuals and multimedia companies across developed markets, in order to get an equally weighted blended multiple that hopefully will be the most comparable to NOS. Table 3.1. - NOS comparables analysis - Telco (as of 25th November of 2016)
Company Market
cap P/E EPS EV/EBITDA
Revenues CAGR EBITDA CAGR Dividend yield
Telco € m 2017E 2018E 2017E 2018E 2017E 2018E 17E - 18E 17E - 18E 2017E Telefonica 38,666 10.62 9.44 0.74 0.83 6.20 5.99 1.83% 3.70% 6.54% Orange 36,310 12.74 12.15 1.08 1.13 5.04 4.92 1.06% 2.22% 4.74% Iliad 10,409 21.83 18.45 8.11 9.60 6.35 5.83 4.98% 10.04% 0.32% Swisscom 22,342 15.06 15.10 26.89 26.82 7.31 7.30 0.04% -0.26% 5.09% Deutsche Tel. 68,446 15.48 13.62 0.95 1.08 5.73 5.44 3.13% 4.37% 4.47% Telenor 20,552 11.73 10.95 1.18 1.27 5.28 5.14 0.98% 2.17% 6.34% Vodafone 62,101 34.50 27.60 0.07 0.09 6.67 6.60 -1.58% 0.70% 6.27% Average 17.42 15.33 5.58 5.83 6.08 5.89 1.49% 3.28% 4.82% Median 15.06 13.62 1.08 1.13 6.20 5.83 1.06% 2.22% 5.09%
Thereby, I selected as Telco companies Telefonica, Orange, Iliad, Swisscom, Deutsche Telecom, Telenor and Vodafone. My estimation points to a CAGR on revenues between 2017 and 2018 of 1.4%, and a CAGR on EBITDA of 1.3% for the Telco unit.
As Audiovisuals I included companies that were involved in the cinematographic related businesses such as IMAX Corp, Major Cineplex Group, AMC Entertainment Holdings, Regal Entertainment Group and Cinemark Holdings. On
NOSSGPS COMPANY REPORT
the Audiovisuals segment, my prediction points to a revenues CAGR between 2017 and 2018 of 7.8%, a bit more than the 6.5% market median. However I base this forecast on the historical behaviour plus the initiatives made by NOS and its competitors to give an additional boost to the sector. However, my EBITDA CAGR 17-18 is a bit under with the median market, 8.0%.
Table 3.2. - NOS comparables analysis - Audiovisuals (as of 25th November of 2016)
Company Market
cap P/E EPS EV/EBITDA
Revenues CAGR EBITDA CAGR Dividend yield
Audiovisuals € m 2017E 2018E 2017E 2018E 2017E 2018E 17E - 18E 17E -
18E 2017E IMAX Corp 2,278 27.11 23.40 1.17 1.36 13.15 11.35 10.55% 23.12% 19.67% M. Cineplex 712 20.68 18.13 0.04 0.04 11.65 10.65 11.18% 11.35% 4.16% AMC Entert. 3,218 25.76 21.96 1.28 1.46 8.28 7.93 6.48% 9.66% 2.33% Regal Entert. 3,493 19.20 17.33 1.15 1.27 8.93 8.51 3.39% 6.44% 3.82% Cinemark 4,583 18.02 16.11 2.18 2.43 8.35 7.72 6.49% 8.98% 2.64% Average 22.15 19.39 1.16 1.31 10.07 9.23 7.62% 11.91% 6.52% Median 20.68 18.13 1.17 1.36 8.93 8.51 6.49% 9.66% 3.82%
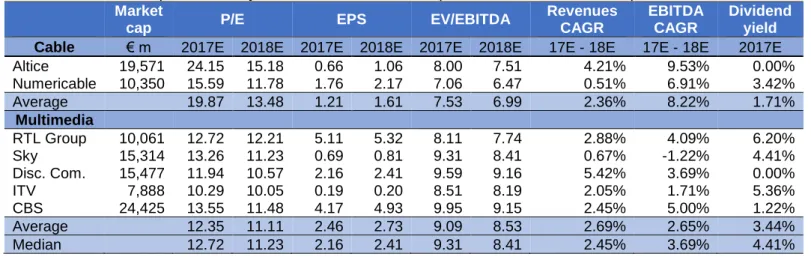
On what concerns cable companies comparables I took into consideration Altice and Numericable. And as Multimedia companies, where I basically included companies which their core business is TV production and distribution of contents such as RTL Group, Sky, Discovery Communications, ITV and CBS. For the Sport TV I obtained a revenues CAGR 16-17 of 2%, in line with the multimedia market. On what EBITDA concerns, my prediction points to a CAGR 16-17 of 1.8%. Since I believe the new low-cost channel might low the EBITDA margin.
Table 3.3. - NOS comparables analysis - Cable and Multimedia (as of 25th November of 2016)
Market
cap P/E EPS EV/EBITDA
Revenues CAGR EBITDA CAGR Dividend yield
Cable € m 2017E 2018E 2017E 2018E 2017E 2018E 17E - 18E 17E - 18E 2017E
Altice 19,571 24.15 15.18 0.66 1.06 8.00 7.51 4.21% 9.53% 0.00% Numericable 10,350 15.59 11.78 1.76 2.17 7.06 6.47 0.51% 6.91% 3.42% Average 19.87 13.48 1.21 1.61 7.53 6.99 2.36% 8.22% 1.71% Multimedia RTL Group 10,061 12.72 12.21 5.11 5.32 8.11 7.74 2.88% 4.09% 6.20% Sky 15,314 13.26 11.23 0.69 0.81 9.31 8.41 0.67% -1.22% 4.41% Disc. Com. 15,477 11.94 10.57 2.16 2.41 9.59 9.16 5.42% 3.69% 0.00% ITV 7,888 10.29 10.05 0.19 0.20 8.51 8.19 2.05% 1.71% 5.36% CBS 24,425 13.55 11.48 4.17 4.93 9.95 9.15 2.45% 5.00% 1.22% Average 12.35 11.11 2.46 2.73 9.09 8.53 2.69% 2.65% 3.44% Median 12.72 11.23 2.16 2.41 9.31 8.41 2.45% 3.69% 4.41%
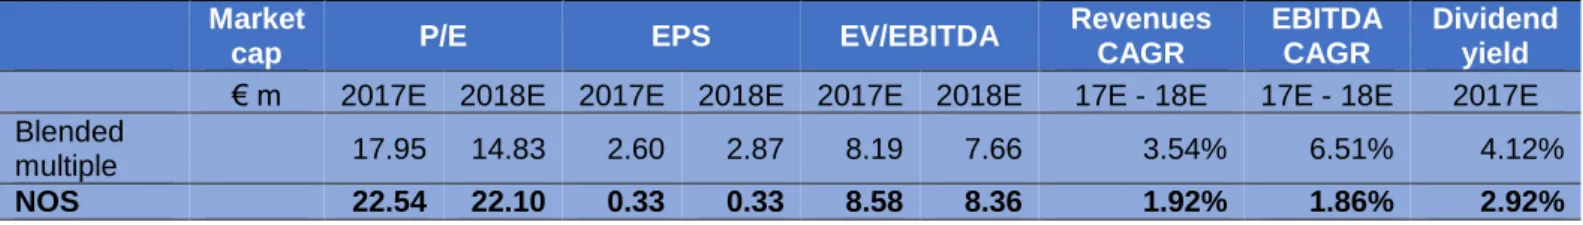
As shown on comparables multiples analysis, NOS trades in line with the average blended multiple of EV/EBITDA. While I expect NOS to be valued 8.5 and 8.4x EBITDA in 2017 and 2018 respectively. However the Revenues and EBITDA CAGR 17 – 18 for NOS is lower than the blended multiple, NOS figures
NOSSGPS COMPANY REPORT
compounded annual growth for that period are 1.92% and 1.65% respectively, while for the blended compositor is 3.54% and 6.51%, which can be explained by the bigger growths on Audiovisuals companies. Because if we compare NOS revenues and EBITDA compounded annual growth with the telco’s this difference become much lower, practically in line. Despite the lack of comparable companies, in the sense that the Portuguese market conditions are not fairly represented by any of these companies, and at the same time none of these firms have similar levels of convergence in its services in comparison to NOS, the Portuguese company is not far from being properly priced.
Table 3.4. - NOS comparables analysis - Blended and NOS (as of 25th November of 2016)
Market
cap P/E EPS EV/EBITDA
Revenues CAGR EBITDA CAGR Dividend yield
€ m 2017E 2018E 2017E 2018E 2017E 2018E 17E - 18E 17E - 18E 2017E Blended
multiple 17.95 14.83 2.60 2.87 8.19 7.66 3.54% 6.51% 4.12%
NOS 22.54 22.10 0.33 0.33 8.58 8.36 1.92% 1.86% 2.92% Source: Bloomberg; NOVA Sbe Research
Assumptions
The business segments that were valued through DCF approach were discounted at the Weighted Average Cost of Capital (WACC). I considered two different WACC rates, one for the Portuguese businesses and other for the Angolan business, ZAP. Overall assumptions taken on the Financial Forecasts will also be explained in this section
WACC for the Portuguese businesses’ segments
For the WACC calculation I needed the market weights of debt and equity, the tax rate, the Cost of Debt that will be explained later on, and the Cost of Equity that was computed by using the Capital Asset Pricing Method (CAPM). This required a proxy for the risk-free rate, the NOS’ Levered Beta and the Market Risk Premium (MRP).
So first, for the risk-free rate, I computed a synthetic risk-free rate where I added the expected inflation rate for the Euro Area (1.57%) to the 10 years German Bund yield of 0,187%, ending up with a risk-free rate proxy of 1.76%. I used this approach in order to overcome the discrepancy between the interest rates on Government bonds and the market value of equities. The interest rates of Government bonds are too low when compared with the equities, and this inconsistency might lead to an overvaluation of the equity by lowering the discount rates.
NOSSGPS COMPANY REPORT
For the Levered Beta, I first considered the major Telco and Audiovisuals companies in the world in order to perform a median of their Unlevered Betas, 0.56. After that, I Levered the Beta considering the Debt-to-equity (D/E) ratio of NOS, which I assumed to be around 30%, under the current market weights of debt and equity and taking into account their evolution for the next 10 years, and the Portuguese income tax, 23%. With all this information I ended up with a Levered Beta for NOS of 0.69. As MRP I applied a 5.75% rate, according to a research made by KPMG Netherlands, where they took into consideration the implied market risk premium for several developed markets in the last 15 years. Therefore I think this would be a very good proxy for MRP. Thereby I obtained a cost of equity of 5.70%.
On what concerns the Cost of Debt, I noticed NOS has few bonds, but all of them were very illiquid since they were not traded very often, and the amount that was issued was very small. The bonds also did not have any rating given by any credit rating agency. So, I chose to estimate the credit rating for NOS through a Moody’s credit rating methodology for telecommunications industry to be able to estimate its Cost of Debt. The rating methodology by Moody’s, for this type of business requires an assessment of several factors such as the scale and business model, the operating environment and the financial strength. The weighted assessment of all these factors has led me to a credit rating of Baa2, two levels above the Portuguese sovereign debt rating (Ba1). However the methodology taken by Moody’s do not take into consideration the fact that more than 90% of the revenues of NOS are produced in Portugal which implies a high exposure to the economic situation of the country and therefore to the country risk that is reflected on the lower sovereign rating. Thus, I weighted the NOS’ Baa2 rating with the Portugal sovereign Ba1 rating which downed NOS’ credit rating to Ba1, one level above Portugal’s. Then I looked up for an average market implied credit spread for this rating, and I ended up with a 2.5% credit spread. Also Moody’s, allied with the rating, provides an historic probability of default and recovery rates taking into account the type of debt. Therefore, for the Ba1 rating I obtained a probability of default of 0.55%1, and a recovery rate for Senior Unsecured bond type of debt of 37.6%1. By adding the risk-free rate to this, I arrived to a cost of debt of 3.91%.
Thus, with a cost of debt of 3.91%, a cost of equity of 5.70% and a D/E of around 30%, I consequently ended up with a WACC of 5.05%.
1 Moody’s Annual Default Study – Corporate Default and Recovery Rates, 1920 - 2015
Table 5 - WACC components
Portugal
Risk free rate 1.76%
Levered Beta 0.69
Market Risk Premium 5.75%
D/EV 20%
E/EV 80%
Cost of Equity 5.70%
Cost of Debt 3.91%
WACC 5.05%
Source: NOVA Sbe Research Table 4 - Unlevered Betas
Company βu Telco Orange 0.42 Iliad 0.66 Swisscom 0.44 Deutsche Telecom 0.41 Telenor 0.56 Vodafone 0.39 Pharol 0.50 NOS 0.60 Median 0.44 Audiovisuals IMAX Corp 1.14
Major Cineplex Group 0.63 AMC Entertainment 0.73 Regal Entertainment 0.55 Cinemark Holdings 0.67 Median 0.67 Cable Altice 0.30 Kabel deutschland 0.47 Numericable 0.37 Median 0.38 Multimedia RTL Group 0.68 Sky 0.45 Discovery Com. 0.71 ITV 0.97 CBS 1.12 Median 0.71 Blended Median 0.56 Source: Bloomberg; NOVA Sbe Research
NOSSGPS COMPANY REPORT
Telco
o Financial Forecasts
In order to forecast the revenues for this NOS’ business unit I used a macro approach. First I decomposed the Telco market into its services, then I projected all the Telco market until 2027 and took into account the historical behaviour as well as some expectations specialists had for the near future. After that, I estimated the evolution of NOS’ market share for each service. This led me to an overall CAGR for revenues of 1.1% between 2016 and 2027. The EBITDA margin I estimated was in line with the historical data provided by the company, 35%. As I believe the cost structure will not suffer significant changes, and since NOS is a major player in this market, with a solid market position there is no signal that this indicator will change considerably. It also has the effect of the synergies that are not entirely fulfilled and therefore it could increase the EBITDA margin. The main operational cost for NOS are the so called Direct costs (which include some variable costs such as costs related with contents acquisitions, telecommunications traffic, advertising, and a fixed cost that is the capacity costs) that account for 32% of revenues. The External services costs account for 13% of revenues, and the maintenance costs and rents are the main contributors for this. Thus, we easily conclude that NOS costs’ structure are formed essentially by variable costs, being the main fixed costs related with rents and telecommunications capacity acquisition. Therefore, due to NOS’ dimension it is easier to benefit from some bargain power that lowers these costs and therefore improve the EBITDA margin.
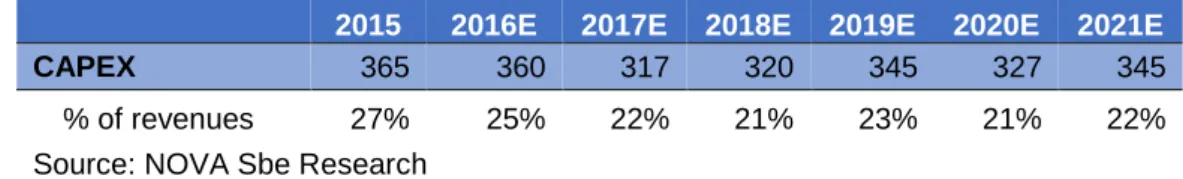
Historically the CAPEX of NOS are related with network expansion, integration, and clients acquisition. In 2013, after the merge, the strategic plan pointed to a recurrent CAPEX between 16 – 18% of revenues, which meant investments of €250 m more less, plus the non-recurrent CAPEX that has been more than €100 m per year. However this target has been overpassed over the last two years by small amounts (€50 m). Today, the Total CAPEX accounts for less than 27% of revenues. My estimation points to a CAPEX between 22% and 25%.
Table 6 - Telco's CAPEX, for the period 2015 - 2021E (€ m)
2015 2016E 2017E 2018E 2019E 2020E 2021E
CAPEX 365 360 317 320 345 327 345
% of revenues 27% 25% 22% 21% 23% 21% 22%
Source: NOVA Sbe Research
NOS already has 3.6 million homes passed with FTTH and HTC technology, so the investment in this network expansion will start slowing down. Plus the
NOSSGPS COMPANY REPORT
decision of the European Commission in forcing MEO to share its FTTH network in non-competitive areas with Vodafone, might encourage conversations to other deals of this kind with other competitors, which has a direct impact on the CAPEX. Historically, the investment made in infrastructure account for a bit more than 25% of the Total CAPEX. The fluctuations on the CAPEX levels are due to the fact that around 55% of Total CAPEX is related with customers’ acquisitions, therefore it is directly related with the evolution of the revenues.
o Terminal Value and FCF map
Concerning the Terminal Value for the Telco segment, I first considered 2027 as the cruise year, and I projected the FCF at what I considered to be the most adequate long-term sustainable growth rate, commonly known as g. The g I have taken into account was 1.2%. So, most of the NOS’ revenues came from the Portuguese market which implies a high dependency on the well-being of the country. If Portugal is affected in any way, either economically or even politically, NOS has an higher probability to suffer the repercussions. Portugal’s growth expectations are very shy, Banco de Portugal expect a GDP growth of 1.5% per year, until 2019, which for a highly levered country and highly dependent on EU might be relatively optimistic. Thus, it is my conviction that a 1.5% GDP growth if assumed as long-term sustainable growth rate could lead to an overestimation of NOS. It is important to take into account that Portugal is a country recovering from a severe crisis, and at the same time the Telco market in Portugal is highly saturated, the penetration levels are very high, as mentioned on the Market Overview section. So this situation leaves no room for growth on the consumer base. The other way to gain new customers is to steal from other Telco companies by dropping the prices (on which Vodafone Portugal is operating quite well), by coming up with very innovative products or by introducing upgrades or extra services and/or products to the existing bundles, which has been made. Thus, I am confident that 1.2% is a fair long-term sustainable growth rate for this segment in Portugal. Consequently, as we can observe on Table 7, I ended up with a perpetual Unlevered FCF of €165 m, where the CAPEX stood at €372 m, which corresponds to 22% of revenues.
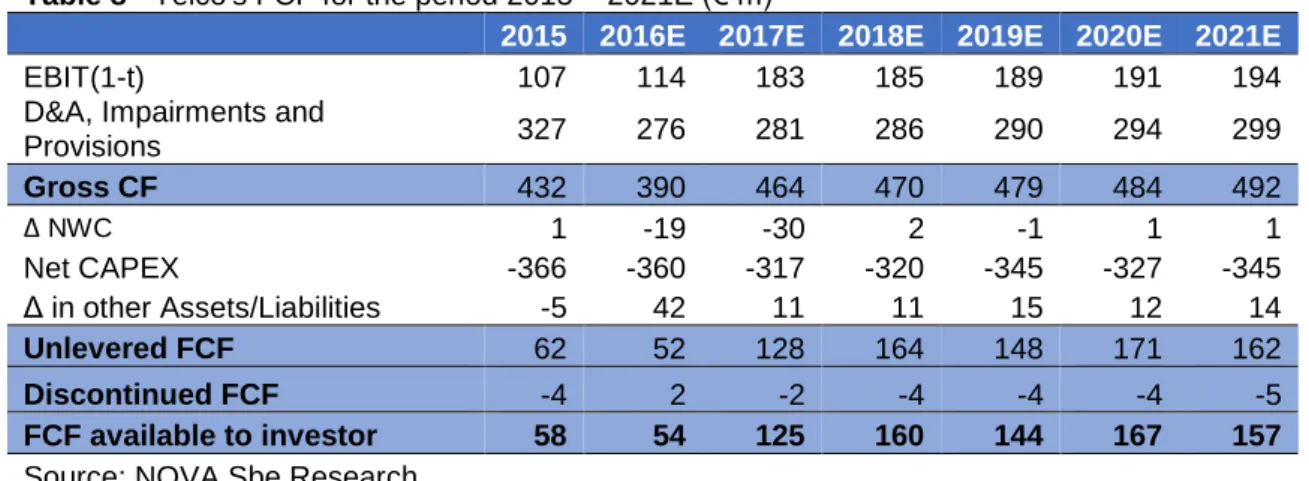
Thus, I am now presenting the FCF map from 2015 to 2021E. I must highlight the fact that the discontinued FCF are composed mainly by other financial costs or gains and changes in Non-operating deferred taxes. The other financial costs/gains are mostly loans commissions.
Table 7 - Terminal Value for the Telco business unit (€ m)
EBIT(1-t) 199 D&A, Impairments and Provisions 319 Gross CF 518 Δ NWC 0 Net CAPEX -372 Δ in other Assets/Liabilities 19 Unlevered FCF 165 Source: NOVA Sbe
NOSSGPS COMPANY REPORT
Audiovisuals
o Financial Forecasts
As I presented on the Market Overview sector on this report, the Audiovisuals’ market has presented some erratic behaviour. This erratic behaviour is mainly caused by the success of the exhibited movies and the income available of the population. To overcome this dependency on the movies quality the new technology such as the 4DX theatres, puts the quality of the movie behind the experience. Thus, in terms of revenues from ticket sales it is my belief that the revenues will increase at a solid rhythm, since the investment in innovative equipment is making cinemas an all new experience. The partnerships with several entities in order to offer discounts to the spectators is also a great contribution. The consumption of VOD is also increasing which contributes to a better performance of this business unit, and NOS with the new TV system, UMA, is clearly going after these VOD clients. Historically the EBITDA margin on this segment is considerable high, above 40%, and in terms of costs, the main item are also the Direct costs that account for 32% of revenues, while the External services account for 7%, with a special focus on rents that are paid for the buildings that host the screens. Marketing and advertising is also a relevant cost, accounting for 7% of revenues, that includes the costs related with the advertising of the movies.
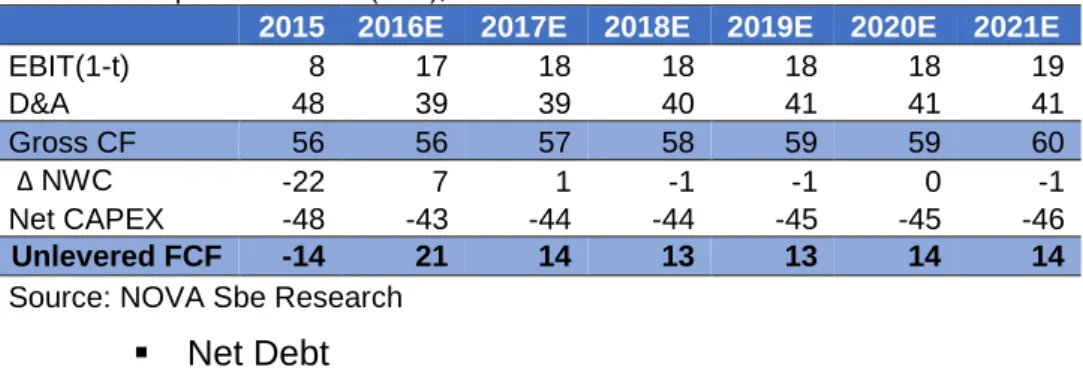
Table 8 - Telco's FCF for the period 2015 – 2021E (€ m)
2015 2016E 2017E 2018E 2019E 2020E 2021E
EBIT(1-t) 107 114 183 185 189 191 194
D&A, Impairments and
Provisions 327 276 281 286 290 294 299 Gross CF 432 390 464 470 479 484 492 Δ NWC 1 -19 -30 2 -1 1 1 Net CAPEX -366 -360 -317 -320 -345 -327 -345 Δ in other Assets/Liabilities -5 42 11 11 15 12 14 Unlevered FCF 62 52 128 164 148 171 162 Discontinued FCF -4 2 -2 -4 -4 -4 -5 FCF available to investor 58 54 125 160 144 167 157 Source: NOVA Sbe Research
Table 9 - Audiovisuals's CAPEX, for the period 2015 - 2021E
2015 2016E 2017E 2018E 2019E 2020E 2021E
CAPEX -41 -37 -43 -44 -45 -48 -50
% revenues 43% 36% 38% 36% 35% 35% 34%
NOSSGPS COMPANY REPORT
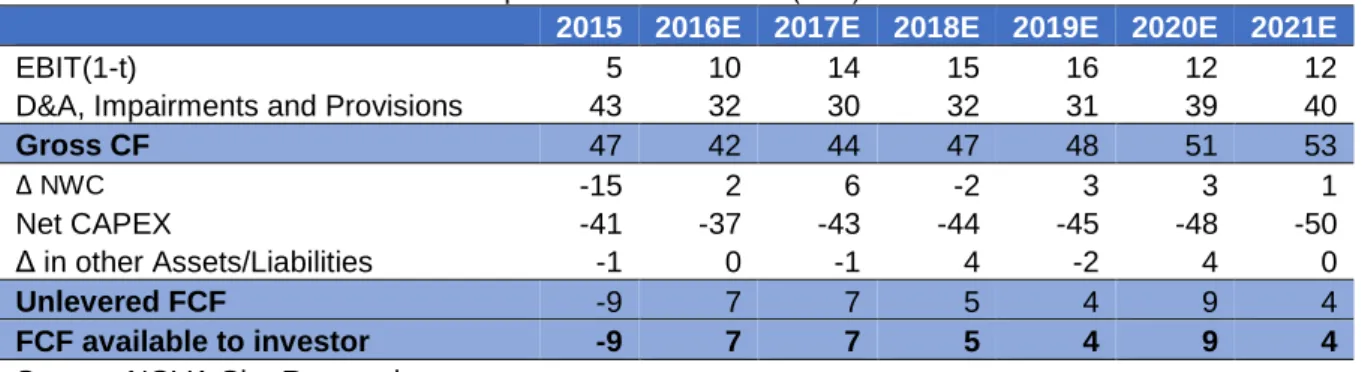
The CAPEX invested in this business unit is related with movies’ copyrights and tends to increase with the number of movies shown. I expect the CAPEX to be around 35% of revenues as I believe most of the investment in new technology will occur on the short/medium term considering the advanced type of technology that is being used or produced.
o Terminal Value and FCF map
Concerning the Terminal Value for this business unit, I first considered the year 2027 as the cruise year. This business unit, as Telco, heavily relies on the Portuguese market, and therefore is exposed to the same issues I mentioned above. However there is a big difference, this activity does not have penetration rates, it will depend on how many and how often people go to theatres, and also on the price of the tickets. The big issue for this sector is the piracy, people are downloading more movies from internet which has a direct impact on VOD and cinema revenues. However Audiovisuals’ companies allied with film producers are developing new technology that change the experience of going to cinema. This joint effort in changing the cinema experience associated with the increasing number of Film Festivals and the tickets discount campaigns, are the base for my belief that this sector has high potential to grow. Thus, I assumed a long-term sustainable growth of 1.5%. As shown on table 10, the perpetual FCF I projected for this business unit is of €10 m, where the CAPEX is of €54 m, which is about 31% of revenues.
Table 11 - Audiovisuals' FCF for the period 2015 – 2021E (€ m)
2015 2016E 2017E 2018E 2019E 2020E 2021E
EBIT(1-t) 5 10 14 15 16 12 12
D&A, Impairments and Provisions 43 32 30 32 31 39 40
Gross CF 47 42 44 47 48 51 53 Δ NWC -15 2 6 -2 3 3 1 Net CAPEX -41 -37 -43 -44 -45 -48 -50 Δ in other Assets/Liabilities -1 0 -1 4 -2 4 0 Unlevered FCF -9 7 7 5 4 9 4 FCF available to investor -9 7 7 5 4 9 4
Source: NOVA Sbe Research
The cash flows available to the investor of this unit are very low. On my perspective, this business unit is useful due to the synergies between Telco and Audiovisuals. This segment is responsible for the movies’ copyrights acquisitions and the production of Portuguese TV and cinematographic contents. After the movies being put available on theatres, they became accessible on the VOD system and on the TV Cine channels, that are provided by the TV box, which can be used to attract more subscribers to bundled services. Also the production Table 10 - Terminal Value for
Audiovisuals business unit (€ m) EBIT(1-t) 19 D&A, Impairments and Provisions 44 Gross CF 63 Δ NWC 1 Net CAPEX -54 Unlevered FCF 10 Source: NOVA Sbe Research
NOSSGPS COMPANY REPORT
of Portuguese TV contents by NOS Audiovisuals allow the use of it on exclusive TV channels. All these can be used to attract more subscribers to the NOS’ bundles, increasing the revenues of this unit.
ZAP
o Angola - Overview
Angola is the main market for ZAP. It is a Sub-Saharan Africa country that in 2015 had a population of 25 million people which represented a growth of 18% since 2010, and a CAGR of around 3%. It is characterized by the massive social inequalities, for instance 70% of the population lives with less than US$2 a day, but at the same time Luanda is one of the most expensive capital cities in the world. The urbanization rate is 44%, since most of the population live in rural areas. The GDP in 2015, stood at US$184 billion, which represented a CAGR 10 – 15 of 5%. However in 2014, the GDP shrunk by 19% due to the oil price crisis. The inflation rate was 10.3% in 2015 and 7.3% in 2014. In terms of telecommunications, Angola is now giving the first steps on the FTTH technology, and most of the TV cable or satellite network covers only Luanda and the surrounded areas.
o ZAP and its Competitors
As previously stated, I valued ZAP separately from NOS. NOS has an indirect 30% stake in the Angolan telecom company ZAP by having 30% of Finstar. The remaining 70% belong to SOCIP (Sociedade de Investimentos e Participações, S.A) that is fully controlled by Mrs. Isabel dos Santos. ZAP initiated its activity in Angola in 2010 and currently is the market leader in Satellite TV in that country. In 2011 it had expanded the business to Mozambique where it rapidly became the market leader in Portuguese and HD contents distribution. In 2014 ZAP improved its portfolio by including optic fiber connection in double play bundles. All in all, ZAP offers Satellite and FTTH TV, where it offers a 2P service of TV + Internet, it produces Portuguese contents and has theatres. In 2014 it had around 1.5 million subscribers. The main competitor is DSTv, which is a partnership between a subsidiary of the South African Multichoice and the Angolan company Jembas. Until 2010, DSTv held the TV subscription monopoly which led to a deterioration of the service, for instance customers pointed out the lack of quality in the service (problems with the TV connection, bad assistance, etc). The Angolan people like and are familiarized with Portuguese or Brazilian TV contents due to the language, therefore the biggest strength of DSTv was to have the Brazilian TV channel Globo and the professional Portuguese Football League broadcast rights. Before ZAP entered in this market it studied very well the
NOSSGPS COMPANY REPORT
market and the potential subscribers in terms of tastes and preferences. Thus, when ZAP entered in this market it first acquired the broadcast rights of the Portuguese football league (which is sponsored by NOS) which immediately built a proximity factor with the potential subscribers. After, ZAP acquired Globo broadcast rights which was a game changer. Angola is the second largest market for Globo therefore this switch from DSTv to ZAP was justified by the fact that ZAP start being recognized as an “Angolan company that talks Portuguese” while DSTv, always more distant from the customers was the “foreign company”. After this acquisition, DSTv remained with the international sport leagues as its main competitive advantage. But, ZAP’s goal of erode DSTv position continued, since ZAP also acquired the broadcast rights of BTV, French football league and NBA (this last divided with DSTv). ZAP also replicated NOS sports strategy by acquiring the broadcast rights of several Girabola’s (Angolan football league) teams, namely the current champion the Recreativo do Libolo. The company is also investing on the first FTTH network in Angola and plans to full cover Luanda until 2020. ZAP now is a company that pleases the Angolans’ preferences which implies a constantly growth on its market share, and it is controlled by Mrs. Isabel dos Santos, which has a big impact in terms of negotiation.
In terms of price, ZAP offers Satellite TV with a price range between 2,000 and 8,000 OAO (Angolan Kwanza) a month (more less €11 - €44) depending on the quantity of channels available. Its FTTH service, which implies a 2P bundled service is priced at 10,900 – 69,900 OAO (in euros, €60 - €380), depending on the TV channels and on the speed of the internet. DSTv provides only TV services for a price range of 1,650 – 13,400 OAO (€9 - €74). There is also a third competitor that only covers Luanda, Benguela and Lobito (but with intentions to expand the network), which is TV Cabo. It currently sells a 3P bundle for 8,100 – 64,900 OAO (or €44 - €350).
o Assumptions
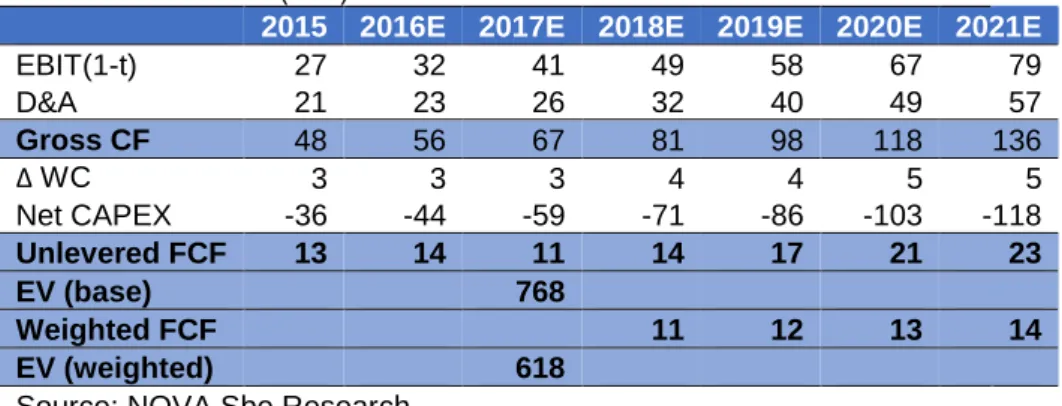
In the 2013 – 2015 period ZAP’s revenues increased by a CAGR of 29%, to €240 m in 2015, while the EBITDA decreased from €75 m to €63 m. Thus the increase in revenues probably indicates a growth on customer base, since this is a company operating in emerging markets where the population tends to grow expressively every year and at the same time the penetration levels are so low that gives margin for telecom companies to expand the simplest services. However the decreasing EBITDA demonstrates that the revenues growth came with a cost, related with the network expansion.
It lacks information about ZAP and about the Angolan telecom market as a whole, which forced me to do several assumptions that I will explained in this