0(14/+0) %+'0%' 1.7/' F 1 E +06'4X EMML
H
H
o
o
w
w
G
G
o
o
o
o
d
d
A
A
r
r
e
e
S
S
t
t
u
u
d
d
e
e
n
n
t
t
s
s
a
a
t
t
A
A
s
s
s
s
e
e
s
s
s
s
i
i
n
n
g
g
t
t
h
h
e
e
Q
Q
u
u
a
a
l
l
i
i
t
t
y
y
o
o
f
f
T
T
h
h
e
e
i
i
r
r
A
A
p
p
p
p
l
l
i
i
c
c
a
a
t
t
i
i
o
o
n
n
s
s
?
?
V.J. Hobbs, T.J McGill,. and H.E Rowe.
Department of Information Technology
Murdoch University
Western Australia 6150
vhobbs@murdoch.edu.au, mcgill@murdoch.edu.au
Abstract
This study investigated the ability of students to assess the quality of applications they developed as part of their course work. Both students and independent expert assessors scored the applications on various dimensions of quality. Students rated all as-pects of their applications more highly than did the experts. Although students and experts agreed in their relative assessments of user-friendliness, a negative correlation existed between student and expert assessments of the reliability dimension. Some implications of these results for teaching are discussed.
Keywords: IS development, IS education, system quality
Introduction
Information technology (IT) graduates are increasingly ex-pected by the IT industry to understand the need for software quality, and processes and practices for achieving it. Crockett, Hall and Jefferies (1993)conducted a survey of information systems managers and found that sensitivity to issues of qual-ity was the issue they ranked most highly. Most academics would agree that we attempt to teach graduates to produce high quality systems--but do we achieve this goal?
Ford (1992) claimed that academia is doing little to produce graduates who are prepared to meet the needs of the software industry. More specifically, Rout (1992) suggested that there is a tendency for academic courses to overlook the issue of product and process metrics for software, which is a major deficiency given that one of the key precepts of quality man-agement is that you can't control what you can't measure.
Most information systems and computer science degree pro-grams include a large project-based course in the final year of the degree. Increasingly, these courses are including the con-cept of a quality process as well as a quality product (e.g. Pierce, 1994). By this stage of their degree, students are
as-sumed to have acquired the necessary analysis, design and development techniques to build a quality system. But while we explicitly teach students systems development techniques, do we also ensure that they acquire skills that enable them to assess the quality of the system that is produced? These are essential skills for any new graduate as without an insight into the quality of the systems they develop, they are unlikely to capitalize on their experience in the workplace and progress as information technology professionals. Rout (1992) recom-mended that students should be shown ways of evaluating the quality of their products, and encouraged to do so.
More generally, assessing one’s own work is an ability that is essential in most professions, but one that is often not ad-dressed in a university education (Biggs & Moore, 1993). Boud (1985) reported that a survey of a large number of graduates ranked evaluating one’s own work as second only to solving problems in a list of skills important to their work. Boud (1985) went on to say that self-assessment “is an im-portant skill which all graduates should possess and which universities do insufficient towards acquiring” (p.1).
This study aimed to investigate students’ ability to assess the quality of their own software. A number of authors have pro-posed different models of software quality, but most agree that a hierarchical definition is needed (e.g. Boehm et al., 1978; Cavano & McCall, 1978). Hierarchical models such as that proposed by Cavano and McCall (1978) view quality as con-sisting of a number of dimensions, which in turn, are com-posed of various criteria. For example, the quality dimension of user-friendliness may include the criteria of ease of use, help features and accessibility.
This study addressed three related questions: First, can we identify particular dimensions of quality in which students perform particularly well or poorly? Second, are students aware of the quality of their own work, either overall or in any of the individual dimensions? And last, if students’ assess-ments of quality differ from those of experts, why is this, and what are the implications for the way we teach information technology?
Method
Subjects
The subjects used in the study were 13 students enrolled in a second year databases course. The students created a database application (using Microsoft Access©), that formed the major component of one of their assignments. The application was based on an ongoing case study that formed the basis for the practical classes in the course. For the assignment, students were required to incorporate additional functionality (involv-ing new tables, reports and forms) into the application. The assignment formed 20% of the overall assessment in the course.
The survey instrument
Application quality can be assessed in a number of ways. The software engineering literature emphasizes direct measures of program quality, such as defects per 1000 lines of code (e.g. Chow, 1985). However, to obtain the students’ own percep-tions of quality in this study, an instrument that facilitated self-assessment was developed.
The questionnaire used was based on the work of Rivard and her colleagues to assess the quality of user developed applica-tions (Rivard, Poirier, Raymond, & Bergeron, 1994). The instrument allows for self-assessment of applications as re-spondents answer a series of simple questions about the appli-cation. The instrument was used to gather student perceptions of the quality of their applications, as well as evaluations of the applications by independent expert assessors. In addition, the questions in Rivard et al.’s instrument are particularly relevant to applications developed in 4GLs or form-based environments and so could be used with only minor adapta-tions for applicaadapta-tions developed in Microsoft Access.©
Rivard et al.’s self-report instrument assesses 8 dimensions of quality: reliability, effectiveness, portability, economy, user-friendliness, understandability, verifiability, and maintainabil-ity (Rivard et al., 1994). Each of these dimensions is further divided into criteria, and several questions address each crite-rion. Four of the dimensions, reliability, portability, user-friendliness and understandability were used in this study. Some dimensions (and some criteria of the dimensions that were used) were not appropriate to the applications under
consideration as they related to aspects of quality that were not expected from the assignment. For example, the assign-ment did not require the students to consider security issues or the compatibility of the application with other systems. Other dimensions and criteria that were not included in the study related to usage of applications in an organizational environ-ment, which would require insight into actual workplace out-comes resulting from use of the application.
The survey contained a total of 34 questions, each scored on a Likert scale of 1 to 7. The questions used are presented in Ap-pendix 1. Minor changes were made to the wording of some of the questions from the originals in Rivard et al. (1994) to reflect the terminology used in the databases course.
Procedure
The purpose of the study was explained to the students and the survey instrument distributed just before the assignment was due to be handed in. Students were asked to assess their applications by completing the instrument after they had fin-ished the assignment, and to return it when they submitted the assignment. Thus, students completed the instrument before they received any feedback on the assignment (either general in nature or specific to their own assignment) that could have influenced their perceptions. There was no incentive for stu-dents to overstate their perceptions of quality as they were told that their responses would not be reviewed until after the course grades had been assigned. In addition, it was stressed that the completion of the survey was voluntary and that it formed no part of their assessment in the course.
To provide the independent expert assessment of the applica-tions, two assessors worked through each of the applications and completed the same instrument. The assessors were the course coordinator and a tutor familiar with application de-velopment in Microsoft Access©. Before assessing the study sample, the assessors completed four pilot evaluations (on applications for which no surveys had been returned) to en-sure consistency between the assessors.
The ratings of the two independent assessors were generally very consistent. The sets of ratings for each application were compared, and were within 2 points of each other for nearly all questions. Where scores for a question differed by more than 2 points the assessors re-examined the application to-gether and reassessed their rating if appropriate.
Results
dimension. An overall application quality measure was ob-tained by averaging the four quality dimension scores.
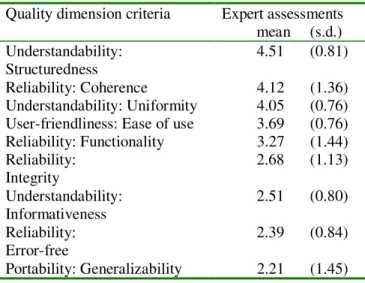
The first research question considered whether there were any quality dimensions on which students performed particularly well or poorly. This question was addressed by comparing the mean scores of the expert assessors for each quality dimen-sion (Table 1) and criterion (Table 2), using analysis of vari-ance. Significant differences existed among the four quality dimensions (F(3,48)=6.61, p=0.001). The experts assessed the applications as best at user-friendliness and understandability, and worst at reliability and portability, although post-hoc tests (Tukey’s HSD) showed that the only significant differences were between portability and understandability (p=0.002) and portability and user-friendliness (p=0.002).
Significant differences also existed among the nine quality criteria (F(8,108)=8.51, p=0.000). It is interesting that the four
criteria for the reliability dimension were widely separated, with coherence rating highly and error-free second worst. Post-hoc tests (Tukey’s HSD) showed that coherence was rated significantly higher than integrity (p=0.024) and error-free (p=0.002). A similar result was obtained for the three
criteria for understandability. Informativeness was rated sig-nificantly lower than uniformity (p=0.001) and structuredness (p=0.000).
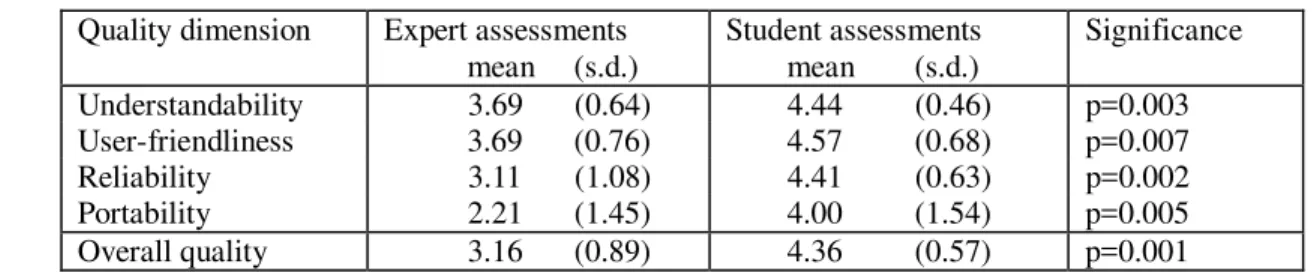
The second research question considered how aware students were of the quality of their work. To address this, two-group multivariate analysis of variance was used to compare expert and student ratings for each quality dimension (Table 3) and criterion (Table 4). Students considered their applications to be of higher quality than did the expert assessors in all quality dimensions measured (F(4,20), p=0.03). Student assessments of quality were significantly different from the expert assess-ment for all quality dimensions (understandability: F(1,23), p=0.003; user-friendliness: F(1,23), p=0.007; reliability: F(1,23), p=0.002; portability: F(1,23), p=0.005).
Students also considered their applications to be of higher quality than did the expert assessors in nearly all the quality criteria measured (F(9,15), p=0.001). Student assessments were significantly higher than expert assessments for coher-ence: F(1,23), p=0.014; uniformity: F(1,23), p=0.016; ease of use: F(1,23), p=0.007; integrity: F(1,23), p=0.028; informa-tiveness: F(1,23), p=0.001; error-free: F(1,23), p=0.000; gen-eralizability: F(1,23), p=0.005). Overall, students and experts ranked quality dimensions and criteria in approximately the same order.
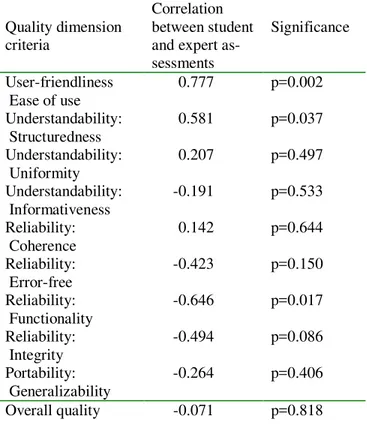
Pearson product-moment correlations were calculated be-tween student and expert assessments of the same application for all quality dimensions (Table 5). There was no significant correlation between student and expert assessment of overall quality. The only quality dimension for which student and expert assessments were significantly positively correlated was user-friendliness (r=0.777, p=0.002). Student and expert assessments of reliability were significantly negatively corre-lated (r=-0.557, p=0.048).The same pattern was seen when the criteria of each dimension were considered individually (Table 6).
Discussion
Quality of student applications
Experts’ ratings of the student applications suggest that dif-ferences exist among quality dimensions and that the applica-tions are more user friendly and understandable than they are reliable or portable. One reason for this may be that students perform better on quality dimensions for which more immedi-ate feedback is available from the development environment. For example, in the Microsoft Access© development envi-ronment it is easy to create forms and reports that are consis-tent and easy to read, and to modify them once created.
The reliability criterion that scored highly, coherence, relates largely to setting up keys and relationships between tables, which Microsoft Access© facilitates through its Relationships
Table 2. Mean scores for expert assessments of
individual criteria of application quality
di-mensions. The scores are listed in order from
best to worst expert assessment.
Quality dimension criteria Expert assessments mean (s.d.) Understandability:
Structuredness
4.51 (0.81)
Reliability: Coherence 4.12 (1.36) Understandability: Uniformity 4.05 (0.76) User-friendliness: Ease of use 3.69 (0.76) Reliability: Functionality 3.27 (1.44) Reliability:
Integrity
2.68 (1.13)
Understandability: Informativeness
2.51 (0.80)
Reliability: Error-free
2.39 (0.84)
Portability: Generalizability 2.21 (1.45)
Table 1. Mean scores for expert
assess-ments of application quality dimensions.
window. For example, students see primary keys as high-lighted in bold, and relationships as connections between ta-bles. Microsoft Access© permits only valid primary key-foreign key relationships to be set, so that students trying to set an incorrect relationship would receive immediate feed-back from the environment. Other reliability criteria, for ex-ample, error-free, required more thorough testing and a deeper understanding of the logic of the application processing. It may be that students come to rely on the help provided by the development environment and neglect to consider these less obvious issues. Freeman (1994) found that IT students did not routinely test all parts of their programs, although they under-stood clearly the importance and methodologies of testing.
Another explanation could be that students do better at what matters more to them. Many students have a limited real world perspective and may never have used an information system on an ongoing basis, or been involved in software support. They may thus be less likely to view reliability or portability as important and hence concentrate on the issues that they can understand more readily.
Are student assessments of quality
consis-tent with experts?
Student assessments of quality were significantly higher than the expert assessments for all quality dimensions. This is per-haps not surprising as experts may be expected to be more critical of an application than students whose experience in
looking at applications is more limited. Students are also less likely to be objective about software in which they have in-vested a great deal of time and effort (Melone, 1990). How-ever, the fact that students ranked quality dimensions and cri-teria in approximately the same order as the experts suggests that the students do have some awareness of the areas of quality in which they are achieving relatively good results.
When the assessments by students and experts for individual applications were compared, no significant correlation was found between student and expert assessment of overall qual-ity. The only quality dimension for which student and expert assessments were significantly positively correlated was user-friendliness. In other words, where experts rated an applica-tion highly on user-friendliness, the student who created it was also likely to rate it highly.
However, the opposite was true for reliability: student and expert assessments of reliability were significantly negatively correlated. In other words, students who designed unreliable applications (from the experts’ point of view) were less likely to be critical of the quality compared with those who de-signed more reliable applications. In the other dimensions of understandability and portability, there was no relationship between student and expert assessments.
The positive relationship found for user-friendliness may sug-gest that students have some intrinsic awareness of what a ‘user friendly’ interface is like from their exposure to a range of graphical user interfaces (GUIs) both in their course work
Table 3. Comparison of student and expert assessments for each quality dimension.
Quality dimension Expert assessments mean (s.d.)
Student assessments mean (s.d.)
Significance
Understandability 3.69 (0.64) 4.44 (0.46) p=0.003 User-friendliness 3.69 (0.76) 4.57 (0.68) p=0.007 Reliability 3.11 (1.08) 4.41 (0.63) p=0.002 Portability 2.21 (1.45) 4.00 (1.54) p=0.005 Overall quality 3.16 (0.89) 4.36 (0.57) p=0.001
Table 4. Comparison of student and expert assessments for each quality criterion. The criteria are listed
in order from most to least significant difference between expert and student assessment.
Quality dimension criteria Expert assessments mean (s.d.)
Student assessments mean (s.d.)
Significance
and recreational use. Students who produced a poor quality user interface could recognize this quality (or lack of) in their own work. However, the results suggest that students are not similarly aware of the deficiencies of their work with respect to the other dimensions, in particular, reliability, in which there was a negative relationship. It may be that students who have at least attempted to address reliability issues are more aware of the limitations of their applications, and hence have assessed them more critically, than students who have not.
To investigate what might influence students’ ability to assess their applications, a series of post-hoc analyses were per-formed to compare quality dimension scores with independent
measures of student ability such as their marks in the final exam and their university entrance scores. While the expert assessments of application quality were positively correlated with these ability measures, no relationships were found among these measures and the student assessments. It does not appear, therefore, that it was only the less able students who were unable to assess the quality of their applications realistically. The small sample size precluded investigating other factors, such as computing background, which may also be expected to have some effect. These issues should be ad-dressed in future research.
Implications for teaching
The aim of the application development project in this course was to get students to implement some of the principles of database design and database application design in a relatively friendly development environment. Students were assumed to have learned the basics of program design and testing in ear-lier courses, and these were not reiterated in the database course, which instead concentrated on database design issues, basic GUI design principles and the Microsoft Access© envi-ronment. However, the results of this study suggest that many of the basic principles of software development (in particular error checking) were not being applied or considered.
Increasingly, it is acknowledged that theconcepts, techniques and practices necessary to achieve quality need to be inte-grated throughout the undergraduate curriculum
(Towhidnejad, 1996). It also seems likely that this integration needs to be made explicit, rather than assuming that students will automatically apply concepts and skills learned in one course to another. Individual courses naturally focus on im-parting the particular skills relevant to that course, but they must also ensure that the relevance of previously acquired skills is understood so that they are transferred and used in the current course.
The study suggested that students’ assessment of their appli-cation quality is unrealistically high. This highlights the need to develop awareness in students of what good or bad appli-cations look like. Students need to be exposed to more exam-ples of existing applications, and to learn to evaluate them, from an early stage in the curriculum. The examples used should cover the range of quality dimensions. In this way stu-dents should become better equipped to judge the good and less adequate points of their own work.
The study also suggested that we should be aware of the sup-port (or otherwise) afforded by the development environment and the possible effect of this on student attitude toward soft-ware development. Attention should be drawn especially to those quality dimensions on which students receive less im-mediate feedback from the development environment and which they thus may be tempted to neglect. On the reverse
Table 6. Correlations between student and
ex-pert assessments for individual criteria of
each quality dimension.
Quality dimension criteria
Correlation between student and expert as-sessments
Significance
User-friendliness Ease of use
0.777 p=0.002
Understandability: Structuredness
0.581 p=0.037
Understandability: Uniformity
0.207 p=0.497
Understandability: Informativeness
-0.191 p=0.533
Reliability: Coherence
0.142 p=0.644
Reliability: Error-free
-0.423 p=0.150
Reliability: Functionality
-0.646 p=0.017
Reliability: Integrity
-0.494 p=0.086
Portability: Generalizability
-0.264 p=0.406
Overall quality -0.071 p=0.818
Table 5. Correlations between student and
ex-pert assessments in each quality dimension.
Quality dimension
Correlations between stu-dent and ex-pert assess-ments
Significance
side, we should not be seduced into thinking that there is no need to make the message explicit just because a lot of help is already provided by the software.
In conclusion, the study has highlighted two main areas that should be addressed. It suggests that basic principles of soft-ware development should be reinforced explicitly throughout the curriculum. In individual courses, where specific skills are learned, students should be exposed to applications covering a wide range of quality so that they are better able to monitor and control the quality of their own work.
References
Biggs, J., & Moore, P. (1993). The Process of Learning. (3 ed.). New York: Prentice Hall.
Boehm, B. W., Brown, J. R., Caspar, H., Lipow, M., Mac-Leod, E. J., & Merritt, M. J. (1978). Characteristics of Soft-ware Quality. Amsterdam: North-Holland.
Boud, D. (1985). Studies in Self-assessment (Occasional Pub-lication 26, UNSW). Kensington: Tertiary Education Re-search Centre.
Cavano, J. P., & McCall, J. A. (1978). A framework for the measurement of software quality. Proceedings of the Software Quality and Assurance Workshop, 133-140.
Chow, T. S. (1985). Software quality: definitions, measure-ments and applications, Tutorial on Software Quality Assur-ance: A Practical Approach (pp. 13-20). Silver Spring, MD: IEEE Computer Society Press.
Crockett, H. D., Hall, G. R., & Jefferies, C. J. (1993). Pre-ferred information systems skills: Are undergraduate IS pro-grams serving their markets? Interface, 15(2), 9-13.
Ford, G. (1992). S.E.I. Report on Undergraduate Software Engineering Education (CMU/SEI-90-TR-3). Pittsburgh, PA: Software Engineering Institute.
Freeman, G. (1994). Do students test their software? SIGCSE Bulletin, 26(3), 56-57.
Melone, N. P. (1990). A theoretical assessment of the user-satisfaction construct in information systems research. Man-agement Science, 36(1), 76-91.
Pierce, K. R. (1994). Rethinking academia's conventional wisdom. IEEE Software, 10(March), 94-99.
Rivard, S., Poirier, G., Raymond, L., & Bergeron, F. (1994). Development of a measure to assess the quality of user-developed applications. Proceedings of the Twenty-Seventh
Hawaii International Conference on System Sciences, 4, 522-531.
Rout, T. P. (1992). The culture of quality and software engi-neering education. SIGCSE Bulletin, 24(2), 29-34.
Appendix
Questions used in the survey grouped by their associated quality dimensions and criteria. (Note the dimensions and criteria were not supplied in the questionnaire given to students)
Dimension: PORTABILITY
Criterion: GENERALISABILITY
•
The system could be used in other similar organizational environments, without any major modificationDimension: RELIABILITY
Criterion: COHERENCE
•
The information contained in the reports always matches the actual facts•
Within each table, each record is identified by a unique key.•
Each table contains a key allowing it to be merged with other tableCriterion: ERROR-FREE
•
Errors are easy to identify and corrections are easy to make•
This system automatically corrects certain types of errors, at data-entry time•
This system always issues an error message when it de-tects an error•
The data entry screens provide the capability to easily make corrections on characters or on fieldsCriterion: FUNCTIONALITY
•
Reports provided by this system are comprehensive•
The database contains all the information required topro-duce comprehensive reports
•
The database contains all the elements required to main-tain the system in full working order•
The data contained in the database are always up-to-dateCriterion: INTEGRITY
•
The system does not destroy any information without asking for a confirmation and getting a positive response•
The system provides default values at the data-entry level•
During data entry, the new data are automatically checkedagainst the data already recorded
•
The system never modifies a field without asking for a confirmation and getting a positive responseDimension: UNDERSTANDABILITY
Criterion: INFORMATIVENESS
•
Meaningful identification is assigned to all database ob-jects•
Field names provide information related to the nature of the field•
Each procedure or macro includes comments that help understand its functioning•
Error messages adequately describe the nature of the problem•
Error messages clearly indicate the actions to be taken to rectify errorsCriterion: STRUCTUREDNESS
•
Data entry screens are organized in such a way that the data elements are logically grouped together•
Menus are hierarchical, that is, they go from general to detailed choices•
The database structure is such that queries can be per-formed easilyCriterion: UNIFORMITY
•
All headings are always at the same place•
The same terminology is used throughout the system•
The data entry screens clearly show the spaces reserved torecord the data
•
The format of a given variable is always the same, where ever it is used in the system•
Message presentation is always the same (position, termi-nology, style..)Dimension: USER-FRIENDLINESS
Criterion: EASE OF USE