DELINEATION OF STRUCTURAL
DAMAGE FROM PIEZO-FIBRE-BASED
SENSOR DEGRADATION
MOHAMMAD MEHDIZADEH, SABU JOHN, CHUN H WANG School of Aerospace, Mechanical & Manufacturing Engineering, RMIT University,
Bundoora Campus, Bundoora, VIC 3083, Australia.
VIKTOR VERIJENKO
Defence Material and Technology Centre (DMTC) Ltd., Level 2, 24 Wakefield St, Hawthorn, VIC 3122, Australia.
PAUL CALLUS
Defence Science and Technology Organization (DSTO) 506 Lorimer St. Fishermans bend, VIC3207, Australia
Corresponding Author: Sabu John. Email: [email protected]
Abstract:
This paper investigates diagnostic techniques to distinguish sensor degradation from structural damage, with a focus on interdigital piezoelectric fibre transducers. With the increasing application of structural health monitoring (SHM) systems to manage the on-going integrity of safety-critical structures, it is important to improve the reliability of SHM systems by reducing erroneous information from sensors. This requires a new capability to delineate failures associated with sensors and the sensor network from actual damage in the structure being monitored. This is especially important when the deleterious structural changes in the sensor occurs without any discernible change in the structure being monitored In the present work, an assessment is carried out to quantify the degradation in the electric and electromechanical characteristics of polymer composite PZT sensors, under fatigue loading. Changes in the electrical properties of these sensors such as capacitance and inductance have been measured. Insight into the sensor damage was sought by comparing strain measurements experimentally determined from the sensor to that determined theoretically. The results show that the delineation of structural damage from sensor degradation may be possible by monitoring the changes in the key electrical properties of the sensor components such as electrodes and PZT fibers.
Keywords: sensor degradation, structural integrity, impedance, capacitance, electrical properties, three-point-bending, strain.
1. Introduction:
monitoring of structural cracking, corrosion, delamination, material degradation and other types of damage are major concerns in the operational environment. (Kessler et al., 2002)
Structural Health Monitoring (SHM) has emerged as a feasible method to improve the safety and reliability of structures and thereby reduce their operational cost (Blackshire and Cooney, 2006). SHM technology is perceived as a revolutionary method of determining the integrity of structures involving the use of multidisciplinary fields including sensors, materials, signal processing, system integration and signal interpretation (Wilkie et al. 2000). However, as the application of SHM systems to monitor the status of the MFS increase, it will be increasingly important to determine the durability, reliability, and reparability of the SHM systems (Kent R.M. et al., (2000)). In this context, the sensors or the sensor network must possess sufficient reliability so that they do not require replacement at intervals less than the economic lifetime of the components they are monitoring. For safety-critical structures, such as primary aircraft structures, it is imperative for SHM systems to demonstrate a probability of failure lower than that of the host structure. To achieve this very challenging goal, new technologies are needed to distinguish sensor failure from structural damage. The ability of diagnosing sensor failure is also important to improve the reparability of the SHM system, which is another vital issue requiring further investigation. Chamis (2001) considered two requirements to establish such a multi-functional structure which can perform properly in the real life. Firstly, it requires very effective use of available resources. Secondly, it requires formal methods to quantify the current integrity of a specific structure/component and subsequent reliable evaluation of its future integrity (Shaio et al., (1993)).
The aim of this paper is to investigate the behavior of fiber-based piezoelectric sensors under fatigue loading by characterizing its electrical properties over time. The focus of this paper is on the development of diagnostic techniques to discern between the state of the structure and that of the concomitant sensor.
1. Materials and Methods
1.1. Materials and Specimens
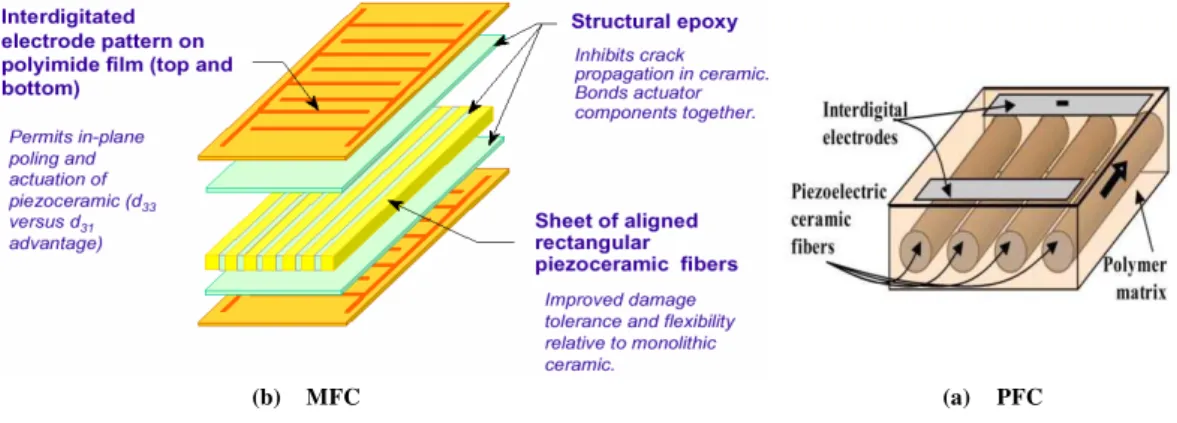
The MFC sensor consists of three primary components; active piezoceramic fibers aligned in a unidirectional manner, interdigitated electrodes (IDE), and an adhesive polymer matrix. Every MFC contains an orthotropic piezo-fiber/epoxy layer in its center, which is then sandwiched between two layers of homogenous epoxy to add structural reinforcement. Laminated to the bottom and top of the epoxy/piezo-fiber layers are two more orthotropic layers of IDEs, running perpendicular to the piezoceramic fibers and encapsulated in Kapton (Figure 1). One distinct feature of the MFC, in contrast to conventional PFC, is that it employs rectangular fibers, which can affect the manufacturing process and the performance of the actuator. The rectangular fiber geometry of the MFC improves the contact between the interdigitated electrodes (IDE) and piezoceramic fibers which reduces the attenuation of the IDE electric field due to the low dielectric constant of the epoxy matrix. Due to the in-situ poling scheme used in manufacturing, the poling direction of the MFC’s piezoceramic fibers aligns with the electric field produced by the MFC’s interdigitated electrodes, enabling the high strain output of the MFC (Lloyd, 2004). Recognizing the superior qualities of MFCs for sensing and structural applications, researchers have adopted the MFC as the actuator of choice for the full spectrum of structural control, vibration suppression and structural monitoring projects. Due to its high conformability, high flexibility and low mass, the MFC does not introduce significant mass or stiffness coupling to host structures. MFC conformability also enables mounting of the MFC to curved and flexible surfaces (Park et al., 2002).
Figure 1: Schematic View of MFC and PFC Sensors (www.smart-material.com, 2010)
interest in the commercial and academic community as a tool in multiple engineering applications (Kessler et al., 2005). While the MFC’s characteristics render it a singularly useful device, limited characterization and modeling research on the MFC can be located in the literature. There is a lack of understanding of its long term durability and degradation under static and fatigue loading, and its electrical properties (Lloyd, 2004).
To investigate the performance of PFC and MFC under fatigue cycling, carbon/epoxy composite laminates were selected to host the sensors. Cross-ply laminates [(90, 0)S] with the dimension of 300×300×1.6 (mm) were
fabricated from eight plies of unidirectional composite. The prepared plates were then cured using an autoclave in accordance with the manufacturer’s specifications and then cut to the 140×250×1.6 mm size for use in the experimental process. The MFC and PFC sensors were bonded on the surface of two identical carbon/epoxy structures using aerospace-grade adhesive as shown in Figure 2.
(a) PFC mounted on surface of specimen (b) MFC mounted on surface of specimen
Figure 2: Piezo-fibre-based sensor mounted on the surface of carbon/epoxy plate: (a) PFC and (b) MFC.
2. PFC Sensor Performance
2.1. Experimental Setup
The aim of this subsection is to evaluate the performance of the PFC sensor under fatigue loading condition by looking at the changes in the electrical properties of the sensor. The electrical properties of the PFC were measured prior and after the bonding to confirm that the bonding process has not affected the properties of the sensor. These electrical properties were also measured while the mounted sensor is under loading to investigate the degradation of the PFC.
2.2. Electrical Properties of the PFC Sensor
In order to evaluate the performance of the PFC sensor, the electrical properties of the sensor needs to be measured prior to the fatigue test in the next section. While there are various parameters which can be measured, some of the electrical properties are more sensitive to the degradation of the sensor such as Capacitance (C), Resistance (R), and Inductance (L). In order to measure these parameters, the PFC electrodes are connected to the oscilloscope as well as the Tenman 72-960 LCR meter. The following values are measured at a frequency of 1 kHz. These are taken to be the electrical properties of the intact PFC.
2.3. Three-Point Bend Fatigue Test
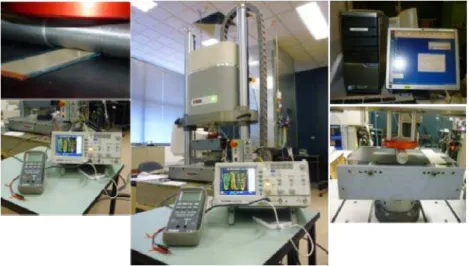
The INSTRON® Machine (Figure 3) was used for the 3-point bend test under displacement control, at an increment of 0.5 mm per minute. The load was measured up to the breakage.The load-displacement graph was plotted and the fatigue load was calculated according to the ASTM E399-90. The ultimate load is measured as 1795.5 N when the carbon/epoxy sample failed at 20 mm of displacement. The load range of between 14 N and 140 N was selected based on the previous results and the initial frequency of f = 5 Hz was applied to the test. The test was under displacement control throughout. The displacement ranged between -1.804 mm and -0.411 mm. The geometrical details of the specimen and the test rig are shown in Figure 4.
The Carbon/Epoxy Sample with the MFC sensor was placed in the machine and the sensor electrodes were connected to the oscilloscope and LCR meter for measurements. In order to avoid any damage to the sensor due to the loading pin, a small indent was introduced on the loading pin to avoid direct contact with the sensor. As the sample needs to be C-scanned regularly during the test to monitor the possible damage in the composite structure, the electrodes were connected using non-conductive tape. The oscilloscope connected to the sensor electrodes shows the voltage spectrum. The LCR meter connected to the sensor electrodes measured the inductance (L), capacitance (C) and resistance (R) values during the test.
The fatigue test was interrupted regularly to measure the electric properties. Once a significant change was observed in any of the parameters, the sample was removed from the test rig and examined with the C-scan machine for any physical damage to the composite, while the sensor was observed using an optical microscope to detect any breakage of the PZT fibres.
Figure 3: The experimental setup for fatigue test
Figure 4: Thegeometrical details of the experimental setup 140 mm
3. Results
3.1. PFC Voltage Response
During the fatigue test, the output voltages of PFC were measured by the oscilloscope. The peak-to-peak voltage (Vpp), maximum voltage (Vmax) and average voltage (Vavg) are plotted in Figure 5, which indicate that a
substantial drop in voltage occurred at about 40,000 cycles. This change could be due to either damage in the host structure or degradation of the sensor. It should be noted that failure in the sensor could not be visibly detected at this point in the fatigue loading. In order to delineate the mode of failure, some additional measurements of the electrical properties of the sensor as well as strain measurements are needed.
Figure 5: PFC Voltage measurements
3.2. PFC L/C/R Values
The basic electrical properties of a piezoelectric sensor include electrical resistance, inductance, and capacitance. In the present experiment, these quantities are measured using a LCR meter. The meter can characterise the amount of charge stored at a specific point known as electric potential. Typically measured in volts, this shows the exact static charge in the electric field of the object. The LCR meter employed in this investigation has the option of measuring these quantities at either 120 Hz or 1.0 kHz. In experiments to be discussed below, all the parameters are measured at a frequency of 1.0 kHz.
As seen from Figure 6, there are two noticeable drops in the capacitance value. Detailed examination of the host structure found no damage at these points of capacitance reduction, but some of PFC fibres are observed to sustain some breakage as shown in Figure 11a. This result suggests that the cause of the drop in sensor output voltage is due to degradation of the sensors. Using the L/C/R meter, the inductance and resistance values were measured. While the resistance does not display any noticeable change beyond the inherent noise, the inductance shows a step-change at the time when the capacitance exhibited a small peak (Figure 7)
After the second change occurred in the capacitance measurements after about 95000 cycles (Figure 6) the sample was tested again and this time, discernible damage was observed in the structure. The C-scan machine was used to scan the sample before the test and after the test. The results show that after relatively low loads and low number of fatigue cycles, sensors in structures deteriorated well before the structure did. Also, the importance of having a functional, durable and reliable sensor for the lifetime of the structure is essential in order to certify the performance of an embedded system to monitor the structure. This part of the experimental program, where the sensor was damaged, can be considered as one of the important gaps in structural health monitoring systems (SHMS). Hence, the deployment of monitoring systems in the industry will need to be assessed for self-integrity before structural integrity is monitored and ultimately managed. In this case, it is clear that a ‘false positive’ reading was obtained and this can be attributed directly to a malfunctioning sensor. The next challenge is to determine appropriate parameters which are sensitive to damage in the sensor and to discriminate between data from the degraded sensors or the damaged structures. This is very important as the delineation of the sensor degradation from the structural degradation can only be possible if the chosen
0 1 2 3 4 5 6 7 8 9 0 300 0 600 0 120 00 180 00 240 00 300 00 360 00 450 00 600 00 750 00 900 00 970 00 100 0 00 103 0 00 V o lta ge ( V )
Number of Cycles
parameters such as capacitance, inductance, resistance, voltage from the sensor can be processed to differentiate between genuine structural damage and ‘false’ readings from a degrading or damaged sensor.
Figure 6: PFC Capacitance measurements
Figure 7: Inductance measurements
4. Post-damage Analysis
The next step is to evaluate the effect of the damage within the sensor on its electrical properties by focusing on the damaged zones and to measure the parameters at these points. This evaluation can be done by detaching the sensor from the structure and attempt to measure the electrical properties at the specific locations throughout the sensor. The comparison of the measurements close to the damage zone and at intact zones can help to characterize the sensor response under fatigue loading conditions and possible fracture. In order to remove the sensor, the sample was heated up in the oven under 80ºC of temperature for 30 minutes and then the sensor was carefully detached. Then the electrical properties of the sensor were measured to make sure that the detaching process did not affect the performance of the MFC sensor. The values showed that the sensor was properly removed from the structure without further damage. To determine the effect of damage on the local properties of the sensor, the electrical properties were measured between each two parallel point of the electrodes (Figure 8).
1
2
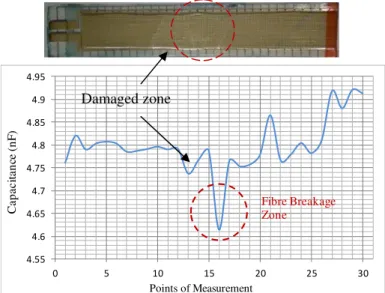
Figure 8: Capacitance measurements between two points of the electrodes
The aim was to determine if the observed damage alters the properties between all the electrode points or the change was more significant at the damaged zones. The Capacitance was measured by connecting the L/C/R meter to each two parallel points. As seen in Figure 9, the capacitance values are decreased compared to the capacitance of intact sensor which was 7.786 (nF). Also, further reductions can be observed at the exact locations of the fibre breakage. However, the capacitance measurements were not considerably different at the damaged areas compared to the intact parts of the sensor. This statement can demonstrate the negligible effect of the fibers micro-cracking on the local electrical properties of the sensor.
Figure 9: Capacitance measurements at damaged areas
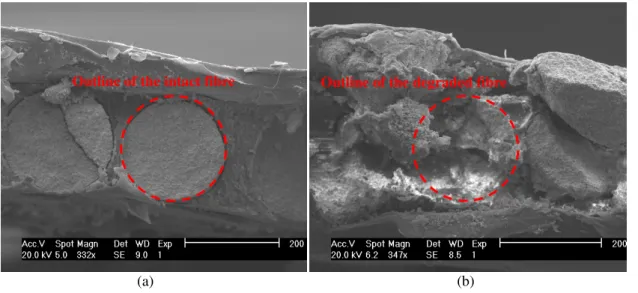
4.1. Scanning Electron Microscopy (SEM)
The Philips XL30 SEM with Oxford Si (Li) X-ray detector was used to scan the damaged sensor under the microscope. The damaged areas were cut out of the sensor with a sharp edge razor and placed on the pin. These samples were cut from the significant damaged zones for further investigations. The sections were cut at the location of the damaged zones.
The SPI® Supplies Sputter Coater was used to gold-coat the samples. This step is essential as the upper level of the sensor is non-conductive and needs to be coated with gold in order to pass the beam under the microscope. The coated samples were then carefully removed from the coating glass and placed in the stage of the Philips XL30 SEM. As the aim was to investigate how the piezo-fibers perform under fatigue loading, the damage and undamaged zones of the sensor were observed and the images were captured as below. As seen in Figure 10, there are significant changes in the shape of the fibers after the fatigue loading. This shows that the failure within the fibers may interrupt the connection of the piezo fibers with each other as well as the electrodes. This breakage will thus contribute to the charge, voltage and hence, capacitance drops from the sensor. It is thus reasonable to deduce that additional piezo-fibre damage in the 2D array of piezo-fibre layout (seen in Figure 1) will have a cumulative effect on overall voltage and capacitance drop of the MFC and PFC sensors.
4.55 4.6 4.65 4.7 4.75 4.8 4.85 4.9 4.95
0 5 10 15 20 25 30
C
a
pa
ci
ta
n
ce (
n
F
)
Points of Measurement
Fibre Breakage Zone
Damaged zone
(a) (b)
Figure 10: The SEM images of the sensor at (a) undamaged zone (b) damaged zone
The capacitance can be calculated if the geometry of the conductors as well as dielectric properties of the insulator between the conductors are known. The capacitance of a parallel-plate capacitor with two parallel plates both with the area of ‘A’ separated by a distance ‘d’ is approximately equal to the Equation (1). Therefore, the capacitance between the electrodes of the MFC sensor is approximately represented by Equation (1) as below:
Where A is the area of overlap between two electrodes
εr is the relative static permittivity of the material between the electrodes (for vacuum, εr=1)
ε0 is or the permittivity of vacuum.
d is the separation between the electrodes
The experimental results in this project show that the capacitance values decrease as the degradation escalates in the MFC sensor. It can be seen from Equation (1) that the capacitance is related to εr, ε0, A and d. Therefore, it
can be deduced that the reduction in the capacitance value is caused by the misalignment of the electrodes which increases the separation between them (d). In order to investigate this assumption, the Scanning Electron Microscopy (SEM) testing is used to observe the alignments of the electrodes as well as the piezo-fibers before and after the capacitance reduction. Figure 10 shows the breakage in the piezo-fibers which caused the misalignment in the interdigitated electrodes. This misalignment will tend to increase the separation distance (d) between the electrodes which caused the reduction in the capacitance value. However, the local measurements of the capacitance (Figure 9) show that his reduction is almost constant throughout the whole sensor and the further reduction at the damaged zones of the sensor is not significant. This point illustrates that the micro-cracking of the fibers is not the main cause for the reduction in the capacitance measurements and capacitance has more dependency on other parameters rather than d. To investigate this issue, the relationship between capacitance and strain/voltage coefficients of the sensor is used as seen in Equation (2) (Overly and Park, 2008):
Where, C is the capacitance, d33 the strain coefficient, A is the electrode surface area, g33 is the voltage
coefficient and d is the thickness separating the electrodes. This relationship implies that the drift in d33 and g33
values may be responsible for the reduction in the capacitance measurements.
4.2. The Comparison between PFC and MFC Performance
There are various types of piezoelectric composites currently used for sensing/actuating application. Among various types of these sensors, the fiber-based sensors i.e. Macro Fiber Composite (MFC) and Piezoelectric Fiber Composite (PFC) have significant advantages as compared to other kinds of sensors such as strain energy density, controlled directional actuation, relatively high performance in achieving in controlled actuation, flexibility, conformability, and durability. The properties of base piezoelectric material for MFC and PFC are shown in Table 1.
Table 1: MFC & PFC Properties
PROPERTIES UNITS PFC MFC
D31 (STRAIN CONSTANT) M/V OR
COUL/N -1.73E-10 -1.85E-10
D33 (STRAIN CONSTANT) M/V OR
COUL/N 3.80E-10 4.40E-10
G33 (VOLTAGE CONSTANT) VM/N 2.50E-2 2.55E-02 K33 (COUPLING FACTOR) 0.72 0.72 K31 (COUPLING FACTOR) 0.36 0.33
K(DIELECTRIC CONSTANT-
1KHZ) 1725 1850
TAN DE (DIELECTRIC LOSS) % 2 0.012 R (DENSITY) G/CM3 7.5 7.7
TC(CURIE TEMPERATURE) ˚C 350 335
C11 (COMPLIANCE) M2/N 1.52E-11 1.85E-11 C33 (COMPLIANCE) M2/N 1.83E-11 2.07E-11
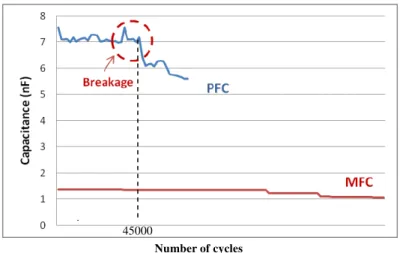
The visual status of the MFC and PFC sensors are shown in Figure 11. The capacitance of MFC and PFC sensors are plotted in Figure 12. It shows that the MFC has better performance in terms of durability compared with PFC under fatigue loading condition. While the degradation in PFC started after only 45000 cycles, the MFC shows significantly better robustness even after 350000 cycles. This comparison illustrates one desirable feature of the MFC sensor over PFC sensor. Therefore, in this paper, the degradation of the MFC sensor as the more reliable sensor, is further investigated and the outcomes are provided in the following sub-sections.
(a) (b)
Number of cycles
Figure 12: The comparison between PFC and MFC Capacitance
5. Differentiating between Sensor Degradation and Structural Damage
The aim of this paper is to characterize the sensor response in order to differentiate the sensor degradation/damage from the structural damage. The “sensor damage” is where there is a clear sign of deterioration in the sensor such as visible fibre breakage which resulted in a sudden change in the electrical properties of the sensor such as capacitance. In the other hand, the “sensor degradation” is not visually visible and normally occurs when the sensor components are gradually degrading. This degradation causes a progressive drift in the electrical properties of the sensor. In this paper, the detection of the sensor degradation and its relation to the structural damage is mostly discussed. From the work presented in this paper, three scenarios can be considered in relation to the sensor/structure status:
In the first scenario, the degradation of the sensor occurs prior to the structural damage. In this case, any change in the capacitance and piezoelectric coefficient (d33) is considered as a sign of sensor degradation. The
stain-based technique, described below can also be used to confirm this degradation as the εMFC also drops which
increases the ∆sensor (defined below).
In the second scenario, the structural damage occurs when the sensor is still intact. This would be the most likely situation. In this scenario, the sensor is still intact and hence the changes in the sensor responses can be used to monitor any damage in the structure. The increase of the ∆structure (defined below) in the strain-based technique
demonstrates the degradation in the structure.
The third scenario however is more complex and has not been properly addressed yet. In this scenario, the degradation in the structure occurs when the sensor is already degraded. In this situation, the electrical properties of the sensor are already degraded at the time of structural damage and therefore any further changes in the sensor response can be indicative of the progressive degradation in the sensor or the damage in the structure. The presented strain-based technique can be used to differentiate the sensor degradation from structural damage in the third scenario. All the techniques presented in this paper are deemed capable of differentiating the sensor degradation from structural damage as they show relatively good sensitivity to both degradations. The only situation which the structural degradation may affect the sensor degradation techniques is when the structural damage is exactly beneath the sensor. In this case, the electrical impedance-base technique can be used to monitor the degradation in that part of the structure. The following sections describe each technique in detail.
5.1. MFC Degradation
Two different approaches related to sensor performance during service is discussed - MFC failure and MFC degradation. The failure of the sensor can be easily detected as the sensor does not produce any measurable
output. However, the degradation of the sensor is more complex and needs further investigation. The degraded sensor can still produce an output and can perform seemly well. This can lead to false negative or false positive signals about the status of the sensor/structure. For piezoelectric sensors, the sensor failures are inevitable after undertaking extreme loading and environmental conditions, since sensors are usually one of the more vulnerable components of a monitored structural system. Furthermore, the mechanical and electrical properties of MFC materials could also gradually degrade over time. This degradation of sensor quality, as well as degradation in bonding integrity, will be especially problematic, if one needs to employ large numbers of sensors/actuators over a long period of time and to identify when to replace the sensor/actuator network. This is one of the main gaps in certifying the SHM systems which has not yet been addressed in the literature. The issue of assessing the degradation of the sensor in terms of severity and its effect on the performance of the sensor under the real-world operational condition is of paramount concern in the industry (Park G.H, (2006)). These issues demonstrate the need for characterization of sensor response to identify whether the damage is caused within the sensor itself and/or is located within the host structure. Two techniques are used to monitor the status of the sensor. These are presented in the following sub-sections.
5.1.1.Strain-based technique
This technique is based on the geometry of the three-point-bend test as well as the equation of the maximum deflection of a specimen tested in this configuration. In general, the MFC sensor generates electricity due to the deformation or external loading. In this work, the MFC is bonded on the surface of the carbon/epoxy plate (thickness 1.6 mm) and placed in the experimental setup. Then the vertical loading is applied based on the three-point-bend test on the surface of the plate. This loading causes deflection in the plate which can be used to calculate strain and strain rate (the change of strain per time) accordingly. By assuming the perfect bonding between MFC and the structure, the strain level of the plate should be the same as the strain in MFC sensor. The aim here is to relate the vertical displacement of the central point of the plate to the strain. The equation for the deflection of the plate is used along with the geometry of the three-point-bend test to determine the relationship between the vertical displacement of the center point and the stress as below:
Hence, the strain-displacement equation can be written as:
In this experiment, b=140 mm and L=250 mm and therefore the relation between the vertical displacement and strain is:
.
plate. These strain values are consequently compared with the strain gauge responses as well as the strain measured from MFC output voltage. As long as the MFC is intact, the strain calculated from theoretical relations, T, is the same as the strain that derived from MFC output voltage MFC because the fibers within the
MFC bend in a same way as the host structure. However, once the degradation in the MFC sensor starts, these values will diverge due to the micro-cracks within the piezoceramic fibers caused by the fatigue. This difference can be used to monitor the degradation of the MFC sensor itself.
∆
∆ The MFC is intact ∆ The MFC is degraded
The sensor values are plotted in Figure 13. It can be seen that there is a gradual increase in the trend. This
increase can be indicative of the degradation in the sensor due to the fatigue. The degradation of the sensor causes a reduction in the MFC and accordingly increases the sensor. The small fluctuations in the trend are due to
the effect of the environmental noise and interference on the output voltage of the sensor. Furthermore, a considerable increase is observed from this graph after 150000 cycles which is indicative of the sensor damage.
0 10 20 30 40 50 60 70 80 90 100
0 50000 100000 150000 200000
∆sens
or
(
με
)
Number of Cycles
Sign of Sensor degradation
Figure 13: Difference between the calculated strain and MFC strain measurements
5.1.2.Piezoelectric coefficient-based technique
The second technique is based on change in the piezoelectric coefficient (d33) while the sensor in under fatigue
loading. If the PZT fibers in the MFC sensors are modeled as a parallel plate capacitor, then the capacitance, Cp, depends on the area, A, and separation, d, of the plates as shown in Equation (12).
Where lc and bc are the active length and width of the MFC and tc is the thickness. Assuming strain only occurs
along the 3 (poling) direction and averaged along this length of the MFC, it can be shown that the voltage relation can be written as Equation (13):
Where d33 and Yc, are piezoelectric coefficient and Young`s modulus respectively and ε is the MFC strain. The
The properties of the MFC sensor used for this experiment are shown in Table 2:
Table 2: Properties of MFC Type P1 M410
Model M-410-P1
Overall Dimensions 54 mm × 22 mm
Active area dimensions (lc , bc) 40 mm × 10 mm
Max voltage 500 to 1500 V
Max tensile strain < 4500 ppm
Thickness (tc) approx. 0.3 mm
Piezoelectric coefficient (d33) 4.40E2 PC/N
Young`s modulus (Yc) 30.336 GPa
Hence, the relationship between voltage, capacitance and piezoelectric coefficient can be written as Equation (15):
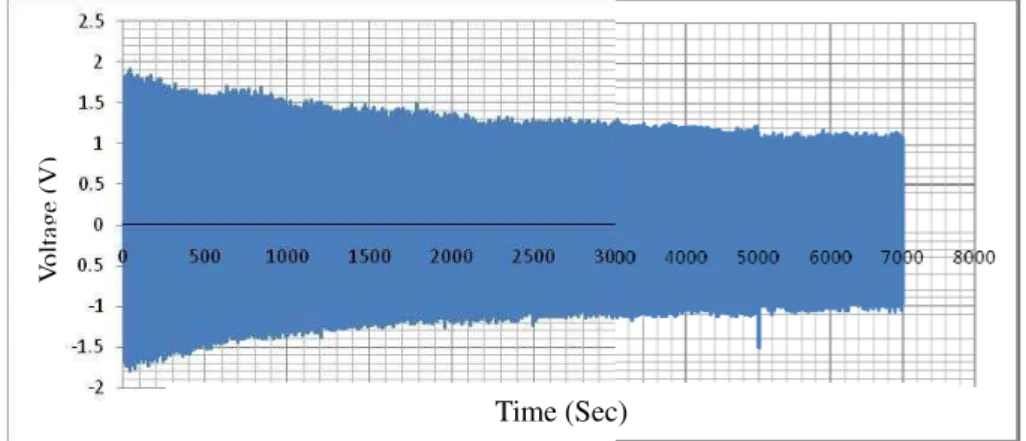
The post damage analysis of the sensor, which was presented in previous sections, shows that the d33 and g33
values also change as a result of sensor degradation. The relationship between capacitance and voltage in Equation 15 illustrates that the sensor degradation, which reduces the voltage response (Figure 14), causes more significant reduction in the d33 relative to the fall in capacitance. In other words, the changes in the d33 can be
indicative of the sensor degradation (Figure 15). The relationship shown is used to estimate the d33 values from
the voltage and capacitance measurements. It can be seen from Figure 15 that the percentage d33 reduction is
higher than that of the capacitance.
Figure 14: MFC output voltage
5.2. Structural Degradation
Structural health monitoring is the ability to detect the propagation of structural damage especially at an incipient stage. The detection of damage (such as cracks, delaminations, disbonds) is crucial in any failure prevention technology. If damage could be detected at an early stage, corrective measures can be taken and
Time (Sec)
V
o
ltag
e
catastrophic failure can be prevented. Moreover, a structure with incipient damage can be quickly repaired and put back in service. By substituting timely repairs for costly replacements, important lifecycle cost savings can be achieved. A reliable procedure for early damage detection will reduce the design uncertainties, will increase designer confidence, and will result in lower reserve factors, smaller weight, and reduced initial cost. Global detection methods, as those based on vibration mode shapes and frequency characteristics, are insensitive to
Figure 15: Percentage of fall in Capacitance and d33 measurements
incipient local damage. A crack initiating at a critical location in a complex structure can be fatal for its, operation but may produce undetectable changes in the overall structural frequency. For this reasons, failure detection methods are still needed for the detection of incipient damage in vital structural areas. Two approaches are possible: either subject the structure periodically to minute in-depth inspection or implement an automatic system for continuous health monitoring. In contrast, automatic health monitoring performs continuous surveillance of the machinery, with special emphasis on the critical areas.
In this paper, two techniques are presented to monitor the status of the structure; strain-based technique and electromechanical impedance-based technique. Both techniques are described below and their capabilities to monitor the degradation of the structure are discussed.
5.2.1.Strain-based technique
One of the techniques presented in this paper for monitoring structural status is based on the strain values gained from measurements as well as the theoretical calculations. In this technique, the strain measurements from strain gauges, εsg, are continuously captured and compared to the strain calculated from theoretical equation εT. As
long as the structure is intact, the difference between εT and εsg (structure) is close to zero.
(7)
However, once the degradation starts in the structure in the form of a crack, or delamination,
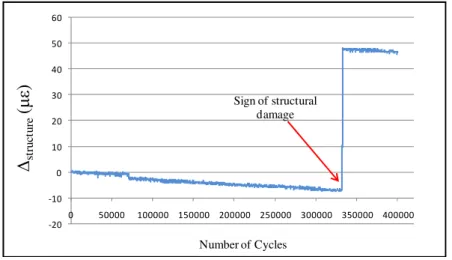
structure begins toincrease as the damage in the structure will result in a reduction in the strain gauge measurements. Figure 16shows structure versus the number of cycles. Here, the difference between the theoretical strain and strain
gauge measurements are close to zero as expected up to the 340000 cycles. However, there is a significant increase at about 340000 cycles which shows the reduction in the strain gauge measurements. This reduction can be indicative of structural damage or strain gauge debonding. It should be noted that the strain gauge itself is
Capacitance
considered intact as the failure of the strain gauge can be accounted for the zero result in strain gauge measurements. Debonding of the strain gauge will also show up as zero strain reading from the strain gauge.
Figure 16: Difference between the calculated strain and strain gauge measurements of the host structure
5.2.2.Impedance-based technique
The electro-mechanical (E/M) impedance technique utilizes the direct and the converse electro-mechanical properties of piezoelectric materials, allowing for the simultaneous actuation and sensing of the structural response (Giurgiutiu et al., 1998, 2002). This technique is a powerful and innovative NDE method for local damage detection of a variety of structures, including aerospace, civil, and mechanical systems. The principle of the piezoelectric impedance-based structural health monitoring (SHM) technique is to measure the electrical impedance of a piezoelectric patch i.e. PZT and MFC, attached to a structure in a certain frequency range. Electrical impedance variations indicate physical changes in the structure indirectly due to coupling between the electrical and mechanical impedances. In order to investigate the capability of this technique to characterize the degradation in the host structure using the sensor responses, a Macro-Fiber Composite (MFC) was attached to a structure to simultaneously produce voltage caused by the structural deflection and monitor changes in the electrical-impedance signature.
The relative size and weight of a MFC patch is negligible compared to that of its host structure (Overly et al., 2008), which in this case is a carbon/epoxy plate. Hence, the impact of MFC patch on the dynamic characteristics of the host structure is negligible. This low impact allows the use of a MFC patch to accurately measure the mechanical impedance of the structure (Park, S. et al., 2007).
The electrical impedance (Z) of the MFC sensor is determined by the magnitude and phase of the impedance through Equations (8) and (9):
The real part of the impedance - resistance, R, is not affected by the frequency, f, while the imaginary part, reactance (X), is frequency dependent and depends on the capacitance and inductance of the circuit. The reactance of the MFC can be calculated using Equations (10) and (11). Therefore the total impedance can be calculated from Equation (12).
‐20
‐10 0 10 20 30 40 50 60
0 50000 100000 150000 200000 250000 300000 350000 400000
∆
struct
u
re
(
με
)
Number of Cycles Sign of structural
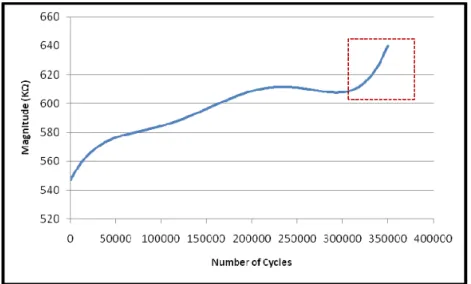
During the experiments, the LCR values are measured and the electrical impedance magnitude and phase are calculated accordingly. The results are plotted in Figures 17 and 18.
Figure 17: Electrical Impedance magnitude (Highlighted section indicates possible onset of damage).
Figure 18: Electrical Impedance phase (Highlighted section indicates possible onset of damage).
the structure after about 300000 of cycles. The change in the trend of the impedance phase is somewhat less dramatic as seen in Figure 18. This plot nevertheless indicates the beginning of a change as shown in the boxed section of this Figure.
6. Conclusion
In this study, the characterization of the sensor response to assess the status of the host structure as well as the senor itself is addressed. The key electrical properties measurements show that the degradation of the sensor starts prior to the structure which results in ‘false positive’ readings from the sensors. The changes in the key electrical properties of the sensor such as capacitance are used to monitor the sensor degradation. The local measurements show that the capacitance is more sensitive to the properties of the sensor components such as piezoelectric coefficient and voltage coefficient rather than the micro-cracking misalignments. Two techniques are presented and the capability of each technique to differentiate between the sensor degradation and the structural degradation is discussed. In the first technique, the comparison between the strain gauge measurements, MFC strain measurements and the theoretically calculated strain is used to detect the sensor degradation and the structural degradation separately. The difference between theoretically calculated strain and the strain gauge measurements should be close to zero as long as the structure is intact and any increase in this difference can be indicative of structural degradation. The comparison between MFC strain measurements and the calculated strains from theoretical equations can be used to monitor the status of the sensor itself. While it was relatively easy to calculate the structural strain in the experimental set-up described in this paper, computational Finite Element-derived strains can be used by this strain subtraction technique in more complex structural configurations. As long as the difference between these two values is close to zero, the sensor can be assumed to be structurally sound. In the second technique, the capability of the electrical impedance of the sensor to detect the changes in the structural integrity is discussed. This is due to the electromechanical coupling between the sensor and the structure. The present approach yields an improved methodology to differentiate the degradation in the sensor from the structural degradation. This is vitally important as it can address one of the more important issues in the certification of the SHM systems.
7. Future Work
Characterization of the strain coefficient (d33 or 31) for a MFC sensor to account for its deterioration with
prolonged use will be undertaken. The actuation of the MFC will be used to characterize the degradation of the structure and sensor itself. Also, the interesting topic of repair of surface or embedded sensors will be explored in the light of the findings in this paper, since both sensor configurations have advantages and disadvantages.
Acknowledgements
The author(s) acknowledge the support of the Defence Materials and Technology Centre (DMTC), which was established and is supported by the Australian Government`s Defence Future Capability Technology Centre (DFCTC) initiative
References
[1] Blackshire J.L., and Cooney A. 2006 “Evaluation and Improvement in Sensor Performance and Durability for Structural Health Monitoring Systems”. Submitted for publication in Proceedings of the Conference on Advanced Sensor Technologies in Nondestructive Evaluation and Structural Health Monitoring, SPIE.AFRL-ML-WP-TP-2006-408.
[2] Chambers J.T., 2003. “Durability Testing of an Aircraft Structural Health Monitoring System”. Massachusetts Institute of Technology, MS Thesis, Cambridge, MA, September 2006.AC29-2C. Advisory Circular No: 29-2C. U.S. Department of Transportation, Federal Aviation Administration.
[3] Chambers J.T., Wardle B.L., and Kessler S.S. 2004 “Durability Assessment of Lamb Wave-Based Structural Health Monitoring Nodes”. In 47th AIAA Structures, Structural Dynamics, and Materials Conference, Newport, RI,. AIAA 2006-2263.
[4] Chambers, J, 2006, “Durability Testing of an Aircraft Structural Health Monitoring System”. Massachusetts Institute of Technology, MS Thesis, Cambridge, MA.
[5] Chamis, C.C 1987., “Probabilistic Structural Analysis Methods for Space System Components,” Probabilistic Engineering Mechanics, 1987 vol. 2, no. 2, pp. 100– 110.
[7] Giurgiutiu, V. and Rogers, C.A., 1998 “Recent Advancements in the Electro-Mechanical (E/M) Impedance Method for Structural Health Monitoring and NDE,” in SPIE’s 5th Annual International Symposium on Smart Structures and Materials, Catamaran Resort Hotel, California, USA, pp. 3329 – 3353.
[8] Giurgiutiu, V., Zagrai, A. and Bao, Jung Jung, 2002 “Piezoelectric Wafer Embedded Active Sensors for Aging Aircraft Structural Health Monitoring,” Structural Health Monitoring, 1, 41-61.1
[9] Inman, D and Ruggiero, D, 2007 “Composite Materials with Embedded Sensing”, Center for Intelligent Material Systems and Structures Department of Mechanical Engineering Virginia Tech, USA.
[10] Kent R.M. and Murphy D.A. 2000 “Health Monitoring System Technology Assessments – Cost Benefits Analysis”. NASA/CR-2000-209848.
[11] Kessler S.S. , Amaratunga K., and B.L. Wardle., 2005, “An Assessment of Durability Requirements for Aircraft Structural Health Monitoring Sensors”. In Proceedings of the 5th International Workshop on Structural Health Monitoring, Stanford, CA.
[12] Kessler, S, 2002 “Piezoelectric-Based In-Situ Damage Detection of Composite Materials for Structural Health Monitoring Systems”. Massachusetts Institute of Technology, PhD dissertation, Cambridge, MA.
[13] Kessler, S, 2005 “Certifying a Structural Health Monitoring System: Characterizing Durability, Reliability and Longevity”. In Proceedings of the 1st International Forum on Integrated Systems Health Engineering and Management in Aerospace, Napa, CA. [14] Kessler, S, Amaratunga, K, and Wardle, B, 2005 “An Assessment of Durability Requirements for Aircraft Structural Health
Monitoring Sensors”. In Proceedings of the 5th International Workshop on Structural Health Monitoring, Stanford, CA, 12-14. [15] Lloyd, J, 2004 ‘‘Electrical Properties of Macro-Fiber Composite Actuators and Sensors,’’ Master Thesis, Department of
Mechanical Engineering, Virginia Polytechnic Institute and State University.
[16] Matic, P., 2003 “Overview of Multi-functional Materials,” Proceedings of SPIE, Active Materials: Behavior and Mechanics, V.5053, pp. 61-69.
[17] Overly, T. G. Park S., G., et al. 2008 "Development of an extremely compact impedance-based wireless sensing device." Smart Materials and Structures IOP Publishing Ltd.
[18] Park G.H., C. Farrar R. , Rutherford C. A., and Robertson A. N., 2006, Piezoelectric active sensor self-diagnostics using electrical admittance measurements. ASME Journal of Vibration and Acoustics, 128(4):469–476.
[19] Park S., Crisso B. L., et al. 2007, "MFC-based structural health monitoring using a miniaturized impedance measuring chip for corrosion detection." Research in Nondestructive Evaluation 18(2): 139-50.
[20] Park, G., Ruggiero, E., Inman, D. J., 2002 “Dynamic testing of inflatable structures using smart materials,” Smart Materials &Structures. v 11 n 1, February 2002. p 147-155.
[21] Shiao, M.C., Abumeri, G.H. and Chamis, C.C., 1993, “Probabilistic Assessment of Composite Structures,” AIAA/ASME/ASCE/AHS/ASC, 34th Structures, Structural Dynamics and Materials Conference, Proceedings pp. 1174–1186. [22] Wilkie, W.K., Bryant, G.R., High, J.W. et al., 2000 “NASA Langley Research Center Macro-Fiber Composite Actuator