Contents lists available atScienceDirect
Food Quality and Preference
journal homepage:www.elsevier.com/locate/foodqual
Understanding product di
ff
erentiation failures: The role of product
knowledge and brand credence in olive oil markets
Melania Salazar-Ordóñez
a,⁎, Macario Rodríguez-Entrena
b, Elena R. Cabrera
c, Jörg Henseler
d,eaUniversidad Loyola Andalucía, Department of Economics, C/Escritor Castilla Aguayo 4, 14004 Córdoba, Spain
bUniversidad de Córdoba, WEARE-Water, Environmental and Agricultural Resources Economics Research Group, Department of Agricultural Economics, Campus Rabanales, Ctra. N-IV Km 396, 14014 Córdoba, Spain
cInstitute of Agricultural Research and Training (IFAPA), Department of Agricultural Economics and Rural Studies, Avda. Menéndez Pidal s/n, 14080 Córdoba, Spain dUniversity of Twente, Faculty of Engineering Technology, Department of Design, Production and Management, Drienerlolaan 5, 7522 NB, Enschede, The Netherlands eNova Information Management School, Universidade Nova de Lisboa, Campus de Campolide, 1070-312 Lisboa, Portugal
A R T I C L E I N F O
Keywords:
Product differentiation failure Actual consumption Product alternative Consumer knowledge Consumer-based brand equity Partial least squares
JEL classification: D12
Q19
A B S T R A C T
This paper tries to shed light on a key question for different foodstuffs: why are product differentiation strategies far from successful in some agri-food markets? Undoubtedly, understanding consumer behaviour in situations where product differentiation failures occur is essential to resolving this issue. To that end, we built a theoretical model to analyse the roles played by both consumer information and inferences made from informational sti-muli, given their potential relevance to the differentiation process. We thus examined consumer knowledge structures and brand credence related to attitudes toward a particular foodstuffand a product alternative, as well as the actual consumption of the foodstuff. The theoretical model was tested by an empirical application, using variance-based structural equation modelling (SEM) with the partial least squares (PLS) algorithm. Results showed that attitudes to both products explained the relative consumption of the foodstuffunder study. In addition, product knowledge influenced consumers’attitude towards the foodstuffand its consumption, but not the attitude towards the product alternative. On the contrary, the higher the brand equity of the product al-ternative, the better the attitude towards it. In addition, this factor was shown to have an impact on the attitude towards and consumption of the foodstuff. Therefore, those variables are key to explaining consumer behaviour in such agri-food markets, where increasing consumers’knowledge and creating consumer-based brand equity seem to be appropriate strategies to improve the differentiation process.
1. Introduction
Strategies such as product differentiation are key in the agri-food sector, where consumers increasingly demand not only food safety but also high-quality, healthy foodstuffs (EFSA, 2010). Thus, in recent decades, there has been a movement in the agri-food market from uniform and undifferentiated commodities to a re-differentiation of production (Scrinis, 2007). However, this strategy is far from successful in some agri-food markets, where the main attempts at differentiation have been based on extrinsic attributes such as origin (e.g. Aprile, Caputo, & Nayga, 2012). This raises the question of why this strategy has largely failed. According toDickson and Ginter (1987), the notion of differentiation encompasses a consumer’s perception of specific product features. In this regard, understanding consumer behaviour at the microeconomic level becomes essential in order to be able to answer the question posed above and, as a consequence, design and implement
successful commercial strategies that generate increased sales and thus higher incomes (Deaton & Muellbauer, 1980).
This paper attempts to contribute to the development of a theore-tical framework in agri-food markets by providing a more in-depth understanding of consumers’ decision-making processes, particularly for those agri-food markets that still show product differentiation fail-ures. In order to do so, a theoretical model is built based on core factors that potentially contribute to consumers’perception of product diff er-entiation because of limiting perceptions of specific product features (Dickson and Ginter, 1987). These factors are referred to information and inferences made from informational stimuli, which are in turn embedded in consumer decision making processes (Fishbein & Ajzen, 1975; Steenkamp, 1990 and 1997). Therefore, this model allows us to analyse the roles played by the abovementioned factors by examining the effect of the consumer knowledge structure and brand credence on attitudes towards a particular foodstuffand a product alternative, and
https://doi.org/10.1016/j.foodqual.2018.02.010
Received 19 August 2017; Received in revised form 21 February 2018; Accepted 21 February 2018 ⁎Corresponding author.
E-mail address:[email protected](M. Salazar-Ordóñez).
Available online 23 February 2018
to the actual consumption of the foodstuff. The theoretical model is tested through an empirical application to olive oil markets in southern Spain using variance-based structural equation modelling (SEM) with the partial least squares (PLS) algorithm.
In this regard, the new perspective developed here is remarkable due to its potential to be adapted and applied to agri-food markets where consumers’ issues in differentiating between product features creates a need to study consumer behaviour according to this. Consequently, we study not only widely-used factors in the literature, such as consumer attitude toward the product or consumer information, but also some innovative factors related to beliefs about a product al-ternative. These are unusual in the available literature, both in theo-retical and empirical approaches, going beyond traditional food choice models. Shedding light on how those factors work could help to guide future sales strategies in markets with problems of product diff er-entiation where consumers cannot maximise the utility from their food choices.
The paper is structured as follows. The following section outlines the theoretical framework. The methodological approach is discussed in Section3, with the results of the research shown in Section4. Finally, the paper presents the discussion and conclusions in Sections5 and 6, respectively.
2. Building a theoretical model
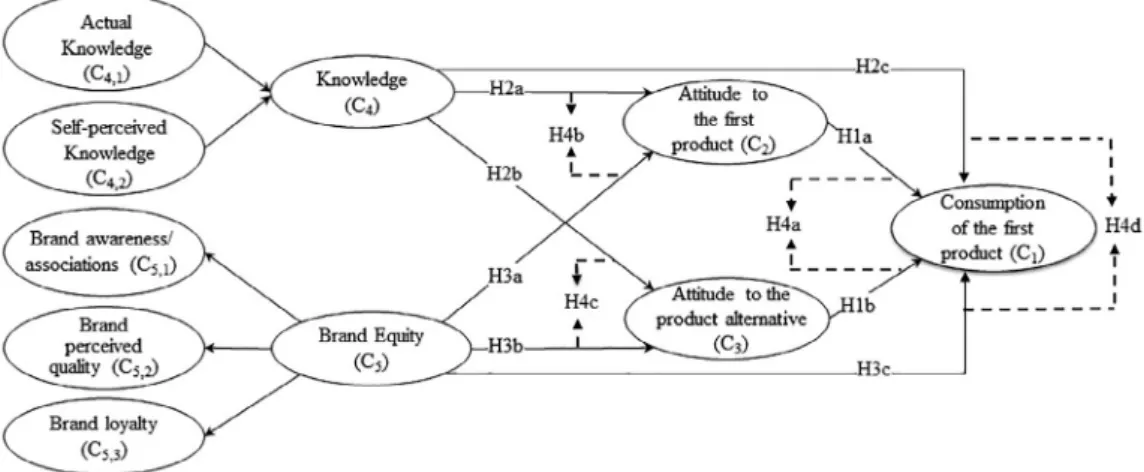
Widely-used theoretical frameworks, such as the well-known Theory of Reasoned Action (Fishbein & Ajzen, 1975) or Theory of Planned Behaviour (Ajzen, 1991), have been applied to explain the decision-making processes surrounding food choices (e.g. Shepherd, 1990; Saba & Di Natale, 1998). Furthermore, there are theories that have been specifically designed to explain consumer behaviour re-garding agri-food products, such as theSteenkamp (1997)conceptual framework. According to such theories, factors related to the product itself, the environment and, of course, the consumer determine the purchase decision-making process. Based on both the Fishbein and Ajzen (1975)and theSteenkamp (1997)theories, we link behavioural actions to attitudes and behavioural beliefs or perceptions, such as ac-ceptance of information about the product reflected in the knowledge of that product and inferences made from informational stimuli embodied in the brand equity (seeFig. 1).
According toBreckler (1984), attitudes consist of cognitive, aff ec-tive and conaec-tive aspects, that is, beliefs, feelings and intentions about the product. However,Schiffman and Kanuk (2004)argue that conation can be examined as an observable behaviour, while,Steenkamp (1997) relates it to choices. We followed these theoretical approaches, which are in line with classical economic theory on consumer behaviour where the focus is on explaining actual or observed choices (Samuelson,
1948). As such, instead of analysing intentions, we focus on actions, given that consumers’self-reported purchases were considered. This is consistent with previous studies (e.g., Saba & Di Natale, 1998) and avoids biases such as the imperfect correlation between intentions and actions (Bagozzi & Dholakia, 1999).
As mentioned above, individual attitudes are key drivers in con-sumer purchase behaviour since they define the favourable or un-favourable appraisal of an object (Ajzen, 1991) and allow marketers to predict consumer behaviour (Wilcock, Pun, Khanona, & Aung, 2004). Consumers choose among product alternatives according to their atti-tude about the attractiveness of each product (Steenkamp, 1997). Analysing a single behaviour is a limitation that even Ajzen and Fishbein (1980) acknowledged, with Sheppard, Hartwick, and Warshaw (1988)pointing out the necessity of extending the Ajzen and Fishbein models to consider alternatives given that, when only the product of interest is measured, part of the consumers’decision-making process concerning competing alternatives is overlooked. Accordingly, this research makes a meaningful contribution to the literature con-sidering afirst product and a product alternative. Therefore, taking into account that consumer behaviour theories posit that the product asso-ciated with the most positive attitude will be chosen (Steenkamp, 1997), attitudes towards two products which can be seen as alternatives —or even substitutes because of the lack of differentiation according to consumers’perceptions — may induce suppressor effects and create conflicting roles. We propose that when the evaluative judgments about afirst product are positive, this creates a feeling that should positively influence the consumption of thisfirst product. Conversely, we also argue that positive attitude towards a product alternative may lead to a lower consumption of thefirst product. Accordingly, the hypotheses are defined as follows:
H1a. Consumption of thefirst product increases with positive atti-tude towards this product.
H1b. Consumption of thefirst product decreases with positive atti-tude towards the product alternative.
Steenkamp (1997)states that the perceptions’integration of each alternative is the basis for a person’s attitude toward a concrete alter-native, and perceptions are formed by descriptive, informational and inferential processes (Fishbein & Ajzen, 1975; Steenkamp, 1990). A theme highlighted in the consumer behaviour literature is that of in-formational perceptions, which contribute to the formation and chan-ging of beliefs and attitudes (Fishbein & Ajzen, 1975; Steenkamp, 1997). Therefore, knowledge is recognised as an internal variable which influences consumers’assessment of the products (Ajzen, 2001), but it may also directly influence the intention to purchase (Gracia & De Magistris, 2007) and even consumption, given that knowledge allows
consumers to associate a food’s attributes with the consequences of consuming it (Wansink, Westgren, & Cheney, 2005). Specifically, the objective or actual knowledge is described as that which an individual has stored in his/her memory (Brucks, 1985). Scholars acknowledge the key role played by this factor (e.g. Wilcock et al., 2004; Rodríguez-Entrena, Salazar-Ordóñez, & Sayadi, 2013; Rodríguez-Entrena & Salazar-Ordóñez, 2013) but also emphasise the impact of the so-called subjective or self-perceived knowledge (e.g.House et al., 2004). The latter refers to consumers’self-perception about how much they think they know (Brucks, 1985). Some of the literature (e.g. Kalogeras, Valchovska, Baourakis, & Kalaitzis, 2009; Yangui, Costa-Font, & Gil, 2014) points out that the more information consumers have, the higher the value they attach to the features of high quality products and the higher the price they are willing to pay for it; so, knowledge may contribute to the differentiation process for agri-food products. There-fore, the proposed hypotheses are the following:
H2a. A high level of knowledge increases consumers’positive atti-tude towards thefirst product.
H2b. A high level of knowledge decreases consumers’positive atti-tude towards the product alternative.
H2c. A high level of knowledge increases consumption of thefirst product.
The concept of inferential formation (Olson, 1978) refers to con-sumers using previously learned information (termed informational perceptions) to establish relationships between the products’attributes, other beliefs and outcomes, through an inferential process. Brand is one of the main cues in this process since it impacts on other perceptions of the products (Mitchell & Olson, 1977). In an attempt to understand the effects of branding activities, brand equity has become a core concept in the marketing literature from 90’s. The notion of brand equity has been influential sinceAaker (1991)published his seminal work based on a cognitive psychology perspective. The facet of brand equity related to consumer behaviour, called consumer-based brand equity, represents assets and liabilities, i.e. the value linked to a brand by the customer and its consequences (Aaker, 1991; Keller, 1993). Other definitions (e.g.Srivastava & Shocker, 1991) also highlight the fact that consumers’ utility from the consumption of the brand comprises an incremental value derived from non-functional utilities, called experiential, sym-bolic or subjective antecedents. Consequently, it is assumed that brand equity influences, first, consumer attitudes and, second, it may also directly affect consumption since, according to Keller (1993), brand equity dimensions drive purchase or consumption decisions. Accord-ingly, a wide range of literature establishes a direct influence between brand equity and purchase decisions, such as the key study by Cobb-Walgren, Ruble, and Donthu (1995). Indeed,Aaker (1991)argues that brand equity can provide reasons to buy but can also reduce the in-centive to try others. One of the most well-known approaches in this regard is that ofAaker (1991), who identifies four main dimensions of brand equity: brand awareness, or the extent to which a brand is re-cognised or recalled; brand associations, whose meaning is linked to the representations triggered by a brand; brand loyalty, which is related to the consistent purchase of a brand over time; and perceived quality, which is the consumer’s perception of brand quality superiority. Like-wise, consumer-based brand equity refers to attachments to a brand that can be built beyond the product attributes and even have no in-herent value (Keller & Lehmann, 2006), but can be assumed to infl u-ence consumer attitudes. Therefore, we assume that the brands’effects in a product directly depend on the positive or negative perception of consumers regarding those brands. However, there is a lack of studies related to the effects from brands in the choice of other products. In light of the above, the resulting hypotheses are:
H3a. The brand equity of the leading brands traditionally associated with the product alternative decreases consumers’positive attitude
towards thefirst product.
H3b. The brand equity of the leading brands traditionally associated with the product alternative increases consumers’positive attitude towards the product alternative.
H3c. The brand equity of the leading brands traditionally associated with the product alternative decreases consumption of the first product.
Finally, we hypothesise that the attitude towards the product itself has a higher impact on consumption than the attitude towards the product alternative. We also suggest that knowledge is more relevant than brand equity in explaining the attitudes and consumption. Thus, the hypotheses are:
H4a. Attitude toward thefirst product have a higher impact than attitude toward the alternative product on the consumption of the first product.
H4b. Knowledge has a higher impact than the brand equity of leading brands traditionally associated with the alternative product on the attitude towards thefirst product.
H4c. Knowledge has a higher impact than the brand equity of leading brands traditionally associated with the product alternative on the attitude towards the product alternative.
H4d. Knowledge has a higher impact than the brand equity of leading brands traditionally associated with the product alternative on the consumption of thefirst product.
3. Material and methodological approach
3.1. Olive oil as a striking example of product differentiation failures
Olive oil markets were selected as case study because in Spain they represent a paradigmatic example of a complex and mature agri-food market, where products that differ in term of intrinsic features become undifferentiated. To understand olive oil markets, it should be pointed out that the olive oil categories (European Commission, 2012) are as follows:“virgin olive oil”,“extra virgin olive oil”(EVOO) and“olive oil - composed of refined olive oils and virgin olive oils”(ROO1). These categories differ from each other in terms of quality, composition and organoleptic properties, especially when comparing the ROO category and the EVOO category. ROO is obtained by blending a refined olive oil, given that it is a colourless product and has neitherflavour nor aroma, with a small but non-regulated percentage of virgin olive oil2. EVOO is a category obtained directly from olives and it maintains its healthy (e.g. it contains polyphenols) and organoleptic (e.g. taste, aroma, etc.) properties. Despite those differences, consumers’common perception is of“olive oil”as a general term covering the whole range of categories, so EVOO and ROO could be considered even as substitute products by some consumers. Indeed, Torres-Ruíz, Vega-Zamora, and Gutiérrez-Salcedo (2012)highlight the widespread confusion about the different types of olive oils and their qualities, which leads to competitive dis-advantages for EVOO. This may lead to a blurring of the perception of the specific features, thus preventing consumers from optimising their product choices.
In Spain, which is the top olive-oil producer worldwide (IOC, 2015) and where olive oil is a daily consumption product, ROO is the top-selling type of oil, with a 60% market share (MAGRAMA, 2015). In-deed, data from the Spanish Ministry of Agriculture, Food and En-vironment (MAGRAMA, 2015) suggests an increasing tendency to substitute EVOO with ROO in recent years. This could be a sign of
1Here, we use ROO instead of the legal category“olive oil - composed of refined olive oils and virgin olive oils”to make the distinction from EVOO and the generic term“olive oils”clear to readers.
2There is no regulation on either the minimum percentage levels of virgin and/or extra
consumers’lack of differentiation between the features that are specific to each category. Obviously, according to economic theory, relative price gaps between the products (Shepherd, 2011) could also go some way to explaining consumers’preference for ROO, since price is also an extrinsic cue used for evaluating product alternatives (Monroe, 1982). However, the price gap between EVOO and ROO has been, on average, around€0.35 kg−1since 2007/2008 (MAGRAMA, 2015), which can be
considered a narrow gap compared to the quality gap. Indeed, the si-milarity in price may reinforce consumers’ perception of un-differentiated products; if there is no price gap, consumers may not perceive the higher quality of the more expensive product, due to a phenomenon referred to as“price-reliance schema”(Peterson & Wilson, 1985).
3.2. Data and method
To assess the proposed model, we employed data from a ques-tionnaire and applied structural equation modelling (SEM) by means of partial least squares (PLS) (Wold, 1979).
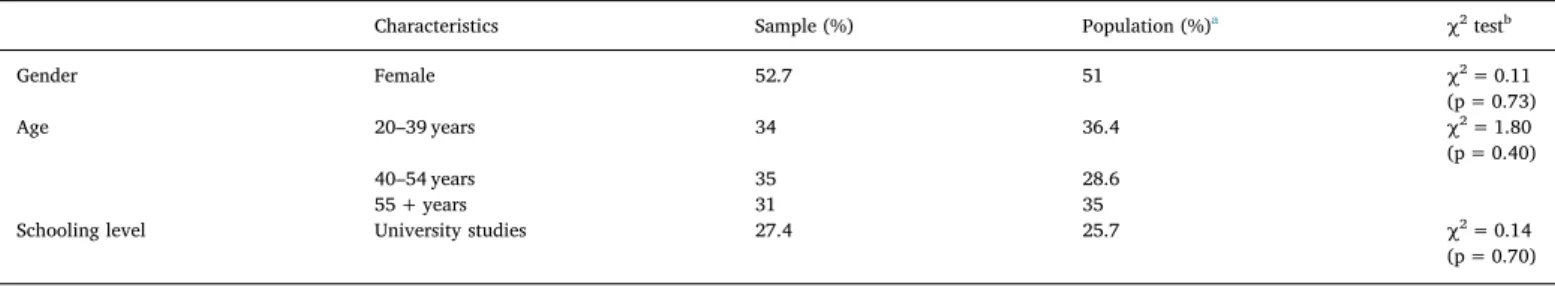
Regarding the questionnaire, it was structured into several sections and administered online from January to September 2016 to 700 reg-ular buyers from a panel at the household level who were over 19 years old. The sample was selected from big cities–more than 100,000 in-habitants–which comprise 37% of the population (INE, 2015) in the Andalusia region (southern Spain). Small (< 20,000 inhabitants) and medium-sized cities (between 20,000 and 100,000 inhabitants) were discarded since most of them are in olive oil producing areas and our focus was on the ordinary urban consumers. Two pre-tests (each ap-plied to 8% of the sample) werefirst carried out to detect potential biases in comprehension (one with face-to-face surveys and the other using a web-based survey). The sampling was controlled by age and schooling according to Andalusian regional data (INE, 2015) to avoid the underrepresentation of some groups (older people and those with a lower level of schooling, see Table A1 Appendix A) that could arise when using online panels.
The collected data were measured on a differentiated basis for consumption, attitudes, knowledge and brand equity variables (see Table A2 Appendix A).
Consumption was intended to be characterized as an objective be-haviour-related latent variable by means of the self-reported actual consumption in quantities and habits. Therefore, it was composed of two observable variables. In order to build the first one (Cn1),
in-formation on the size of the pack and the frequency of purchase of EVOO and ROO as well as of seed oils was requested, by doing so we avoided bias in the consumers’decision making process for not con-sidering competing product alternatives (Sheppard et al., 1988). Then, the relative amount of EVOO (compared to the total oil) used per capita on a monthly basis for each household was estimated. Second, re-spondents were asked about the number of days per week that each type of the abovementioned oils were used during breakfast, lunch or dinner, in order to estimate a measured which displays the relative importance of EVOO in the weekly uses per household (Cn2) compared
to the total uses. Consumption was considered a composite latent variable given that it was thought up as a human-designed artifact (Henseler, 2017); specifically, it is a compound index built to measure those aspects of consumer behaviour. Consequently, the uses of the product define the consumption.
Questions on the eight observable variables concerning the attitudes towards the two products were asked using 7-point Likert scales (1 indicating the lowest level and 7 the highest). Both the observed vari-ables (Thorsdottir et al., 2012) and the measurement scales (Aaker & Williams, 1998) have been validated by the existing psychometric lit-erature as reflective or common factor latent variables.
Knowledge was measured by means of an indirect approach using both actual or objective knowledge and self-perceived or subjective knowledge. Thus, it was conceptualised with respect to these two
dimensions and designed using a second-order latent variable. In this regard, we extend here earlier studies by creating variables that capture the overall impacts; in doing so, we consider that a conceptual dis-tinction must be made between actual or objective knowledge and self-perceived or subjective knowledge (Park & Lessig, 1981; Brucks, 1985), due to the fact that they affect consumer decision-making processes and behaviour differently. In the actual knowledge dimension, the number of right answers given in the test represented an index of knowledge (Johnson & Russo, 1984); however, to get a more accurate measure of this dimension, the answer“I am not sure”was also introduced and two questions were validated by subsequently asking an open-ended ques-tion (Ak14,15). The subjective or self-perceived knowledge dimension
was measured not only by inquiring about how knowledgeable the consumer is about olive oil, but also by asking a key question: do in-terviewees know what the refining process does? The latter represents a higher degree of interviewees’self-perception of their own knowledge. Taking into account the characteristics of these two types of knowledge, a composite-composite higher-order latent variable was proposed, since the knowledge dimensions contributed to the overall knowledge latent variable and the relationship between those dimensions could be weak (seeMägi & Julander, 2005) or even non-significant (seeEllen, 1994). Brand equity was conceptualised as an overall picture of the brand credence made up of its different dimensions (Yoo & Donthu, 2001), so an indirect approach was also followed, applying a second-order latent variable. Yoo, Donthu, and Lee (2000) and Yoo and Donthu (2001) warn that in order to measure brand equity, the dimensions cannot be measured as a simple average, whileWashburn and Plank (2002) ar-gued that brand equity may be considered as a higher order model. In line with Yoo et al. (2000), who develop a multidimensional brand equity scale with brand awareness and brand association grouped to-gether since they are said to represent the same underlying concepts, only three dimensions were taken into account: brand awareness/as-sociations, brand perceived quality, and brand loyalty. Observable variables were measured by means of a 7-point Likert-scale (1 to in-dicate the lowest level and 7 the highest). All the dimensions were analysed via questions about leading brands traditionally linked to the ROO category. Specifically, we used the four most well-known leading brands, whose market share is 26% (Alimarket, 2015), with inter-viewees indicating which ones were the most consumed, known, or preferred. We modelled brand equity as a reflective-reflective second-order latent variable since we expected both the observable andfi rst-order latent variables to fulfilJarvis, MacKenzie, and Podsakoff(2003) criteria for reflective measurement theory.
Finally, PLS path modelling was used to test the hypotheses. This technique enables the estimation of structural models – also called inner models–with unobservable or latent variables, by means of ob-servable ones that make up the measurement or outer model (Chin, 1998). PLS path modelling is a suitable tool to estimate the overall relationships in our model since it allows mixed models with both re-flective latent variables, which are caused by their observable variables, and composite ones, which are made up of the related observable variables (Henseler, 2017). Also, in order to avoid a potential bias in PLS path modelling when dealing with a reflective paradigm, the well-knownconsistency at large(Lohmöller, 1989), the common factors were calculated by means of consistent PLS (Dijkstra & Henseler, 2015).
variables with composites. Therefore, the scores of thefirst-order latent variables were obtained by means of the saturated model, adapting the idea of capturing the total effects of the model presented inBecker, Klein, and Wetzels (2012) and van Riel et al. (2017). In addition, to establish the existence of the second-order constructs, the convergence of thefirst-order dimensions was tested.
The existence of significant differences between PLS parameter es-timates was also explored based onRodríguez-Entrena, Schuberth, and Gelhard’s (2018)approach3, so we extended thefindings of the struc-tural model by ranking notable factors in consumer behaviour.
In spite of the possibilities offered by PLS, to the authors’ knowl-edge, no previous studies about consumer behaviour in markets with product differentiation issues apply variance-based SEM, and very few of them use covariance-based SEM models (e.g. Espejel, Fandos, & Flavián, 2008) in olive oil markets.
4. Results
Second-order latent variables need to fulfil measurement model requirements (Edwards, 2001) in order not to be questioned. According toChin (1998), the reflective or common factor measurement variables are assessed in terms of both reliability and validity, while composite ones are checked for sign, size and significance, as well as the absence of multicollinearity (Henseler, 2017). The statistics used to confirm the validity of the second-order latent variables are summarised inTable 1. The second-order latent variables measurement model yielded a good performance. Only one criterion was not completely fulfilled due to a loading of 0.683.Carmines and Zeller (1979)propose a loading of over 0.707 as a criterion for acceptance, butChin (1998)relaxes this threshold for a scale in the early stages of development, accepting loadings over 0.6. The scales in this research are at an early stage of development due to the lack of previous empirical research about olive oil, and, in any case, Ba19was significant (p < 0.001), as established
by Cenfetelli and Bassellier (2009). Regarding composite measures, they were all significant and did not present multicollinearity issues. Therefore, the conceptualisation of knowledge and brand equity as a second-order construct facilitated the capture of all the effects derived from the complex components which made up those dimensions, and ensured that relevant theoretical components were not lost while still estimating a parsimonious model.
Once the properties of the measures for the second-order latent variables had been assessed, the inner model was also tested using the same statistics as above. The results are shown inTable 2, where it can be observed that the measurement model complied with all the re-quirements of a good inner model specification.
Then, to assess the nomological validity of our hierarchical model, the parameters and their respective significances were estimated. The results are reported inTable 3.
Thefirst importantfinding refers to the role played by consumers’ attitude towards both the first product and the product alternative, which was shown to increase (H1a) and reduce (H1b), respectively, the relative consumption of thefirst product. The former is in line with both existing theoretical frameworks about consumer behaviour, such as those of Ajzen (1991) and Steenkamp (1997)mentioned above, and prior research, e.g.Saba and di Natale (1998). The latter means that attitude towards a product alternative does shape consumers’purchase decisions regarding thefirst product, thus driving the consumption of a product with different intrinsic features and higher objective quality. To the best of the authors’knowledge, no empirical studies to date have analysed that relationship, but it confirms the theoretical approach of Steenkamp (1997). The variance explained by the model in terms of adjusted R2 was 0.46 for consumption, a good figure for consumer behaviour studies, where Falk and Miller (1975) set the lowest
recommended level at 0.10. The effect size showed a medium-large effect from the attitude towards thefirst product and a small-medium one from the attitude towards the product alternative, a result further confirmed by the test of the differences between path coefficient esti-mates (H4a)–since the confidence interval of the difference did not contain zero.
It is also worth noting that knowledge influenced the consumers’ judgment about EVOO (H2a) and their consumption (H2c). This re-lationship was as expected given that greater knowledge about olive oils contributed to positive feelings about EVOO and its consumption, which showed a medium-large and a small effect size, respectively. That is consistent with previous studies such asKalogeras et al. (2009) orMtimet, Zaibet, Zairi, and Hzami (2013), and also supports the re-sults of Yangui et al. (2014), who find changes in consumers’ pre-ferences in olive oil markets when they have more information. How-ever, knowledge is unlikely to affect the attitude towards the product alternative (H2b).
The results also allowed us to confirm that the higher the brand equity of the product alternative leading brands, the better the attitude towards the product alternative (H3b). Thisfinding was as expected and similar to those revealed in studies for different products and ser-vices, such asCobb-Walgren et al. (1995). On the contrary, although the brand equity did have an impact on shaping attitude towards the first product (H3a) and its consumption (H3c), this impact was small.
Finally, since the 99% confidence intervals did not contain zero, significant differences can be highlighted between the estimated im-pacts of knowledge and brand equity on these attitudes. Specifically, knowledge had a stronger effect on attitude towards EVOO than brand equity did (H4b). However, we also expected knowledge to exert a significant and stronger influence than brand equity on the attitude Table 1
Measurement model: Indicators’loadings or weights and construct reliability for second-order latent variables.
Ci/Xi Loadings/Weights
b
α ρx ρa AVE
Actual Knowledge, C4,1ξ,a n.a. n.a. n.a. n.a.
Ak11 0.38
Ak12 0.28
Ak13 0.23
Ak14 0.41
Ak15 0.38
Self-perceived Knowledge, C4,2ξ,a n.a. n.a. n.a. n.a.
Sk16 0.69
Sk17 0.61
Brand awareness/associations, C5,1ξ,c
0.82 0.84 0.82 0.62
Ba18 0.78
Ba19 0.68
Ba20 0.88
Brand quality, C5,2ξ,c 0.83 0.84 0.84 0.64
Bq21 0.85
Bq22 0.82
Bq23 0.71
Brand loyalty, C5,3ξ,c 0.87 0.84 0.84 0.64
Bl24 0.87
Bl25 0.87
Bl26 0.75
Note: n.a. means not applicable. Source: Authors’elaboration.
ξExogenous Latent Variable. aVariance In
flation Factors (VIF) among indicators within each construct is under 3.3 (Diamantopoulos & Siguaw, 2006).
bAll the loadings and weights are signi
ficant at p < 0.001 based on a two-tailedt-test for t(4999)except for Ak13, which was significant at p < 0.002.
cHeterotrait-monotrait ratio of correlations–HTMT–(Henseler, Ringle, & Sarstedt,
2015): C5,1and C5,2= 0.77; C5,1and C5,3= 0.80; C5,2and C5,3= 0.74.
towards ROO, but, contrary to expectations, knowledge did not have an impact on ROO attitude whereas brand equity showed a marked and significant effect (H4c). In addition, there were no differences in how knowledge and brand equity influenced consumption (H4d).
The explained variance accounted for the attitude towards EVOO was 0.25 (adjusted R2) and 0.26 (adjusted R2) for attitude towards
ROO, showing good predictive power, as mentioned above. Indeed, it is worth pointing out that only two latent variables—knowledge and brand equity—were able to explain these levels of variance in con-sumer attitude, making them core drivers in a parsimonious model. Furthermore, according toFalk and Miller (1975), this type of parsi-monious model is more powerful than the broad application of a “shotgun”. In addition, the relative predictive power of the endogenous reflective latent variables (C2and C3), measured by Stone-Geisser’s Q2
value (omission distance of 6), was over 0, showing a good predictive power in the model (Stone, 1974).Appendix Bcontains the correlation matrix for the latent variables, considering the second order latent variables.
5. Discussion
Several implications stem from this study. First, we provide em-pirical evidence that attitudes towards both products become a positive or negative evaluative judgment of the overall purchase situation. Therefore, attitude toward product alternatives is a meaningful pre-dictor of actual consumption, particularly in those agri-food markets where consumers’ may have difficulties differentiating between pro-ducts that are heterogenous in terms of intrinsic features but more homogeneous in term of uses. The consumers may perceive that all the products in question (olive oils) have similar or interchangeable fea-tures, added value and culinary uses to those corresponding to the higher quality product (EVOO), making price elasticity of demand higher and increasing the substitution effect. According to our model, those perceptions partially stem from the consumers’lack of knowledge Table 2
Measurement model: Indicators’loadings or weights and construct reliability.
Ci/Xi Loadings/
Weightsa
α ρx ρa AVE
Consumption, C1η,b n.a. n.a. n.a. n.a.
Cn1 0.57
Cn2 0.49
Attitude to thefirst product, C2η,c
0.85 0.85 0.85 0.58
Aproduct
3 0.76
Aproduct
4 0.78
Aproduct
5 0.77
Aproduct
6 0.74
Attitude to the product alternative, C3η,c
0.9 0.9 0.9 0.69
Aalternative
7 0.86
Aalternative
8 0.79
Aalternative
9 0.84
Aalternative
10 0.83
Knowledge, C4ξ,b n.a. n.a. n.a.
Ak-C4,1 0.86
Ak-C4,2 0.26
Brand equity to the product alternative, C5ξ,c
0.855 0.855 0.859 0.664
Ba-C5,1 0.86
Bq-C5,2 0.83
Bl-C5,3 0.74
Note:n.a. means not applicable. Source:Authors’elaboration.
ηEndogenous Latent Variable. ξExogenous Latent Variable. aAll the loadings and weights are signi
ficant at p < 0.001 based on a two-tailedt-test for t(4999)except C4,2which was significant at p < 0.01.
bVariance In
flation Factors (VIF) are under 3.3 (Diamantopoulos & Siguaw, 2006). cHeterotrait-monotrait ratio of correlations–HTMT–(Henseler, et al., 2015): C2and
C3= 0.12; C2and C5= 0.21; C3and C5= 0.51.
Table 3
Path coefficients and significance test.
Hypotheses Path coefficients Percentile bootstrap 0.5% Percentile bootstrap 99.5% Hypothesis results f2,a
Attitudeproduct→Consumption H1a 0.41*** (0.033)
0.32 0.52 Supported 0.24
Attitudealternative
→Consumption H1b −0.27*** (0.033)
-0.36 -0.17 Supported 0.10
Knowledge→Attitudeproduct H2a 0.46*** (0.034)
0.37 0.54 Supported 0.27
Knowledge→Attitudealternative H2b 0.06n.s. (0.036)
−0.02 0.15 Not supported
Knowledge→Consumption H2c 0.12** (0.037)
0.02 0.21 Supported 0.02
Brand equity→Attitudeproduct H3a −0.13** (0.040)
−0.23 −0.02 Supported 0.02
Brand equity→Attitudealternative H3b 0.46*** (0.033)
0.42 0.61 Supported 0.35
Brand equity→Consumption H3c −0.17*** (0.040)
−0.28 −0.07 Supported 0.04
Coefficient differences Δ Attitudeproduct
→Consumption, Attitudealternative
→Consumption
H4a 0.15** (0.054)
0.03 0.24 Supported
Δ Knowledge→Attitudeproduct, Brand equity→Attitudeproduct
H4b 0.32*** (0.062)
0.16 0.48 Supported
Δ Knowledge→Attitudealternative, Brand equity→Attitudealternative
H4c 0.46*** (0.042)
0.34 0.56 Opposite supported
Δ Knowledge→Consumption, Brand equity→Consumption
H4d −0.05n.s (0.058)
−0.20 0.09 Not Supported
Note:***p < 0.001;**p < 0.01;*p < 0.05; n.s. non-signi
ficant–based on a two-tailedt-test for t(4999)from a bootstrapping technique. Note:Standard errors in brackets.
Note:Variance Inflation Factors (VIF) of each set of predictor construct for each subpart of the model are under 3.3 (Diamantopoulos & Siguaw, 2006). Source:Authors’elaboration.
aAccording toCohen (1988), f2values of 0.02, 0.15 and 0.35 result in small, medium and large e
and the brand equity performance of leading brands associated with a product alternative.
The differential impact of consumers’information about the product to explain the attitudes towards the products may provide an indication of the depicted baseline scenario. Consequently, the more knowledge-able consumers appear to be more aware of the beneficial intrinsic features of the product with the highest objective quality (EVOO), which is also reflected in its consumption. Therefore, assuming that consumers make an overall evaluation of the products according to their perceptions, they positively assess EVOO because of its features but do not negatively judge the product alternative, ROO. Instead, they simply recognise the substantial differences between the two types of products, and probably even consider them to be differentiated pro-ducts which can, depending on the context, share a relationship of complementarity. Indeed, ROO can be seen as a superior alternative to any seed oil for several culinary uses.
The Italian olive oil markets provide a good comparison to highlight how consumer behaviour differs substantially in the Spanish market. Specifically, the better-informed consumers in the Italian market, who are able to maximise the utility of their choices, could explain the po-larised Italian domestic demand towards EVOO. This leads to a relevant price gap between the two types of olive oil– €1.90 kg−1for the last
three years (average price at origin of€4.20 kg−1and€2.28 kg−1for
EVOO and ROO) (European Commission, 2017).
Regarding brand equity, this study also provides evidence that consumers’inferences made from informational stimuli, embodied in a conventional branding construct, are key to explaining not only the attitude about the product the brand is associated with, but also to shaping attitudes regarding other options available in the marketplace and their consumption. This is a notablefinding from which it can be inferred that a share of consumers may trust that the leading brands have specific attributes, for example quality in a broad sense, which EVOO could not be able to offer compared to the traditional ROO en-dorsed by brand equity. Hence, companies with established credibility, reputation and high perceived brand equity may succeed in building distinctive brands which go beyond an objective assessment of the quality of other products and, as occurs in our case, hampering an ef-fective differentiation by quality. This is particularly applicable when products seem to share features of substitutability for consumers, making the development of brand equity a crucial factor for shaping consumer decisions since alleviates the issue of asymmetric information by means of the brands as a strategic and salient quality cue.
At institutional level, there have been several attempts with the aim of addressing this situation by means of different reformulations of the labelling regulations. The latest modifications to European Union (EU) regulations (European Commission, 2012) sought to shed more light on the distinction between the qualities of the olive oil categories, re-formulating the labelling scheme to guarantee that the products do in fact possess clear differentiated values. The EU labelling regulation stipulates that products must include a description of the category, pointing out which olive oils are obtained directly from olives and so-lely by mechanical means (EVOO) and which have undergone a refining process and then are blended with oils obtained directly from olives (ROO). Furthermore, regarding EVOO, marketers can make explicit reference to some positive features such as taste (fruity, bitter and pungent). However, two main issues arise. First, a high level of knowledge is needed to discern what the label is truly indicating with those explanations about the production processes, whereas consumers’ related knowledge nowadays is scarce (Cabrera, 2016). In addition, a substantial number of consumers do not understand what a refining process involves, despite conditioning drastically the products’intrinsic quality features, and conceptualise it as a valuable procedure to obtain a purer olive oil. Second, ROO brands continually use taste references– e.g.“mild” –as a marketing strategy and that could be another source of confusion for consumers, contributing to the difficulty in diff er-entiating between categories. Indeed, consumers are used to seeing the
abovementioned “mild” reference on the labels, but not the others quality claims related to a fruity, bitter or pungent taste, which have recently come to be used as an information source of differentiation. Furthermore, these informational stimuli related to taste adjectives such as bitter or pungent could evoke negative attributes, being even counter-productive, for an untrained consumer, although they are ex-clusively based on technical parameters about the organoleptic quality. Consequently, the labels may not fulfil their role as a basic source of information to combat the issue of asymetric information, especially considering that no indication is given on the label about the amount of virgin olive oil that is blended to produce ROO, since this percentage is not regulated. In fact, according toMarano-Marcolini and Torres-Ruíz (2017)this poor categorisation hinders consumer learning and choices, and for many years has even influenced commercial strategies in the olive oil sector, showing not to be sufficient to avoid misleading con-sumers as to the real characteristics of virgin oils.
In light of this situation, from a managerial point of view, the co-operative sector should focus its strategy on both increasing consumers’ knowledge and creating consumer-based brand equity for the product with the highest objective quality, EVOO. On the contrary, promotional initiatives may not work and may even be detrimental because of the product undifferentiation (Barjolle and Sylvander, 2002). Consumer training about differential features of the products, mainly production processes and organoleptic profiles, becomes instrumental in order to understand labels and differentiate qualities accordingly. In this regard, the greatest challenge is to set up joint investments by the cooperative sector and to encourage regional governments’support as an agent of change through the policy-making process. At the same time, the co-operative sector should start by reducing the high number of EVOO brands through integration processes, given that thefirst step to en-hancing product differentiation is building brand awareness (Aaker, 1991), which can be hampered by the numerous EVOO brands be-longing to small cooperatives. Brand equity may be a driving force in gaining a competitive advantage by contrasting brands’personalities. In the medium-term, thefirst step may be to contrast between leading EVOO and ROO brands by means of common trademarks around which to build brand equity, and, later, between different EVOO brands. A hybrid strategy involving both key factors simultaneously could even be developed, so that the creation of EVOO brand equity is underpinned by the consumer training about quality in olive oils, thus creating positive expectations of the product.
6. Conclusions
This study attempts to contribute to the development of a theore-tical framework for agri-food markets with differentiation failures. We develop a theoretical model and perform an empirical application in order to analyse consumption patterns. Theoretical model is focused on product knowledge, together with product alternative’s brand credence and attitudes; and the empirical application is tested on olive oil mar-kets, considering that different products (EVOO and ROO) in term of intrinsic features may become undifferentiated. We conclude that the effect of product alternatives is key to explaining consumer behaviour in such markets, given that the attitude towards a product alternative has a relevant impact on the consumption of the foodstuffin question. At the same time, our results provide evidence that product knowledge and the brand equity of the leading brands of the alternative product have a predictive relevance for the attitudes.
is conditioned by the features of each agri-food market, given the specificities of the olive oil sector and the cultural context of the con-sumers where the study has been developed. Thus, aprioristic assess-ment of those predictors in other agri-food markets should not be done with the aim of generalising the findings, while there is no enough critical mass of researching to support it.
Acknowledgements
This work was supported by the INIA (National Institute of Agricultural Research) and MINECO (Ministerio de Economía y Competitividad) as well as by the European Union through the ERDF-European Regional Development Fund 2014–2020 “Programa Operativo de Crecimiento Inteligente” [research project RTA2013-00032-00-00 (MERCAOLI)].
Appendix A.
Table A1andTable A2
Table A1
Descriptive analysis of sample and population.
Characteristics Sample (%) Population (%)a χ2testb
Gender Female 52.7 51 χ2= 0.11
(p = 0.73)
Age 20–39 years 34 36.4 χ2= 1.80
(p = 0.40)
40–54 years 35 28.6
55 + years 31 35
Schooling level University studies 27.4 25.7 χ2= 0.14
(p = 0.70)
Source:Authors’elaboration. aData from the Census (INE, 2011).
Table A2
Latent and observable variables.
Latent Variables Observable Variables Source
Adapted from
Consumption (C1)η –Referring to EVOO
Cn1: Relative consumption of EVOO Cn2: Relative uses for cooking with EVOO
Saba and di Natale (1998)
Attitude to thefirst product (C2)η
–Referring to EVOO
Aproduct
3 : The degree to which you need EVOO is… Aproduct
4 : The degree to which you feel EVOO is good for you Aproduct
5 : The degree to which you would recommend EVOO is….… Aproduct
6 : The enjoyment you get from the consumption of EVOO is…
Thorsdottir et al. (2012)
Attitude to the product alternative (C3)η
–Referring to ROO
Aalternative
7 : The degree to which you need ROO is… Aalternative
8 : The degree to which you feel ROO is good for you Aalternative
9 : The degree to which you would recommend ROO is….… Aalternative
10 : The enjoyment you get from the consumption of ROO is…
Knowledge (C4)ξ
Actual knowledge (C4,1)ξ Ak11: ROO is the superior category of olive oils Fotopoulos and Krystallis (2001); Torres-Ruíz et al. (2012) Ak12: The taste of EVOO is always strong and bitter
Ak13: ROO contains refined olive oil plus EVOO Ak14: I know at least one olive oil variety (name it)
Ak15: I know at least one olive oil Protected Designation of Origin (name it) Self-perceived knowledge
(C4,2)ξ
Sk16: How knowledgeable are you about the features of and matters concerning olive oil?
Brucks (1985); House et al. (2004)
Sk17: Do you know what the refining process does?
Brand equity (C5)ξ
–Referring to ROO
Brand awareness/ associations (C5,1)ξ
Ba18: I can recognize (leading brand) among other competing brands [including my brand]
Ba19: When I think of olive oil brands, I have no difficulty in imagining (leading brand) in my mind
Ba20: I am aware of (leading brand) standing out among other competing brands [including my brand]
Yoo and Donthu (2001)
Brand perceived quality (C5,2)ξ
Bq21: The likelihood that (leading brand) quality will never disappoint me [in comparison to alternative brands including my brand] is…
Bq22: The likely image of quality of (leading brand) [in comparison to alternative brands including my brand] is…
Bq23: (Leading brand) has a higher quality in comparison to alternative brands including my brand…
Brand loyalty (C5,3)ξ
Bl24: The likelihood that (leading brand) is a purchase choice is…
Bl25: I would recommend my family and friends to buy (leading brand) among other competing brands
Bl26: Even when another brand is cheaper, I would prefer the (leading brand)
Appendix B.
Table B1
References
Aaker, D. A. (1991).Managing brand equity: Capitalizing on the value of a brand name.New York, EEUU: Free Press.
Aaker, J., & Williams, P. (1998). Empathy versus pride: The influence of emotional ap-peals across cultures.Journal of Consumer Psychology, 25(3), 241–261.
Ajzen, I. (1991). The theory of planned behavior.Organizational Behavior and Human Decision Processess, 50(2), 179–211.
Ajzen, I. (2001). Nature and operation of attitudes.Annual Review of Psychology, 52, 27–58.
Ajzen, I., & Fishbein, M. (1980).Understanding attitudes and predicting social behavior.
Englewood Cliffs, New Jersey: Prentice-Hall.
Alimarket (2015Alimarket, 2015Alimarket, 2015). Aceite de oliva: Deoleo y Dcoop apuntan a un nuevo estadio internacional.Alimarket Revista, 290, 117–138. Aprile, M. C., Caputo, V., & Nayga, R. M. (2012). Consumers’valuation of food quality
labels: The case of the European geographic indication and organic farming labels.
International Journal of Consumer Studies, 36(2), 158–165.
Bagozzi, R. P., & Dholakia, U. (1999). Goal setting and goal striving in consumer beha-vior.Journal of Marketing, 63(Special Issue), 19–32.
Barjolle, D., & Sylvander, B. (2002). Some factors of success for origin labelled products in agri-food supply chains in Europe: Market, internal resources and institutions.
Économies et Sociétés, 25, 1–21.
Becker, J. M., Klein, K., & Wetzels, M. (2012). Hierarchical latent variable models in PLS-SEM: Guidelines for using reflective-formative type models.Long Range Planning, 45(5–6), 359–394.
Breckler, S. J. (1984). Empirical validation of affect, behavior, and cognition as distinct components of attitude.Journal of Personality and Social Psychology, 47(6), 1191–1205.
Brucks, M. (1985). The effects of product class knowledge on information search beha-vior.Journal of Consumer Research, 12(1), 1–16.
Cabrera, E. R. (2016).Análisis de la actitud del consumidor andaluz hacia las categorías de aceite de oliva. factores que dificultan su diferenciación por calidades.Córdoba, Spain: UCOPress.
Carmines, E. G., & Zeller, R. A. (1979).Reliability and validity assessment.California, EEUU: SAGE Publications.
Cenfetelli, R. T., & Bassellier, G. (2009). Interpretation of formative measurement in in-formation systems research.MIS Quartely, 33(4), 689–707.
Chin, W. W. (1998). The partial least squares approach to structural modeling. In G. A. Marcoulides (Ed.).Modern Methods for Business Research(pp. 294–336). Mahwah, New Jersey: Lawrence Erlbaum Associates.
Cobb-Walgren, C. J., Ruble, C. A., & Donthu, N. (1995). Brand equity, brand preference, and purchase intent.Journal of Advertising, 24(3), 25–40.
Cohen, J. (1988).Statistical power analysis for the behavioral sciences(2nd Edition). New Jersey, EEUU: Lawrence Erlbaum Associates.
Deaton, A., & Muellbauer, J. (1980).Economics and consumer behaviour.Cambridge, England: Cambridge University Press.
Diamantopoulos, A., & Siguaw, J. A. (2006). Formative versus reflective indicators in organizational measure development: A comparison and empirical illustration.British Journal of Management, 17(4), 263–282.
Dickson, P. R., & Ginter, J. L. (1987). Market segmentation, product differentiation, and marketing strategy.Journal of Marketing, 51(2), 1–10.
Dijkstra, T. K., & Henseler, J. (2015). Consistent partial least squares path modeling.MIS Quarterly, 39(2), 297–316.
Edwards, J. R. (2001). Multidimensional constructs in organizational behavior research: An integrative analytical framework.Organizational Research Methods, 4(2), 144–192. EFSA (2010). Special Eurobarometer 354. Food-related risk. Brussels, Belgium: European
Food Safety Authority.
Ellen, P. S. (1994). Do we know what we need to know? Objective and subjective knowledge effects on pro-ecological behaviors.Journal of Business Research, 30(1), 43–52.
Espejel, J., Fandos, C., & Flavián, C. (2008). The Influence of consumer degree of knowledge on consumer behavior: The case of Spanish olive oil.Journal Food Products and Marketing, 15(1), 15–37.
European Commission (2012). Commission Implementing Regulation (EU) No 29/2012 of
13 January 2012 on marketing standards for olive oil. Official Journal of the European Union, L12/14.
European Commission (2017).Olive oil production, prices, balance sheets and trade data.
Brussels, Belgium: D. G. Agriculture and Rural Development.
Falk, F., & Miller, N. (1975).Primer for Soft Modeling.Akron, Ohio: The University of Akron Press.
Fishbein, M., & Ajzen, I. (1975).Belief, attitude, intention, and behavior: An introduction to theory and research.Reading, MA: Addison-Wesley.
Fotopoulos, C., & Krystallis, A. (2001). Are quality labels a real marketing advantage?
Journal of International Food & Agribusiness Marketing, 12, 1–22.
Gracia, A., & De Magistris, T. (2007). Organic food product purchase behaviour: A pilot study for urban consumers in the South of Italy.Spanish Journal of Agricultural Research, 5(4), 439–451.
Henseler, J. (2017). Bridging design and behavioral research with variance-based struc-tural equation modeling.Journal of Advertising, 46(1), 178–192.
Henseler, J., Ringle, C. M., & Sarstedt, M. (2015). A new criterion for assessing dis-criminant validity in variance-based structural equation modeling.Journal of the Academy of Marketing Science, 43(1), 115–135.
House, L., Lusk, J., Jaeger, S., Traill, W. B., Moore, M., Valli, C., ... Yee, W. M. S. (2004). Objective and subjective knowledge: Impacts on consumer demand for genetically modified foods in the United States and the European Union.AgBioForum, 7(3), 113–123.
Iacobucci, D. (2009). Everything you always wanted to know about SEM (structural equations modeling) but were afraid to ask.Journal of Consumer Psychology, 19(4), 673–680.
INE (2011).Census of population.Madrid, Spain: Instituto Nacional de Estadística. INE (2015).Oficial data of population from the municipality register of inhabints at 1st of
January.Madrid, Spain: Instituto Nacional de Estadística.
IOC (2015). Production statistics.http://www.internationaloliveoil.org/estaticos/view/ 131-world-olive-oil-figures/Accesed 26.06.17.
Jarvis, C. B., MacKenzie, S. B., & Podsakoff, P. M. (2003). A critical review of construct indicators and measurement model misspecification in marketing and consumer re-search.Journal of Consumer Research, 30(2), 199–218.
Johnson, E. J., & Russo, J. E. (1984). Product familiarity and learning new information.
Journal of Consumer Research, 11(1), 542–550.
Kalogeras, N., Valchovska, S., Baourakis, G., & Kalaitzis, P. (2009). Dutch consumers’ willingness to pay for organic olive oil.Journal of International Food & Agribusiness Marketing, 21(4), 286–311.
Keller, K. L. (1993). Conceptualizing, measuring, and managing customer-based brand equity.Journal of Marketing, 57(1), 1–22.
Keller, K. L., & Lehmann, D. R. (2006). Brands and branding: Researchfindings and future priorities.Marketing Science, 25(6), 740–759.
Law, K. S., Wong, C. S., & Mobley, W. H. (1998). Toward a taxonomy of multidimensional constructs.Academy of Management Review, 23(4), 741–755.
Lohmöller, J. B. (1989).Latent variable path modeling with partial least squares.Heidelberg: Physica-Verlag HD.
Mägi, A. W., & Julander, C. R. (2005). Consumers’store-level price knowledge: Why are some consumers more knowledgeable than others?Journal of Retailing, 81(4), 319–329.
MAGRAMA (2015). Data base of household consumption.http://www.mapama.gob.es/ es/alimentacion/temas/consumo-y-comercializacion-y-distribucion-alimentaria/ panel-de-consumo-alimentario/base-de-datos-de-consumo-en-hogares/consulta.asp/ Accessed 26. 06.17.
Marano-Marcolini, C., & Torres-Ruíz, F. (2017). A consumer-oriented model for analysing the suitability of food classification systems.Food Policy, 69, 176–189.
Mitchell, A. A., & Olson, J. C. (1977). Cognitive effects of advertising repetition. In W. D. J. Perreault (Ed.).NA–Advances in Consumer Research Volume 04(pp. 213–220). Atlanta, EEUU: Association for Consumer Research.
Monroe, K. B. (1982). The influence of price on product perceptions and product choice. In A. Mitchel, & A. Abor (Eds.).NA–Advances in Consumer Research Volume 9(pp. 206–209). Michigan, EEUU: Association of Consumer Research.
Mtimet, N., Zaibet, L., Zairi, C., & Hzami, H. (2013). Marketing olive oil products in the tunisian local market: The importance of quality attributes and consumers’behavior.
Journal of International Food & Agribusiness Marketing, 25(2), 134–145.
Olson, J. C. (1978). Inferential belief formation in the cue utilization process. In K. Hunt, Table B1
Latent variables’correlation matrix–considering second order latent variables.
C1 C2 C3 C4 C5
C1 1.00
C2 0.55 1.00
C3 −0.41 −0.11 1.00
C4 0.37 0.48 −0.04 1.00
C5 −0.43 −0.22 0.51 −0.19 1.00
& A. Abor (Eds.).NA–Advances in Consumer Research Volume 05(pp. 706–713). Michigan, EEUU: Association for Consumer Research.
Park, C. W., & Lessig, V. P. (1981). Familiarity and its impact on consumer decision biases and heuristics.Journal of Consumer Research, 8(2), 223–231.
Peterson, R. A., & Wilson, W. R. (1985). Perceived risk and reliance schema as price-perceived quality mediators. In J. Jacoby, & J. C. Olson (Eds.).Perceived Quality: How Consumers View Stores and Merchandise(pp. 247–267). Lexington, MA: D. C. Heath and Company.
van Riel, A. C. R., Henseler, J., Kemény, I., & Sasovova, Z. (2017). Estimating hierarchical constructs using consistent partial least squares.Industrial Management and Data Systems, 117(3), 459–477.
Rodríguez-Entrena, M., & Salazar-Ordóñez, M. (2013). Influence of scientific–technical literacy on consumers’behavioural intentions regarding new food.Appetite, 60, 193–202.
Rodríguez-Entrena, M., Salazar-Ordóñez, M., & Sayadi, S. (2013). Applying partial least squares to model genetically modified food purchase intentions in Southern Spain consumers.Food Policy, 40, 44–53.
Rodríguez-Entrena, M., Schuberth, F., & Gelhard, C. (2018). Assessing statistical diff er-ences between parameters estimates in partial least squares path modeling.Quality and Quantity, 52(1), 57–69.
Saba, A., & Di Natale, R. (1998). Attitudes, intention and habit: Their role in predicting actual consumption of fats and oils.Journal of Human Nutrition and Dietetics, 11(1), 21–32.
Samuelson, P. A. (1948). Consumption theory in terms of revealed preference.Economica, 15(60), 243–253.
Schiffman, L. G., & Kanuk, L. L. (2004).Consumer behavior.Upper Saddle River, NJ: Pearson Prentice Hall.
Scrinis, G. (2007). From techno-corporate food to alternative agri-food movements.Local Global, 4, 114–120.
Shepherd, R. (1990). Overview of determinants of food choice and dietary change: Implications for nutrition education.BNF Nutrional Bulletin, 15, 12–30. Shepherd, R. (2011). Determinants of food choice and dietary change: Implications for
nutrition education. In I. R. Contento (Ed.).Nutrition Education: Linking research, theory and practice(pp. 30–58). Sudbury, Massachusetts: Jones and Bartlett Publishers.
Sheppard, B. H., Hartwick, J., & Warshaw, P. R. (1988). The theory of reasoned action: A meta-analysis of past research with recommendations for modifications and future research.Journal of Consumer Research, 15(3), 325–343.
Srivastava, R. K., Shocker, A. D. (1991). Brand Equity: A perspective on its meaning and measurement. Technical Working Paper No 91–124. Cambridge, Massachusets: Marketing Science Institute.
Steenkamp, J. B. E. M. (1990). Conceptual model of the quality perception process.
Journal of Business Research, 21(4), 309–333.
Steenkamp, J. B. E. M. (1997). Dynamics in consumer behavior with respect to agri-cultural and food. In B. Wierenga, A. van Tilburg, K. Grunert, J. B. E. M. Steenkamp, & M. Wedel (Eds.).Agricultural Marketing and Consumer Behaviour in a Changing World
(pp. 143–188). New York, EEUU: Kluwer Academic Publisher.
Stone, M. (1974). Cross-Validatory choice and assessment of statistical predictions.
Journal of the Royal Statistical Society. Series B (Methodological), 36(2), 111–147. Thorsdottir, F., Sveinsdottir, K., Jonsson, F. H., Einarsdottir, G., Thorsdottir, I., &
Martinsdottir, E. (2012). A model offish consumption among young consumers.
Journal of Consumer Marketing, 29(1), 4–12.
Torres-Ruíz, F. J., Vega-Zamora, M., & Gutiérrez-Salcedo, M. (2012).Análisis de la confusión sobre los aceites de oliva y su efecto en el mercado.March-April: Distribución y Consumo1–8.
Wansink, B., Westgren, R. E., & Cheney, M. M. (2005). Hierarchy of nutritional knowl-edge that relates to the consumption of a functional food.Nutrition, 21(2), 264–268. Washburn, J. H., & Plank, R. E. (2002). Measuring brand equity: An evaluation of a
consumer-based brand equity scale.Journal of Marketing Theory and Practice, 10(1), 46–62.
Wilcock, A., Pun, M., Khanona, J., & Aung, M. (2004). Consumer attitudes, knowledge and behaviour: A review of food safety issues.Trends in Food Science and Technology, 15(2), 56–66.
Wilson, B., Henseler, J. (2007). Modeling Reflective Higher-Order Constructs using Three Approaches with PLS Path Modeling: A Monte Carlo Comparison. Australian and New Zealand Marketing Academy Conference. Sydney, New Zeland, December 1–3. Wold, H. A. (1979). Estimation and evaluation of models where theoretical knowledge is
scarce: An example of partial least squares. In J. Ramsey, & J. Kmenta (Eds.).
Evaluation of Econometric Models(pp. 47–74). New York, EEUU: Academic Press. Yangui, A., Costa-Font, M., & Gil, J. M. (2014). Revealing additional preference
hetero-geneity with an extended random parameter logit model: The case of extra virgin olive oil.Spanish Journal of Agricultural Research, 12(3), 553–567.
Yoo, B., Donthu, N., & Lee, S. (2000). An examination of selected marketing mix elements and brand equity.Academy of Marketing Science Journal, 28(2), 195–211. Yoo, B., & Donthu, N. (2001). Developing and validating a multi-dimensional brand