National Innovation System
and external constraint on growth
Sistema nacional de inovação e
restrição externa ao crescimento
MARCO FLÁVIO DA CUNHA RESENDE
DANIELA ALMEIDA RAPOSO TORRES*
reSumO: According to the literature on export-led growth models differences in income elasticities of demand for imports and exports among countries bring about different degrees of external constraint on growth. however, there is not in this literature an explanation that uses the evolutionary concept of National Innovation System (NIS) that shows why there are differences in income elasticities among countries. moreover, there is not a consensus about the exogenicity of the elasticities. Some authors highlight the high level of income elasticity of demand for exports in sectors with high level of technological intensity. however these authors seem to not explain the motive for this. The aim of this paper is to theoretically show the causal relation between an economy’s NIS, its income elasticities and its Current Account performance. It also aims to show the role of NIS in the exogeinicity/endogeinicity of the income elasticities. empirical evidence and a Granger Causality Test are presented and do not reject the core argument of the paper.
KeyWOrDS: Technological progress; income elasticities; economic growth.
ABSTrACT: Segundo a literatura sobre modelos de crescimento com restrição externa, as diferenças nas elasticidades-renda da demanda de importações e de exportações entre os países levam a diferentes graus de restrição externa ao crescimento dos mesmos. Contudo, não há nesta literatura uma explicação que utiliza o conceito evolucionário de Sistema Nacional de Inovações (SI) para mostrar o motivo para as diferenças nas elasticidades-renda dos países. Ademais, não há um consenso sobre a exogeneidade destas elasticidades. Alguns autores enfatizam que a elasticidade-renda de exportações é maior nos setores com maior
* Professor Associado do Departamento de economia da uFmG e do CeDePLAr, Brasil, e-mail: [email protected]. O autor agradece o apoio financeiro da CAPeS, CNPq e FAPemIG. Professora Adjunta do Departamento de economia da universidade Federal de São João Del -rei (uFSJ), Brasil, e-mail: [email protected]. Submitted: 4/February/2015; Approved: 12/October/2015.
intensidade tecnológica. Porém, estes autores não explicam os motivos para isto ocorrer. Neste artigo visa-se mostrar teoricamente a relação de causalidade entre o SI de uma economia, suas elasticidades-renda e seu desempenho em transações correntes. Objetiva--se, também, mostrar o papel do SI na determinação da exogeneidade/endogeneidade das
elasticidades. A evidência empírica apresentada neste estudo não rejeita seus argumentos. PALAVrAS ChAVe: Progresso tecnológico; elasticidades-renda; crescimento econômico. JeL Classiication: e12; F43; O44.
INTrODuCTION
Prebisch’s works (2000a, 2000b) and those of authors who deal with export-led growth models (eLGm), consider that differentials in growth rates between countries result from differences in their income elasticities of demand for imports and exports. Such differences in elasticities bring as a consequence different degrees of balance-of-payments constraint on growth. Authors such as Thirlwall (1979), Dixon and Thirlwall (1975), Thirlwall and hussein (1982), mcCombie and Thirl-wall (1994), moreno-Brid (2003), Barbosa Filho (2001), Cimoli et al. (2010), Gou-vea and Lima (2013) formalized eLGm. According to these models, the income elasticities (Ie) are exogenous and current account (CA) deficits may constraint growth in the long run. Thus, growth depends on CA performance which in turn depends on Ie.
however, there isn’t a consensus about the exogenicity of the Ie. Krugman (1989, 1999) have criticized the literature on eLGm and argued that the Ie are endogenous and change due to differences in the rate of growth of total factor productivity among countries. Fagerberg (1988) have also worked at the supply side of the economy to show that technological progress affects the Ie. Authors such as Bértola et al. (2002) and Porcile et al. (2007), have argued that supply-side effects emerges from the pattern of specialization of the industrial structure insofar as the latter affects the Ie. On the other hand, mcCombie and Thirlwall (1994, p. 388-391) present arguments for the exogenicity of the Ie.
There is no such study that uses the evolutionary concept of National Innova-tion System (NIS) in order to show why there are differences in Ie among countries. moreover, the concept of NIS can be useful in explaining differences in Ie between industrialized countries, since Prebisch’s explanation relate to differences between agrarian and industrialized countries. According to Boianovsky and Solís (2014), in Prebisch’s view just the countries from the Periphery (agrarian countries) show a balance-of-payments constraint on growth.
demon-strate in a theoretical way the role of NIS in the existence of Ie differentials among industrial countries. Second, it focuses on the concept of NIS in order to reject Krugman’s critique about the eLGm. Third, it shows some empirical evidence about the causal relationship between the NIS and CA surpluses.
In the next section, the role of NIS and technological progress for the existence of income elasticity differentials among industrial countries and for improvements on the CA balances is theoretically discussed. In the third section Krugman’s cri-tique about eLGm and an argument for the rejection of such cricri-tique are pre-sented. Some empirical evidences about the relationship between NIS and CA bal-ances (including a Granger Causality Test) are presented in the fourth section. Last section brings the conclusions of this work.
NATIONAL INNOVATION SySTem AND The CurreNT ACCOuNT BALANCe
The literature on eLGm argues that countries present a balance-of-payments equilibrium growth rate (BPeGr) in the long run. Countries with low income elasticity of demand for exports and high income elasticity of demand for imports present a tendency to show external crises due to the recurrence of its CA deficits. Thus, external crises are a way to force the rates of growth to converge to the BPeGr in the long run (mcCombie and Thirlwall, 1994, p. 256-261).
On the other hand, we advocate that the relative development of a country’s NIS plays a relevant influence on the size of the Ie. The aim of this section is to show the causal links among the degree of relative development of a country’s NIS, the size of its Ie and its CA performance.
Countries as Separate Technological Systems
The concept of NIS was developed in the evolutionary literature.1 The NIS is
a country’s institutional framework that summarizes the agents involved in innova-tion and technical change. Firms, universities, research instituinnova-tions, factor endow-ments, financial systems, government policies, cultural traditions, etc. are part of a country’s NIS (Nelson, 1993; Freeman, 1995; ribeiro et al., 2006). The networks of relationships among these agents are seen as crucial to technological progress (e.g., user-producer interactive learning; inter-firms relationships; links among uni-versities, research institutions, government policies and industries; science-technol-ogy links; interaction with the market and with related firms; mutual trust and personal relationships, etc.)
Innovations and technical change have systemic and tacit aspects. Freeman (1995) emphasizes that technological change is analysed as the joint outcome of
innovation and learning activities within organizations, especially firms, and inter-actions between these and their environments. Firms are the main locus of techno-logical accumulation and are characterized by different combinations of intrinsic capabilities, including technological know-how (Fagerberg, 1994).2 On the other
hand, environments of firms are seen as crucial for technological progress and its diffusion.
Technologies are embedded in organizations and are not easily transferable to other settings. Technological spillovers to a large extent are geographically localized (Fagerberg, 1994). Thus, the evolutionary literature rejects the argument that tech-nology is a public-good (e.g., Fagerberg, 1994; Dosi et al., 1994). The cumulative – or path dependent – character of technological progress is often stressed. Follow-ing Dosi (1988, p. 123), “Technology, far from beFollow-ing a free good, involves a fun-damental learning aspect, characterized by varying degrees of cumulativeness,
op-portunity and appropriability […] Both appropriability and cumulativeness of
technical change are affected by the degrees of tacitness and degrees of formal understanding of each technology”.
According to Dosi et al. (1994, p. 28), imports of technology and autonomous innovative efforts are not alternative but complementary activities. “Technologies cannot be taken off the shelf and simple put into use anywhere. Without infrastruc-tural investment in education, training, r&D, and other scientific and technical activities, very little can be accomplished by way of acquisition of imported tech-nologies.”
Therefore, country-specific factors are assumed to influence the process of technical change. history, culture, institutions and government policies together are seen as crucial determinants of the characteristics and dynamics of each country’s NIS. Thus, writers from this tradition see countries as separate technological sys-tems, each with its own specific NIS and own specific dynamics (Lundvall, 1992; Nelson, 1993; Freeman, 1995).
Nelson (2005), Freeman (1995), Fagerberg and Godinho (2005), Dosi et al. (1994), Bernardes and Albuquerque (2003) highlight the positive effects of the NIS on an economy’s productivity, competitiveness and growth. They also consider the impossibility of substituting the NIS by the importation of technology, given that technology has a tacit, path dependence, systemic and local feature. Thus, technol-ogy is not a public-good.
Therefore, in spite of the recent process of globalization, the NIS remains central in the development of technical progress and its dissemination (Freeman, 1995). These authors show that Technological progress and its diffusion in a
coun-2 Writers from this tradition emphasize the importance of research and Development (r&D) system
try depend on the development of that country’s NIS, which in turn, affects the level of technological sophistication of the country’s production.
The Causal Relationship Between NIS and the Income Elasticities
We argue that the country’s NIS development influences its CA performance. As will be shown, the greater the development of NIS, the lower the income
elastic-ity of demand for imports in relation to income elasticelastic-ity of demand for exports will be, and therefore, the greater the CA surplus will be.
This relationship is not valid only for countries that are the centre of the inter-national financial system. The net capital inflows in the country where the main international financial market is located tends to be high and persistent and brings about economic policies that are associated with the occurrence of chronic CA deficits, even when the economy is competitive. In other words, in the last few decades the capital flows in the financial account of the countries’ balance of pay-ments have become increasingly larger than the flows into the current account (Plihon, 1995; Ffrench-Davis, 2003) and, on the other hand, any increase in the current account deficit must be matched by a surplus on the financial and capital accounts (adjusting for changes in reserves). Thus, countries with a relative devel-oped NIS, which includes a develdevel-oped financial system, benefit from the interna-tional capital flows insofar as they are considered as low risk countries for invest-ment. They are competitive in the international trade markets due to the relative development in their NIS and they show sophisticated financial instruments and financial arrangements due to the high level of development of their financial sys-tems. They show also convertible currencies because of the high level of develop-ment of their financial systems and NIS. As a consequence, there is a large capital inflow in their financial accounts and they show persistently financial accounts surpluses and, therefore, current account deficits, although they are competitive economies. This seems to be the case of the united States and the united Kingdom during the last few decades.
technological sophistication of products (LTSP), the closer the structures of their markets resemble oligopoly, the more dynamic are their markets and the less they are subject to protectionist measures.
The positive correlation between the LTSP and the degree of oligopoly, and between the LTSP and the level of dynamism of its markets is due to the fact that a product that is in the technology frontier, or close to it, cannot be produced in countries which do not possess a developed NIS. Production cannot just simply be transferred to other countries, given that few economies possess a NIS that is de-veloped enough to enable them to manufacture such products. That means: i) no heavy competition for these products in world markets and tacit or explicit agree-ments concerning price fixing for the goods in the international market is made possible. This situation supports an increase in the income elasticity of demand for the country’s exports; ii) the demand for such products can only be satisfied by means of imports from the few countries where the NIS is able to produce it, thus guaranteeing a world-wide market with increasing (dynamic) demand for this type of technologically sophisticated product. The higher the dynamism of the country’s exports markets, the higher the income elasticity of demand for this country’s ex-ports tends to be.
The inverse correlation between the LTSP and the degree of protectionism in its markets abroad is due to the fact that a product made by low level of techno-logical content can be produced by many countries, even if the production costs are higher than the world average. Domestic production is made viable by erecting barriers to importation of this type of product. however, if the technological con-tent of the product is of a high level, it cannot immediately be produced even though barriers have been established if the country’s NIS is not developed enough to make it possible. In such cases, the domestic demand for the product can only be satisfied by imports and this would imply a low level of protectionism (in the domestic markets of a wide range of countries) and a high level of the income elasticity of demand for exports high technology products.
Concerning the diversification of the country’s industrial structure, the more developed its NIS, the greater is the possibility of reaching the technological front-line in various areas of production. Therefore, the greater the degree of diversifica-tion in the industrial structure tends to be. Consequently, there is greater diversifi-cation in the range of its export goods, which favours growth in the value of exports, due to two factors, namely, i) the export opportunities and the domination of new markets will be greater to the extent that there is greater diversification in the range of export goods; ii) the stability of growth in the value of exports will be greater the more diversified exports are because the greater the chance that a drop in price and/or demand for exports be offset by an increase in price and/or demand of another product in the range of exports.
The relationship between the level of a country’s NIS development and its in-come elasticity of demand for imports is also associated with these four items. Countries with a low level of NIS development are not capable of producing goods with high technology content and need to import such goods from high priced markets where there is oligopoly. In addition to this, the more dynamic a market for a particular good, the greater will be the demand in this market, thus favouring an increase in prices and making its imports more expensive – the positive correla-tion between LTSP and the degree of market dynamism has already been explained. Also, the lower the import barriers, the greater the value of imports. As already argued, there is an inverse correlation between the degree of a product’s techno-logical sophistication and the level of protectionism in its markets abroad. Finally, the less developed the country’s NIS, the less diversified its industrial structure will be. Therefore, the more diversified its range of imports, the greater the proportion of internal demand that will be satisfied by means of imports. All these factors lead to growth in the income elasticity of demand for imports.
Therefore, in a country where the NIS is relatively less developed, the income elasticity of demand for exports tends to be lower than the income elasticity of demand for imports, leading to external structural vulnerability, as postulated ini-tially by Prebisch (2000a, 2000b). It may be concluded that the level of develop-ment of the country’s NIS affects the size of its Ie and it is positively correlated with the performance of the trade balance and the CA balance.
The NIS AND The DeBATe ON The eXOGeNICITy/ eNDOGeNICITy OF The INCOme eLASTICITIeS
Krugman (1999) criticized the literature on eLGm and considered a supply-side explanation of the Ie. he argued that “differential growth rates affect trade flows in such a way as to create apparent differences in income elasticities [...] I am simply going to dismiss a priori the argument that income elasticities determine economic growth, rather than the other way around” (Krugman, 1999, p. 47).
Krugman’s argument shows the following mechanism: if the labor force grows, then productivity grows, output and income grow and the size in the supply of product variety grows. Since consumers desire to diversify their purchases, demand grows without changes in prices. Thus the faster growing country exports more and increases its share on world expenditure, i.e., increases its income elasticity of demand for exports. Krugman (1999) considered a non-realistic model to make his point about the supply-side explanation of the Ie. As this author recognized himself, “No effort will be made at realism” (Krugman, 1999, p. 50). however, adopting the
evolutionary approach one can explains changes in the Ie.
As was argued above, the more developed the country’s NIS, the greater its Ie of demand for exports in relation to its Ie of demand for imports will be. So, the relative development of a country’s NIS leads to productivity and economic growth and to changes in its Ie. This is a supply-side explanation of the Ie and of the growth process. however, there is not a mechanism that could account for a caus-al relation running from growth to Ie as Krugman argued. Both growth and Ie are a consequence of the country’s NIS relative development. I.e., the Ie is dependent on the country’s NIS relative development.
The export markets of technologically sophisticated goods are characterized by low level of protectionism, high degree of oligopoly and increasing demand. Thus, these export markets are characterized by high level of prices if compared to the level of prices in the perfect competition marked. moreover, the diversification in the country’s range of the export goods favours export opportunities and the domination of new markets. These characteristics affect the income elasticity of demand for exports and are present because technology is not a public good. On the other hand, countries which NIS present low level in its relative development need to reduce its barriers for import sophisticated goods with high prices level from world markets. Besides this, these countries show a less diversified industrial structure and thus show a more diversified range of imports, leading to a great proportion of internal demand that is satisfied by means of imports. These charac-teristics affect the income elasticity of demand for imports and are present because technology is not a public good.
Therefore the technological progress is the engine of both growth of productiv-ity and output and affects the size of the country’s Ie insofar as other countries cannot reproduce themselves the NIS development of the former country. how-ever, if on the one hand the non-public good aspect of technology is central to explain why the income elasticity of demand for exports is higher than the income elasticity of demand for imports due to the relative development of the country’s NIS, on the other hand this same factor is a reason for the predominance of a pic-ture where there are no changes on countries’ Ie for a long time.
why the countries that are either on the technology frontier or farm from it remain for a long time in this position and, therefore their Ie for export tend to remain for a long time either higher or lower in relation to their Ie of demand for import. I.e., as technology is not a public good, a country’s relative technological progress leads to changes in its Ie, but at the same time a country’s relative technological progress is hard to happen because technology is not a public good and, therefore, the coun-tries’ Ie show great stability.
According to the eLGm, the rate of growth of domestic income consistent with balance-of-payments equilibrium (i.e., the balance-of-payments equilibrium growth rate), yB, is €.Z/π, where Z is the rate of change of world income, € is the income elasticity of demand for exports and π is the income elasticity of demand for im-ports. Thus, if the Ie shows great stability the estimates of yB make sense and the proposition from the eLGm that Ie of demand for imports and exports determine growth in the long run is valid, i.e., growth is demand determined. In other words, the countries’ Ie do not change frequently due to the non-public good aspect of technology and this picture is consistent with models (eLGm) that assume that Ie are exogenous.
moreover, there are in the literature on eLGm some explanations for the exo-genicity of the Ie. As mcCombie and Thirwall (1994, p. 389) pointed out, “coun-tries’ income elasticities are largely determined by natural resource endowments and the characteristics of goods produced which are the product of history and independent of the growth of output”. moreover, they argue that although produc-tivity growth may cause economic growth, elements as induced investment, embod-ied technical progress, learning by doing, scale economies, etc., are associated with a mechanism that could account for a causal relation running form exports and output growth to productivity growth.
Thus, if the exogenicity character in the Ie is predominant, growth may be demand determined. The Ie may determine growth by imposing a balance-of-pay-ments constraint on demand in a context where factor supplies are endogenous to demand. Although technological progress is a determinant of growth, there are other sources of growth. Demand may be constrained by balance-of-payment or may be lacking due to uncertainty about the future (Keynesian Liquidity Preference Theory).
im-portant respect, there can be a marrying of the demand and supply-side explana-tions of the comparative growth performance of naexplana-tions”.
emPIrICAL eVIDeNCe
The level of development of a country’s NIS can be measured on the basis of that country’s per capita production of patents compared to the per capita produc-tion in the world as a whole. According to Bernardes and Albuquerque (2003, p. 873) and Albuquerque (1999), patents are not an infallible means of measuring the level of technological progress but, nevertheless, it is the method used in the literature and is useful in achieving this objective. using data relating to science and technology indicators, Albuquerque (1999) concluded that the countries which have a developed NIS are: Germany, France, Italy, Japan, the united States, the united Kingdom, Denmark, Belgium, the Netherlands, Ireland, Austria, Switzerland, Canada, New Zealand, Australia and Israel. Countries which are at the stage of catching up are: South Korea, Taiwan and Singapore.
Therefore, in this article Albuquerque’s (1999) classification was used to collect data on the international trade of two groups of countries: countries with a developed NIS (DIS) and those with an undeveloped NIS (uDIS). The following countries were selected to represent the DIS group because they compose the G7 group, i.e., they are considered the most developed countries in the world: Germany, France, Italy, Japan and Canada.3 For the uDIS 16 countries which data was available were chosen:
Argentina, Bolivia, Brazil, Colombia, Chile, ecuador, mexico, Peru, uruguay, Venezu-ela, malaysia, Thailand, India, Indonesia, Philippines and South Africa.
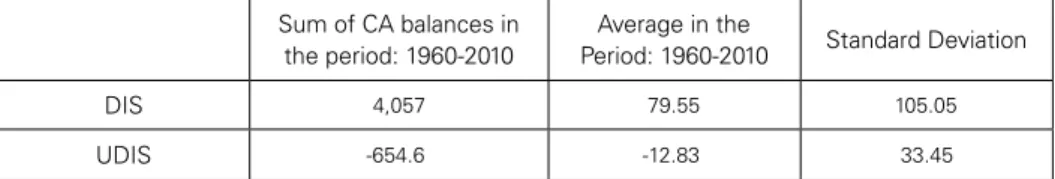
Table 1 shows the CA balance for the DIS and uDIS groups. For the period 1960-2010 when data was available, the DIS (uDIS) group had an average CA surplus (deficit) of uS$ 79.5 billion (uS$ 12.8 billion). Thus, the countries with a developed NIS are those with better performance of its CA balances.
Table 1: Total and Average Current Account Balance, 1960–2010 (US$ billion)
Sum of CA balances in the period: 1960-2010
Average in the
Period: 1960-2010 Standard Deviation
DIS 4,057 79.55 105.05
UDIS -654.6 -12.83 33.45
Source: Author’s elaboration using data from World Development Indicators database, 2012. DIS = countries with a developed NIS – G7 countries excluding USA and UK were taken as proxy; UDIS = countries with an undeveloped NIS: Brazil, Argentina, Bolivia, Colombia, Chile, Ecuador, Mexico, Peru, Uruguay, Venezuela, Malaysia, Thailand, India, Indonesia, Philippines and South Africa.
3 The exclusion of this group of two countries that are important in the world scenario, the unites States
Table 2 shows the average balance of the total trade balance in goods with high technological intensity (hT), manufactured goods (mG) and primary goods (PG) for the DIS and uDIS groups between 1980 and 2010. In the case of the uDIS group, the average trade balance and the average hT and mG balance was in deficit, while the average PG trade balance was in surplus. In the DIS group, ex-actly the opposite situation was found.
Table 2: Total Trade Balance in Goods with high technological intensity, Manufactured Goods and Primary Goods, 1980-2010(US$ billions)
Period UDIS DIS
1980-2010 TTB HT MG PG TTB HT MG PG
Average -2.5 -46.2 -13.4 10.9 29.94 52.5 76.6 -46.3 Source: Author’s elaboration using data from United Nations Statistics Division, World Trade Organization, 2012. DIS = see Table 1; UDIS = see Table 1. TTB = total trade balance; HT = goods with high technological intensity trade balance; MG = manufactured goods trade balance; PG = primary goods trade balance.
Figure 1 shows the percentage share of the world exports of goods with hT and of mG and PG, for the period 1980-2010. In all the categories described here, the share in world exports from countries in the DIS group is always larger than the share from countries in the uDIS group. even more, this gap is much larger for mG and goods with hT, as compared to PG.
Figure 1: Exports share in world exports, by type of goods-1980-2010-(%)
UDIS DIS
0.00 10.00 20.00 30.00 40.00 50.00 60.00
PC MG HT T
DIS
DIS DIS DIS
UDIS UDIS
UDIS UDIS
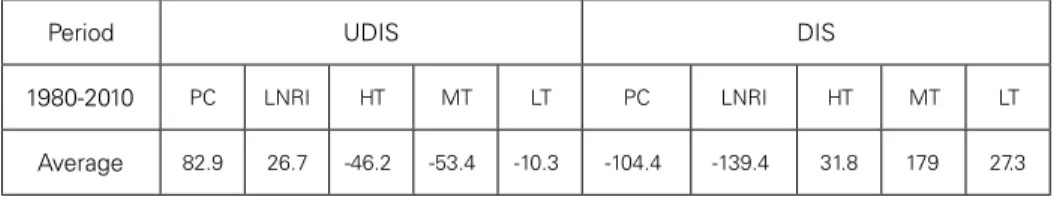
Table 3 presents the average trade balance in PG, labor-intensive and natural-resource-intensive goods, as well as goods with high, medium and low technologi-cal level between 1980 and 2010.4 The average trade balance for the uDIS group
was in deficit for high, medium and low technology goods and in surplus for PG and labour-intensive and natural-resource-intensive goods, while the result was exactly the opposite in the case of the DIS group.
Table 3: Trade balance in primary commodities, labor-intensive and natural-resource-intensive goods, and goods with high, medium and low technological intensity (US$ billions)
Period UDIS DIS
1980-2010 PC LNRI HT MT LT PC LNRI HT MT LT
Average 82.9 26.7 -46.2 -53.4 -10.3 -104.4 -139.4 31.8 179 27.3 Source: Author’s elaboration using data from United Nations Statistics Division, World Trade Organization, 2012. DIS = countries with a developed NIS – G7 countries were taken as proxy; UDIS = see Table 1. PC = primary com-modities; LNRI = labor- and natural-resource-intensive goods; HT, MT and LT are, respectively, goods with high, medium and low technological intensity.
moreover, the uDIS group shows a low share of technology-intensive goods in the total exports, which is quite lower than the share for countries in the DIS group, characterized by larger export shares of goods with higher technological intensity (Table 4). The largest share in total exports from the uDIS group is PG (41.31% of total exports). In the DIS group, exports of goods with high and me-dium technological intensity and of PG represent around 30%, 37% and 14%, respectively.
Table 4: Export Composition by Factor Intensity-1980-2010-(%)
Period UDIS DIS
1980-2004 PC LNRI HT MT LT Total PC LNRI HT MT LT Total Average 41,3 15,2 21,6 15,5 6.2 100.0 14.5 9.6 30.4 37.1 8.3 100.0 Source: Author’s elaboration using data from United Nations Statistics Division, World Trade Organization, 2012. DIS = countries with a developed NIS – G7 countries were taken as proxy; UDIS = see Table 1. PC = primary com-modities; LNRI = labor and natural-resource-intensive goods; HT, MT and LT are, respectively, goods with high, medium and low technological intensity.
Figure 2 complements the argument by showing strict dominance of countries from the DIS group in world exports of goods with hT, as compared to the uDIS group. Such difference is smaller in the case of PG and labor-intensive and natural-resource-intensive goods, where the group uDIS is more competitive.
4 This classification was made by united Nations Conference on Trade and Development (uNCTAD,
Figure 2: Share of exports in world exports according to the degree of factor intensity-1980-2010(%)
0 10 20 30 40 50 60 70
PC MT HT LNRI LT
DIS
DIS DIS
DIS
DIS
UDIS UDIS
UDIS UDIS UDIS
UDIS DIS
Source: Author’s elaboration. Data from United Nations Statistics Division, World Trade Organization, 2012. DIS = countries with a developed NIS – G7 countries were taken as proxy; UDIS = see Table 1.
PC = primary commodities; LNRI = labor - and natural-resource-intensive goods; HT, MT and LT are, respectively, goods with high, medium and low technological intensity
The argument that technological innovation plays an important role in trade balance and in CA balance is corroborated by the correlation coefficient between the share of each of the 23 countries of both uDIS and DIS groups (including uSA and uK) in the world production of per capita patents and the share of each coun-try in world exports of goods with hT (table 5). These coefficients are high and positive, showing an average of 0.95 for all the periods analysed, and suggesting a high correlation between the level of development of the NIS in a country and its performance in exports of high technology goods.
Table 5: Correlation Coefficient between the share of each country in world production of per capita patents and the share of each country
in world exports of high technology goods–sample of 23 countries
Period 1980 1985 1990 1995 2010 1980-2010 1990-2010
Correlation
coefficient 0.95 0.96 0.96 0.95 0.93 0.94 0.93
Source: Author’s elaboration. The 23 countries are: Germany, France, Italy, Japan, Canada, USA, UK, Brazil, Argen-tina, Bolivia, Colombia, Chile, Ecuador, Mexico, Peru, Uruguay, Venezuela, Malaysia, Thailand, India, Indonesia, Philippines and South Africa.
Table 6: Correlation Coefficient between Current Account balance and the share of 21 countries in the per capita world production of patents
Period 1970-2010 1980-2010 1990-2010
Correlation Coefficient 0.69 0.70 0.71
Source: Author’s elaboration. The 21 countries are: Germany, France, Italy, Japan, Canada, Brazil, Argentina, Bolivia, Colombia, Chile, Ecuador, Mexico, Peru, Uruguay, Venezuela, Malaysia, Thailand, India, Indonesia, Philippines and South Africa.
The empirical evidence presented above suggests a correlation between the development of the NIS and the CA performance of a country. To investigate wheth-er causal relationships exist between these variables the temporal precedence test will be applied in the sense of Granger (1969) for 21 countries through the analysis of an unbalanced panel – uSA and uK were excluding from our sample of 23 countries for the reasons previously indicated. It is expected that the share of the country in the world per capita production of patents (PAT) Granger causes its current account balance (CA).
In the context of panel data there does not yet exist a methodology generally adopted to test the causality between variables, although some procedures appear in the literature. In this work the procedure of Carroll and Weil (1994) and Judson and Owen (1999) has been adopted, that make use of the Ah estimator (Anderson and hsiao, 1981) starting from panel data. It is necessary to estimate two distinct dynamic relations between PAT and CA:
CAt = α + β CAt-1 + γ1PATt-1+ut (1)
PATt = α + β PATt-1 + γ1CAt-1+ut (2)
Initially, the existence of a long-term relationship between CA and PAT through unit root tests and of cointegration for panels is checked. Stationarity tests con-sider the possibility of structural breaks in the series. The test proposed by Andrews and Zivot (1992) was adopted.5 If the unit root hypothesis is not rejected, the
hy-pothesis of structural break is tested. The identification of the structural break is done where the statistical t test presents a maximum value. Should the null hypoth-esis of structural break be rejected, the methodology proposed by maddala and Wu (1999) will be applied, for unbalanced panels, that permits estimates and inferences to be made on unit roots in all the countries. The approach of the cointegration method with structural break is an extension of the unit root test with structural break developed above. Following Andrews and Zivot (1992), the model considers only one endogenous break in the cointegration relationships.
Following Gregory and hansen (1996), evidence of structural break and the co-integration relationships is provided by three models: level shift (C), level shift with trend (C/T) and the regime shift model (C/S). In all the models structural
change is tested by the presence of a dummy variable. We estimate the three mod-els for the set of panel countries on those dates where the structural break was shown to be significant. After the models were estimated, the Augmented Dickey-Fuller unit root Test is applied (ADF) on the residuals of the equations, using the critical values tabulated by Gregory and hansen (1996). There is a cointegration relationship between the series if the residuals of the estimated equations are sta-tionary.
The causal relationship between the variables will be checked by the separate estimation of equations (1) and (2) by means of the methodology proposed by Anderson and hsiao (1981). Thus, applying the method of instrumental variables
on the first difference, proposed by the authors, we rewrite, for example, equation (1) as follows:
CAt- CAt-1 = β1 (CAt-1- CAt-2) + δ1 (PATt-1- PATt-2) + (ut-ut -1) (3)
Observe that, in (1.1), the disturbance (ut – ut-1) is now correlated with the inde-pendent variable (CAt-1- CAt-2). Anderson and hsiao (1981) recommend as instrument (CAt-2- CAt-3) or (CAt-2). Granger’s causality, in the sense that PAT causes CA, is dem-onstrated if the null hypothesis, δ 1 = 0, is rejected. Finally, for the purpose of analyz-ing the robustness of the results obtained by the application of the dynamic estima-tors of Anderson and hsiao (1981), we present the results of the LSDVC estimator proposed by Bruno (2005), known as corrected fixed effects models.
Tests and Results
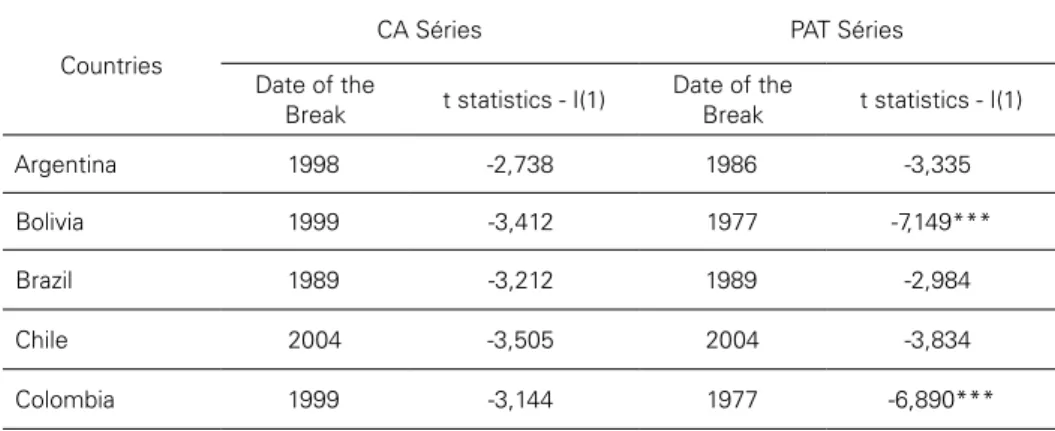
The results of the unit root tests with structural break of Andrews and Zivot (1992) for 21 countries during 1970-2010 are presented in Table 7. The unit root null hypothesis for the CA series in 21 of the countries of the panel cannot be re-jected. For the PAT series, most of the countries possess unit root, with the excep-tion of Bolivia, Colombia, ecuador, Peru, South Africa and uruguay.
Table 7: Tests for Unit Roots, 1970-2010
Countries
CA Séries PAT Séries
Date of the
Break t statistics - I(1)
Date of the
Break t statistics - I(1)
Argentina 1998 -2,738 1986 -3,335
Bolivia 1999 -3,412 1977 -7,149***
Brazil 1989 -3,212 1989 -2,984
Chile 2004 -3,505 2004 -3,834
Ecuador 1995 -4,346 1984 -6,283***
India 1994 -3,008 2005 -0,684
Indonesia 1996 -4,367 1977 -4,358
Malaysia 2002 -4,358 1998 -3,678
Mexico 1996 -3,831 1993 -3,366
Peru 2005** -2,214 1981 -6,278***
Philippines 2002 -3,061 1976 -3,495
South Africa 1995 -3,861 1990 -5,341**
Thailand 1987 -5,506 1992 -4,097
Uruguay 1994 -4,870 1991 -5,142**
Venezuela, RB 1995 -3,786 1996 -3,904
Canada 1977 -1,376 1980 -3,278
France 2000* -3,226 1982 -3,843
Germany 1999 -2,857 1996 -3.312
Italy 1998 -3,102 2005 -4,778
Japan 1987 -4,727 1980 -3,428
Source: Author’s elaboration.
Model with Constant and time trend. * Significant at 1% level. Critical values are given in Andrews and Zivot (1992). ** H0 should not be rejected, i.e., θ = 0, at 5% level of significance, according to F statistic.
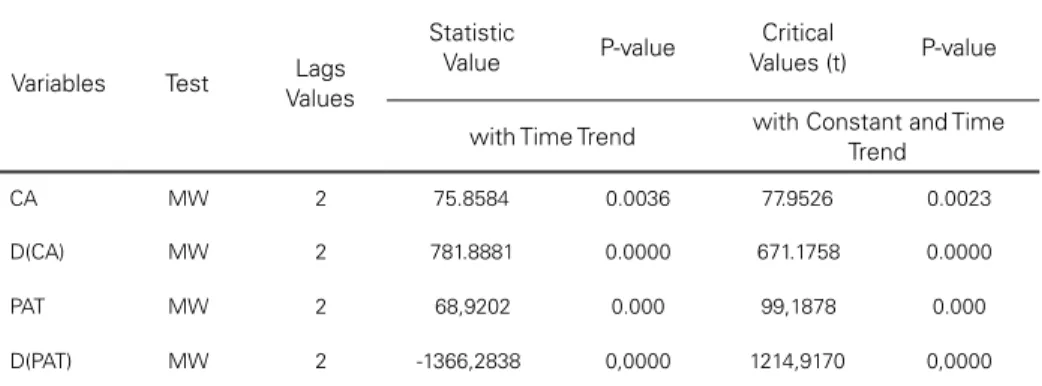
Table 8: Results from Maddala and Wu (1999) Test
Variables Test Lags Values
Statistic
Value P-value
Critical
Values (t) P-value
with Time Trend with Constant and Time Trend
CA MW 2 75.8584 0.0036 77.9526 0.0023 D(CA) MW 2 781.8881 0.0000 671.1758 0.0000
PAT MW 2 68,9202 0.000 99,1878 0.000 D(PAT) MW 2 -1366,2838 0,0000 1214,9170 0,0000 Source: Author’s elaboration.
MW = Maddala and Wu. D = first difference of the variable. Chi-squared statistic: Ho = existence of unit root in all countries.
As regards cointegration, all the estimations of the cointegration model of Gregory and hansen (1996) were carried out with the first difference of the CA and PAT series and with the structural date break endogenously determined. The null hypothesis was rejected to the level of 1% of statistical significance, in all the models (table 9).6 It is concluded that the series are cointegrated.
Table 9: Cointegration Test
Date of the Break
Models
C C/T C/S
ADF of the Residuals
2000 -3.44* -3.34* -3.18*
2005 -3.41* -3.37* -3.25*
2000/05 -3.35* -3.31* -3.16*
Source: Author’s elaboration.
Note: * Significant at 1% level. Critical values are given in Gregory and Hansen (1996). C = model level shift; C/T = model level shift with trend; C/S = model regime shift.
The causal relationships between PAT and CA were tested starting from the estimation of equations (1) and (2) by applying the Ah estimators (Anderson and hsiao, 1981). Table 10 shows the results of the estimations, including those ob-tained by corrected fixed effects (LSDVC) to analyze the robustness of the dy-namic model. The sample used involves data from 1970 to 2010. Due to the loss of degrees of freedom due to the small size of the temporal sample, equations (1) and (2) were estimated with only two lags. In addition, the introduction of many
6 We also carried out the Westerlund Test (2007) for the panel set. From one Westerlund statistic z: ho =
lags, although it diminishes the serial autocorrelation, can generate a colinearity problem among the explanatory variables.
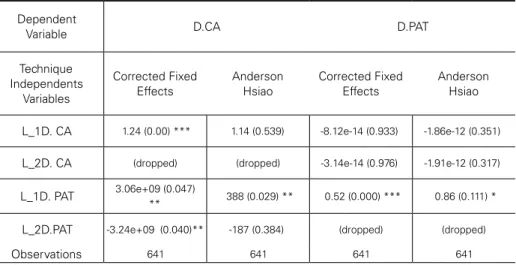
We find that PAT causes CA, seeing that in equation (1), where ∆CA is the dependent variable, the first lag of ∆PAT is significant. The results obtained by Ah for equation (2), where ∆PAT is the dependent variable, show that ∆CA is not significant, and the value of the estimated coefficient is almost null.
Table 10 – Granger Causality for Panel Data
Dependent
Variable D.CA D.PAT
Technique Independents
Variables
Corrected Fixed Effects
Anderson Hsiao
Corrected Fixed Effects
Anderson Hsiao
L_1D. CA 1.24 (0.00) *** 1.14 (0.539) -8.12e-14 (0.933) -1.86e-12 (0.351)
L_2D. CA (dropped) (dropped) -3.14e-14 (0.976) -1.91e-12 (0.317)
L_1D. PAT 3.06e+09 (0.047)
** 388 (0.029) ** 0.52 (0.000) *** 0.86 (0.111) *
L_2D.PAT -3.24e+09 (0.040)** -187 (0.384) (dropped) (dropped)
Observations 641 641 641 641
Source: Author’s elaboration.
P-values are in brackets. D.VAR = VAR(t)-VAR(t-1), L_1D.VAR = VAR(t-1)-VAR(t-2), L_2D.VAR = VAR(t-2)-VAR(t-3). *** Significant at 1% level; ** Significant at 5% level; * Significant at 10% level.
To test the robustness of the results obtained by the application of the Ah dy-namic estimator, we utilized the LSDVC dydy-namic estimator. The results of the latter were found to be consistent with the results of the Ah model, as there is no substan-tial change in parameter magnitude or in its statistical significance (Table 10).
All these results (Tables 1 to 10 and Figures 1 and 2) endorse the argument that the relative level of development of a country’s NIS is an important determi-nant of its income elasticities and therefore of its CA performance. Countries with more (less) developed NIS have a higher (lower) level of CA surpluses. Thus, econ-omies with a developed NIS tend to have a lower level of external constraint on growth. In countries with a less developed NIS there is a higher level of external constraint on growth.
CONCLuSIONS
external constraint on growth, in turn, would depend on the country’s Ie of de-mand for imports and exports that would be exogenous.
Why are there Ie differentials among industrial countries? There is not in the literature an explanation that uses the evolutionary concept of NIS to answer this question. In order to fill this gap, this paper built theoretical causal links between the development of a NIS and changes in Ie of an economy. It also uses the NIS concept and the evolutionary literature in order to explain why Ie shows great stability over time and therefore the estimates of the balance-of-payments equilib-rium growth rate make sense. I.e., the proposition from the eLGm that Ie deter-mine growth in the long run is valid. Thus, the NIS concept and the evolutionary literature can be used in order to give a response to Krugman’s critique (Krugman, 1999). Finally, the theoretical arguments were supported empirically through the
construction of several indicators and Granger Causality Test. We found that coun-tries where the NIS is more developed dominate world trade and present structur-ally positive external balances. The opposite is the case for countries where the NIS is less developed.
The empirical evidence we presented support the argument that the relative development of the NIS in a country is relevant to explain the intensity of its ex-ternal constraint on growth. Thus, it reaffirms the importance of stimulating the development of the NIS in developing economies as a way to consistently reduce the gap in growth rates between countries.
reFereNCeS
Albuquerque, e.m. (1999) “National systems of innovation and Non-OeCD countries: notes about a rudimentary and tentative typology”. Brazilian Journal of Political Economy, 19(76): 35-52. Anderson, T. W. and hsiao, C. (1981) “estimation of dynamic models with error components”. Journal
of the American Statistical Association, 76: 589-606.
Andrews, D.W.K. and Zivot, e. (1992) “Further evidence on the Great Crash, the Oil Price Shock and the unit root hypothesis”. Journal of Business and Economics Statistics, 10: 251-270. Barbosa Filho, N.h. (2001) “The Balance-of-Payments Constraint: from balanced trade to sustainable
debt”. BancaNazionale Del Lavoro Quarterly Review, 219: 381-399.
Bernardes, A.T. and Albuquerque, e.m. (2003) “Cross-over, thresholds, and interactions Between scien-ce and technology: lessons for less-developed countries”. Research Policy, 32: 865–885. Bértola, L., higachi, h. and Proceile, G. (2002) “Balance-of-Payments-constrained growth in Brazil: a
test of Thirlwall’s Law, 1890-1973”. Journal of Post Keynesian Economics, 25( 1): 123-140. Boianovsky, m. and Solís, r. (2014) “The origins and Development of the Latin American Structuralist
Approach to the Balance of Payments”. Review of Political Economy, 26 (1): 23-59.
Bruno, G. (2005) “Approximating the Bias of LSDV estimation the Bias of LSDV estimator for Dyna-mic unbalanced Panel Data models”. Economic Letters, 87(3): 361-366.
Carroll, C. and Weil, D. (1994) “Saving and growth: a reinterpretation”. Carnegie-Rochester Conferen-ce Series on Public Policy 40: 133-192.
Cimoli, m., Porcile, G. and rovira, S. (2010) “Structural change and the BOP-constraint: why did La-tin America fail to converge?” Cambridge Journal of Economics, 34: 389-411.
Dosi, F. (1988) “Institutions and markets in a dynamic world”. The Manchester School, LVI (2): 119-146.
Dosi, G., Fabiani, S. and Freeman, C. (1994) “The process of economic development: introducing some stylized facts and theories on technologies, irms and institutions”. Industrial and Corporate Change, 3(1): 1-45.
Fagerberg, J. (1988) “International Competitiveness”. Economic Journal, 98: 355-374.
Fagerberg, J. (1994) !Technology and international differences in growth rates”. Journal of Economic Literature, 32: 1147-1175.
Fagerberg, J. and Godinho, m.m. (2005) “Innovation and catching up”. In Fagerberg, J.; mowery, D.; Nelson, r. The Oxford Handbook of Innovation. Oxford: Oxford university: 514-542. Ferrari, m.A.r.; Freitas, F.N.P. and Barbosa Filho, N. (2013) “A taxa de câmbio real e a restrição
ex-terna: uma proposta de releitura com elasticidades endógenas”. Revista de EconomiaPolítica, 33,1(130): 60-81.
Ffrench-Davis, r. (2003) “Financial crises and national policy issues: an overview”. In Ffrench-Davis, r. & Grifith-Jones, S. (orgs) From Capital Surges to Drought: Seeking Stability for Emerging Economies. New york, Palgrave macmillan.
Freeman, C. (1995) “The National System of Innovation in historical perspective”. Cambridge Journal of Economics, 19: 5-24.
Gouvea, r.r and Lima, G. (2013) “Balance of payments constrained growth in a multisectoral fra-mework: a panel data investigation”, Journal of Economic Studies, 40(2): 240-254.
Granger, C. (1969) “Investigating causal relations by econometric model and cross-spectral methods”.
Econometrica, 37: 424-438.
Gregory, A.W. and hansen, B.e. (1996) “residual-based tests for cointegration in models with regime shifts”. Journal of Econometrics, 70: 99-126.
Judson, r.A. and Owen, A.L. (1999) “estimating dynamic panel data models: a guide for macroecono-mists”. Economic Letters, 65: 9-15.
Krugman, P. r. (1989) “Differences in income elasticities and trends in a real exchange rates”. Europe-an Economic Review, 33: 1031-54.
Krugman, P. r. (1999) Currencies and Crises. massachusetts, mIT Press.
maddala, G.S. and Wu, S. (1999) “A Comparative Study of unit root Tests With Panel Data and A New Simple Test”. Oxford Bulletin of Economics and Statistics 61: 631-652.
mccombie, J.S.L. and Thirlwall, A.P. (1994) Economic Growth and the Balance-of-Payments Cons-traints. New york, ST.martin’s Press.
moreno-Brid, J.C. (2003) “Capital Flows, Interests Payments and the Balance-of Payments Constrai-ned Growth model: a theoretical and empirical analysis”. Metroeconomica. 54(2): 346-365. Nelson, r. and Winter, S. (1982) An Evolutionary Theory of Economic Change. Cambridge: harvard
university Press.
Nelson, r. (2005) economic development from the perspective of evolutionary economic theory (ht-tp://www.globelics-beijing.cn/paper/richard%20r%20Nelson.pdf).
Nelson, r. (1993) National Innovation Systems: a Comparative Analysis. New york: Oxford universi-ty Press.
Plihon, D. (1995) “A ascensão das inanças especulativas”. Economia e Sociedade, Vol. 5 : 61-78. Porcile, G., Dutra, m. and meirelles, A.J. (2007) “Technology gap, real wages and learning in a
BOP--constrained growth model”. Journal of Post Keynesian Economics, (29): 473-500.
Prebisch, r. (2000a) “O desenvolvimento da economia da América Latina e alguns de seus problemas principais”. In Bielschowsky, r. (org), Cinqüenta Anos de Pensamento na CEPAL. rio de Janei-ro: record.
Prebisch, r. (2000b) “Problemas teóricos e práticos do crescimento econômico”. In Bielschowsky, r. (org), Cinqüenta Anos de Pensamento na CePAL. rio de Janeiro: record.
Thirlwall, A. P. (1979) “The Balance of Payments Constraint as a explanation of International Growth rate Differences”. Banca Nazionale del Lavoro Quarterly Review, 128: 45-53.
Thirlwall, A. and hussain, m. (1982) “The Balance of payments constraint, capital lows and growth `uNCTAD (2002) Trade and Development report. Geneve: united Nations Conference for Trade and Development.
Westerlund, J. (2007) “Testing for error correction in panel data.” Oxford Bulletin of Economics and Statistics 69(6): 709-748.