Mitochondrial control region genetic diversity and maternal ancestry of a
Brangus-Ibage cattle populations
Luiz Ernani Henkes
1,2, Wilson Araújo Silva Jr
3, José Carlos Ferrugem Moraes
4and Tania Azevedo Weimer
1,51
Universidade Federal do Rio Grande do Sul, Departamento de Genética, Porto Alegre, RS, Brazil.
2Vincent Centre for Reproductive Biology, Massachusetts General Hospital, Harvard Medical School,
Boston, MA, USA.
3
Centre for Cell-Based Therapy, Ribeirão Preto, SP, Brazil.
4Empresa Brasileira de Pesquisa Agropecuária, Bagé, RS, Brazil.
5Universidade Luterana do Brasil, Hospital Veterinário, Laboratório de Biotecnologia Animal,
Canoas, RS, Brazil.
Abstract
The genetic diversity of 277 nucleotides in the mitochondrial DNA control region (nt 15,964 to 16,240 in reference sequence) was analyzed in crossbreed beef cattle (Brangus-Ibage, 5/8Bos primigenius taurus x 3/8 Bos primigenius indicus) as well as in some Nellore samples (B. p. indicus). Fifty-seven mutations were found in Brangus-Ibage comprising 18 haplotypes (haplotype diversity, h = 0.851 ± 0.041 and nucleotide diversity, ntd = 0.009 ± 0.006) and 66 in Nellore (h = 1.00 ± 0.27, ntd = 0.014 ± 0.012). These data indicated sequence identities of 99.6 and 92.1% between theB. p. taurus’ reference sequence and Brangus-Ibage and Nellore, respectively. The comparison of our data with sequence data for 612 individuals recovered from GenBank showed a total of 205 haplotypes defined by 99 polymorphic sites. Most of the variability (53%) was due to differentiation within breeds. The phylogenetic tree constructed using the neighbor-joining method showed clearly the well-known dichotomy betweenB. p. taurus and B. p. indicus. The Brangus-Ibage clustered with B. p. taurus lineages; however, the displacement of Nellore from B. p. indicus branch probably indicates a substantial B. p. taurus maternal ancestry in some Nellore samples (obtained from GenBank) and reflects the primarily male-driven introduction of this breed in Brazil.
Key words:bovine mtDNA, maternal lineage, sequence analysis, beef cattle, genetic diversity. Received: November 11, 2003; Accepted: September 4, 2004.
Introduction
Mitochondria are maternally inherited organelles of eukaryotic cells, which play an important role in the cell en-ergy provision. Vertebrate mtDNA includes, in addition to coding regions, a non-coding segment: the displacement loop (D-loop), which is the major control region for mtDNA expression (Taanman, 1999). Therefore, sequence differences in mtDNA D-loop may alter the transcription and/or replication rates (Schutzet al., 1994). However, de-spite its functional importance, this region has a rate of nu-cleotide substitution five to ten times higher than that of nuclear DNA (Brownet al., 1979).
The rapid rate of sequence divergence of mtDNA makes it suitable for the analysis of short-term evolutionary
phenomena, while the maternal mode of inheritance allows the evolutionary relationships between lineages to be de-fined in terms of their phylogenetic divergence without the ambiguities caused by recombination. Therefore, mtDNA polymorphisms have been widely used to investigate the structure of populations, interspecies variability, the evolu-tionary relationships between populations or species and for the identification of maternal lineages (Bradley and Cunningham, 1999; Cymbronet al., 1999; Mageeet al., 2002; Troyet al., 2001). Additionally, there has been an in-creasing interest in its potential use in the development of new biotechnologies (Smithet al., 2000).
In livestock species, mtDNA variability has been studied in connection with maternally inherited physiologi-cal parameters and it has been suggested that bovine mtDNA may affect milk production as well as some other productive traits (Schutzet al., 1992; Schutzet al., 1994; Mannenet al., 2003; Henkeset al., 2004).
Send correspondence to Tania de Azevedo Weimer. Duque de Caxias 910/101, 90010-280 Porto Alegre, RS, Brazil. E-mail: [email protected].
In this study, we provide mtDNA D-loop sequencing data for a Brangus-Ibage cattle population (5/8 Bos primigenius taurusx 3/8Bos primigenius indicus) as well as for some Nellore samples (B. p. indicus). We also ana-lyzed these data pooled with the majority of cattle D-loop sequences available in GenBank in an attempt to advance our understanding of the origins of the maternal lineages that contributed to the formation of this Brangus-Ibage population.
Material and Methods
Brangus-Ibage is a composite beef cattle breed result-ing from the crossresult-ing of Aberdeen Angus cows (ABG) and Nellore bulls (NEL). In Brazil, the early work crossing Nellore and Aberdeen Angus cattle was done by the Brazilian Agricultural Research Corporation (EMBRAPA -CPPSUL) and started about 1945 (Oliveiraet al., 1998).
Samples of whole blood were collected from 49 Bran-gus-Ibage cows from the Brazilian Agricultural Research Corporation and DNA was extracted by the method of Planteet al.(1992). To validate the supposedB. p. taurus
origin of the Brangus-Ibage mtDNA, three DNA samples of Nellore (B. p. indicus)animals were also investigated. These samples were kindly provided by Dr. F.V. Meirelles (for details of these samples see Meirelleset al., 1999).
A 277 nt fragment of the control region (positions 15964-16240) was analyzed from an amplified product ob-tained using primers designed from the reference sequence ofB. p. taurusmtDNA (Andersonet al., 1982) as follows:
MTR 11, 5’ CCT ACG CAA GGG GTA ATG TA 3’ (positions 15,949-15,968) and
MTR 12, 5’ CCT GAA GAA AGA ACC AGA TG 3’ (positions 16,265-16,285).
PCR amplification was carried out by two reactions: the first used 100 ng of DNA in 25µL reaction volume, with 1.25 mM of each deoxynucleotide, 1.25µM of each primer and 1 unit of Taq DNA Polymerase (Pharmacia Biotech) for 30 cycles. Each cycle consisted of denatur-ation at 95 °C for 1 min, annealing at 45 °C for 50 s and ex-tension at 72 °C for 1 min. These double-stranded amplification products were then purified with the Wizard PCR Preps DNA Purification System (Promega Corpora-tion). Aliquots of these products were later used for asym-metric amplification (Wardet al., 1991) using a 1:10 ratio of the same primers. The single-strand amplification prod-ucts were then purified using a SEPHADEX column and phenol/chloroform (1:1) extraction. The purified fragments were sequenced using a T7SequencingTM Kit (Pharmacia Biotech) according to the manufacturer’s instructions. Re-action products were separated by electrophoresis on 6% polyacrylamide gels containing 8 M urea. Gels were fixed in 5% acetic acid and 15% methanol for 10-15 min, dried and exposed to a Kodak XAR film for 24-48 h. Sequences were analyzed in at least two independent gels, aligned and
compared using the BIOEDIT computer package (Hall, 1999). Insertions/deletions were introduced in order to minimize substitutions. The variant sequences observed in this study were submitted to GenBank under accession numbers AF308591 and AF309100-AF3091113 (Bran-gus-Ibage) and AF309097-AF309099 (Nellore).
Intra-populational variation was estimated by com-puting haplotype and nucleotide diversities (Nei and Tajima, 1981; Nei, 1989). The last analysis was corrected for among-site heterogeneity (Tamura and Nei, 1993).
The present sequence data were compared to those of all other breeds for which, at that time, there were at least three available sequences in GenBank (n = 612, GenBank accession numbers AB003793-AB003801, AB044587-AB 044592, AB065119-AB065131, AB079300-AB079365, AB085922, AB085923, AF016060-AF016071, AF01607 9-AF016097, AF022916, AF022918-AF022924, AF034439, AF034441, AF034442, AF034444, AF034445, AF083354, AF209124, AF209126, AF308591, AF309095, AF309096, AF336383-AF336744, AF516713, AF516714, AF531383, AF531412, AF531413, AJ295936, AY119666, AY235731-AY378140, L27720, L27721, L27732, L27733, U51806-U51842 and U92230-U92244). This comparison was restricted to 210 nucleotides to accommo-date the shorter published sequences. Data for all individu-als were available only between nucleotides 16,031 and 16,240. The total analysis was comprised of 664 individu-als (49 Brangus-Ibage, 3 Nellore and 612 from GenBank) from 54 different cattle breeds.
Population genetic structure indexes were estimated by analyses of molecular variance (AMOVA, Excoffieret al., 1992) using the substitution model of Tamura and Nei (1993). The significance of these analyses was tested using a non-parametric permutation procedure (Excoffieret al., 1992). All of these analyses were performed using the Arlequin software (Schneideret al., 2000).
The phylogenetic relationships between populations were determined using the neighbor-joining (NJ) algorithm (Saitou and Nei, 1987). The robustness of the tree was eval-uated by resampling the data by the bootstrap test (Felsenstein, 1985) with 2,000 replicates (Hedges, 1992). These analyses were conducted using MEGA version 2.1 (Kumaret al., 2001). The relatedness of the Brangus-Ibage mtDNA haplotypes was assessed through reduced median networks (Bandeltet al.,1995) constructed with Network software (www.fluxus-engineering.com).
Results
haplotypes were scored only once or twice (Table 2), result-ing in a high total haplotype diversity, h = 0.851±0.041. The nucleotide diversity was estimated at 0.009± 0.006. Most of the variable sites were transitions (transi-tion/transversion rate of 15) and deletion/insertion was identified in one position only (16,191). The mean number of pairwise differences among sequences was 1.91±1.11. Nellore samples showed 3 different mitochondrial lineages defined by 25 polymorphic sites (Table 1), when compared withB. p. taurus’ sequence (Andersonet al., 1982). One deletion was identified at position 16,143 and an A inser-tion was observed at one site (16,200). The Nellore haplotype diversity was estimated at 1.00 ± 0.27 and the nu-cleotide diversity was 0.014 ± 0.012. The mean number of pairwise differences among sequences was 4.00 ± 2.72.
In the whole sample, 57 mutations were found in Brangus-Ibage and 66 in Nellore. These data showed aver-age sequence identities of 99.6% between theB. p. taurus’
reference sequence (Anderson et al., 1982) and Bran-gus-Ibage and of 92.1% between B. p. taurus’sequence (Andersonet al., 1982) and Nellore.
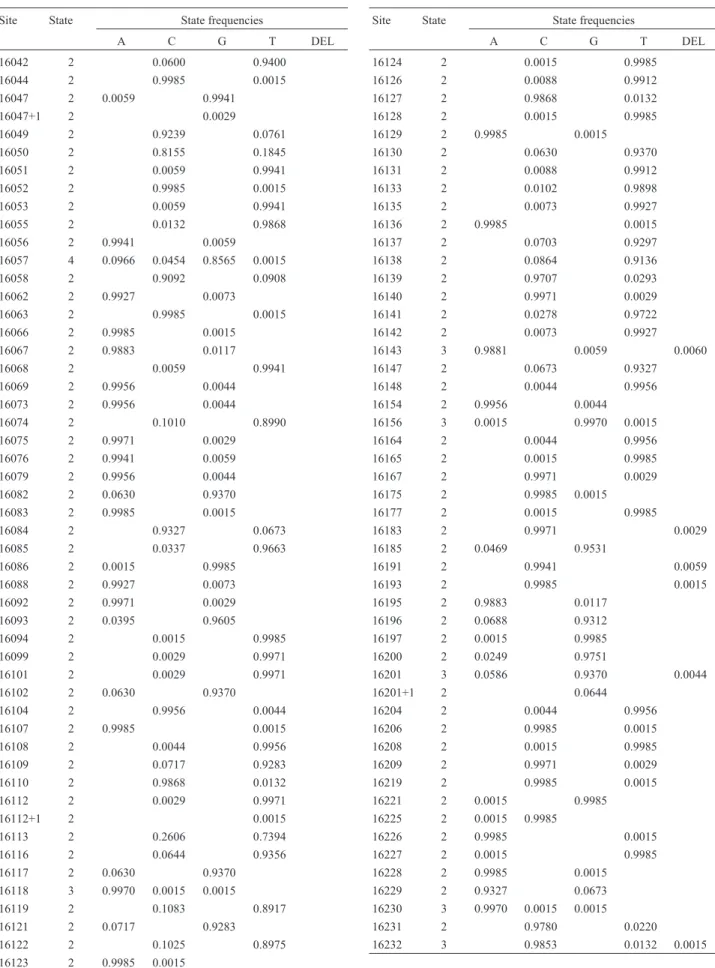
Pooling our mitochondrial sequences with those ob-tained from GenBank defined 99 polymorphic sites (Table 3) and a total of 205 haplotypes. Eighty-seven of the substi-tutions were transitions, 11 were transversions (transi-tions/transversions rate = 7.9) and insertions/deletions were identified at 9 positions. More than two nucleotides were detected only at positions 16,057, 16118, 16156 and 16230 (Table 3). The average pairwise sequence divergence within breeds varied from 0.67 ± 0.67 (Charolais and Friesian) to 4.00 ± 2.73 (Tharparkar,B. p. indicus). Two mutations are being described here for the first time, at po-sition 16177 (T→C) in Brangus-Ibage and at site 16221 (G→A) in Nellore.
Hierarchical analysis of haplotype diversity (Table 4) indicated that 53% of the variability was due to
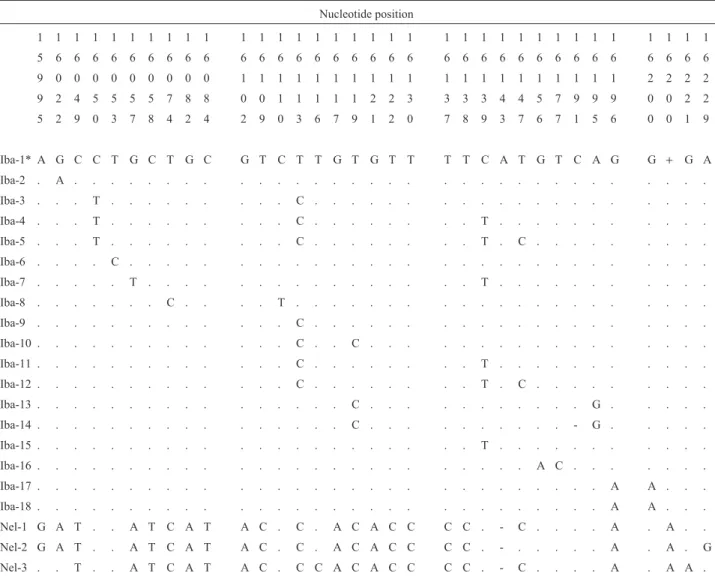
differentia-Table 1- Polymorphic nucleotide sites observed in Brangus-Ibagé and Nellore cows. Only one animal of each haplotypes is presented.
Nucleotide position
1 1 1 1 1 1 1 1 1 1 1 1 1 1 1 1 1 1 1 1 1 1 1 1 1 1 1 1 1 1 1 1 1 1
5 6 6 6 6 6 6 6 6 6 6 6 6 6 6 6 6 6 6 6 6 6 6 6 6 6 6 6 6 6 6 6 6 6
9 0 0 0 0 0 0 0 0 0 1 1 1 1 1 1 1 1 1 1 1 1 1 1 1 1 1 1 1 1 2 2 2 2
9 2 4 5 5 5 5 7 8 8 0 0 1 1 1 1 1 2 2 3 3 3 3 4 4 5 7 9 9 9 0 0 2 2
5 2 9 0 3 7 8 4 2 4 2 9 0 3 6 7 9 1 2 0 7 8 9 3 7 6 7 1 5 6 0 0 1 9
Iba-1* A G C C T G C T G C G T C T T G T G T T T T C A T G T C A G G + G A
Iba-2 . A . . . .
Iba-3 . . . T . . . C . . . .
Iba-4 . . . T . . . C . . . T . . . .
Iba-5 . . . T . . . C . . . T . C . . . .
Iba-6 . . . . C . . . .
Iba-7 . . . T . . . T . . . .
Iba-8 . . . C . . . . T . . . .
Iba-9 . . . C . . . .
Iba-10 . . . C . . C . . . .
Iba-11 . . . C . . . T . . . .
Iba-12 . . . C . . . T . C . . . .
Iba-13 . . . C . . . G . . . . .
Iba-14 . . . C . . . - G . . . . .
Iba-15 . . . T . . . .
Iba-16 . . . A C . . . .
Iba-17 . . . A A . . .
Iba-18 . . . A A . . .
Nel-1 G A T . . A T C A T A C . C . A C A C C C C . - C . . . . A . A . .
Nel-2 G A T . . A T C A T A C . C . A C A C C C C . - . . . A . A . G
Nel-3 . . T . . A T C A T A C . C C A C A C C C C . - C . . . . A . A A .
tion within the breed. The validity of this partition tested by the permutation test was highly significant (p < 0.001).
The phylogenetic tree constructed using the neigh-bor-joining method (Figure 1) shows clearly the two main branches separatingB. p. taurusandB. p. indicus. Bran-gus-Ibage is clustered withB. p. tauruslineages. The re-duced mean network (Figure 2) shows that all haplotypes in Brangus-Ibage root back to the phylogeny through the pri-mary B. p. taurus haplotypes (Troy et al., 2001). The Nellore haplotypes fromB. p. indicusorigin are clearly dis-persed from the main node.
Discussion
As expected Brangus-Ibage sequences were similar to those ofB. p. taurusanimals (99.6% of sequence iden-tity) and distinct from those of Nellore. These data confirm no female contribution ofB. p. indicusto the composition of the maternal lineages of Brangus-Ibage. However, we have detected some samples displaying mutations at posi-tions 16050 and 16113 which, together with the substitu-tion at posisubstitu-tion 16255, would be an indicasubstitu-tion of the presence of haplogroup T1, characteristic of AfricanB. p. taurus(Troyet al., 2001). It is well-known that most Euro-pean modern cattle breeds were introduced to South
Amer-ica at the beginning of the last century and most imported animals were males, which were mated to local cows (cows previously introduced in South America). The Brazilian Aberdeen Angus did not escape this rule (http://www.an-gus.org.br). Some cows of our herd might be descendants from cattle introduced in America by the first Portuguese and Spanish settlers. Since there is evidence of AfricanB. p. taurus influence in Portuguese cattle (Cymbron et al., 1999) and since we found three haplotypes that could be of African origin (Iba-3, Iba-4 and Iba-5), we extended our analysis of these three haplotypes in order to investigate the position 16255. Only one of these haplotypes (Iba-3) pre-sented the mutation T→C at this position, characteristic of African B. p. taurus. The presence of an African B. p. taurus haplotype that had survived might suggest some adaptive value in this specific environment. Interestingly, Brangus-Ibage is situated at an intermediate position be-tween the European and African grouping on the phylogen-etic tree (Figure 1).
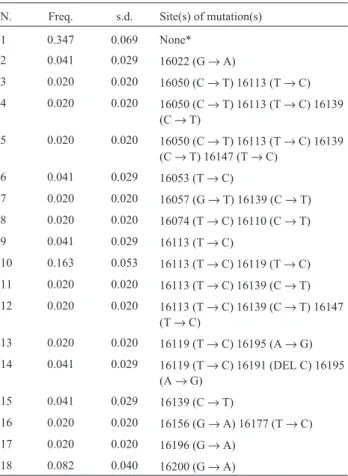
Table 2- Haplotype frequencies in a Brangus-Ibagé cattle population.
N. Freq. s.d. Site(s) of mutation(s)
1 0.347 0.069 None*
2 0.041 0.029 16022 (G→A)
3 0.020 0.020 16050 (C→T) 16113 (T→C)
4 0.020 0.020 16050 (C→T) 16113 (T→C) 16139 (C→T)
5 0.020 0.020 16050 (C→T) 16113 (T→C) 16139 (C→T) 16147 (T→C)
6 0.041 0.029 16053 (T→C)
7 0.020 0.020 16057 (G→T) 16139 (C→T)
8 0.020 0.020 16074 (T→C) 16110 (C→T)
9 0.041 0.029 16113 (T→C)
10 0.163 0.053 16113 (T→C) 16119 (T→C)
11 0.020 0.020 16113 (T→C) 16139 (C→T)
12 0.020 0.020 16113 (T→C) 16139 (C→T) 16147 (T→C)
13 0.020 0.020 16119 (T→C) 16195 (A→G)
14 0.041 0.029 16119 (T→C) 16191 (DEL C) 16195 (A→G)
15 0.041 0.029 16139 (C→T)
16 0.020 0.020 16156 (G→A) 16177 (T→C)
17 0.020 0.020 16196 (G→A)
18 0.082 0.040 16200 (G→A)
*identical toB. p. taurus’reference sequence (Andersonet al., 1982).
Table 3- Polymorphic sites and nucleotide frequencies in a 210 bp D-loop fragment from 664 individuals of 54 different cattle breeds.
Site State State frequencies
A C G T DEL
16042 2 0.0600 0.9400 16044 2 0.9985 0.0015 16047 2 0.0059 0.9941 16047+1 2 0.0029 16049 2 0.9239 0.0761 16050 2 0.8155 0.1845 16051 2 0.0059 0.9941 16052 2 0.9985 0.0015 16053 2 0.0059 0.9941 16055 2 0.0132 0.9868 16056 2 0.9941 0.0059 16057 4 0.0966 0.0454 0.8565 0.0015 16058 2 0.9092 0.0908 16062 2 0.9927 0.0073 16063 2 0.9985 0.0015 16066 2 0.9985 0.0015 16067 2 0.9883 0.0117
16068 2 0.0059 0.9941 16069 2 0.9956 0.0044 16073 2 0.9956 0.0044 16074 2 0.1010 0.8990 16075 2 0.9971 0.0029 16076 2 0.9941 0.0059 16079 2 0.9956 0.0044 16082 2 0.0630 0.9370 16083 2 0.9985 0.0015 16084 2 0.9327 0.0673 16085 2 0.0337 0.9663 16086 2 0.0015 0.9985 16088 2 0.9927 0.0073 16092 2 0.9971 0.0029 16093 2 0.0395 0.9605 16094 2 0.0015 0.9985 16099 2 0.0029 0.9971 16101 2 0.0029 0.9971 16102 2 0.0630 0.9370 16104 2 0.9956 0.0044 16107 2 0.9985 0.0015 16108 2 0.0044 0.9956 16109 2 0.0717 0.9283 16110 2 0.9868 0.0132 16112 2 0.0029 0.9971 16112+1 2 0.0015 16113 2 0.2606 0.7394 16116 2 0.0644 0.9356 16117 2 0.0630 0.9370 16118 3 0.9970 0.0015 0.0015 16119 2 0.1083 0.8917 16121 2 0.0717 0.9283 16122 2 0.1025 0.8975 16123 2 0.9985 0.0015
Site State State frequencies
A C G T DEL
16124 2 0.0015 0.9985 16126 2 0.0088 0.9912 16127 2 0.9868 0.0132 16128 2 0.0015 0.9985 16129 2 0.9985 0.0015 16130 2 0.0630 0.9370 16131 2 0.0088 0.9912 16133 2 0.0102 0.9898 16135 2 0.0073 0.9927 16136 2 0.9985 0.0015 16137 2 0.0703 0.9297 16138 2 0.0864 0.9136 16139 2 0.9707 0.0293 16140 2 0.9971 0.0029 16141 2 0.0278 0.9722 16142 2 0.0073 0.9927 16143 3 0.9881 0.0059 0.0060
16147 2 0.0673 0.9327 16148 2 0.0044 0.9956 16154 2 0.9956 0.0044 16156 3 0.0015 0.9970 0.0015 16164 2 0.0044 0.9956 16165 2 0.0015 0.9985 16167 2 0.9971 0.0029 16175 2 0.9985 0.0015 16177 2 0.0015 0.9985 16183 2 0.9971 0.0029 16185 2 0.0469 0.9531
16191 2 0.9941 0.0059 16193 2 0.9985 0.0015 16195 2 0.9883 0.0117
16196 2 0.0688 0.9312 16197 2 0.0015 0.9985 16200 2 0.0249 0.9751
16201 3 0.0586 0.9370 0.0044 16201+1 2 0.0644
16204 2 0.0044 0.9956 16206 2 0.9985 0.0015 16208 2 0.0015 0.9985 16209 2 0.9971 0.0029 16219 2 0.9985 0.0015 16221 2 0.0015 0.9985 16225 2 0.0015 0.9985
The degree of mtDNA genetic diversity of this sam-ple is equal to that of Aberdeen Angus sequences and is be-tween the range of variation observed for the other cattle samples whose nucleotide diversity ranges from 0.003 (Charolais and Friesian) to 0.019 (B. indicusSahiwal and Tharparkar).
The three Nellore sequences we reported are unique and did not match any sequence of this breed so far de-scribed in GenBank. Our three sequences clustered withB. p. indicusbranch on the phylogenetic tree. However, polled with the GenBank published Nellore sequences, this breed clustered in an intermediate position between the majorB. p. indicusandB. p.taurusbranches, corroborating earlier findings that Brazilian Nellore has a substantialB. p. taurus
maternal ancestry (Meirelleset al., 1999).
The strong transitional bias verified here is a charac-teristic of mtDNA evolution and has been observed not only in cattle but also in other mammalian species (Loftus
et al., 1994; Simonsenet al., 1998; Woodet al., 1996). Three new mutations were observed in Brangus-Ibage and two in Nellore. Among them, the C deletion at position 16,191 and the transition T→C at 16,177 are in Box F of the conserved sequence box, a region of remark-able sequence identity between vertebrates (Steinborn et al., 1998). According to these authors, mutations in this re-gion might be associated with functional constraint. How-ever, we verified that maternal lineages presenting the 16,191 deletion showed significantly higher calf birth weight than animals without this mutation (Henkeset al., 2004). Furthermore, considering the high variation in Nellore mtDNA, it might be interesting to compare the per-formance of Brangus originated from an opposite crossing
(ABG bulls and Nellore cows), carryingB. p. indicus mito-chondria with the performance of the Brangus-Ibage inves-tigated here (originating from the crossing between Nellore bulls and ABG cows) in different environments in order to uncover any specific mitochondrial influence.
Loci with large mutation rates such as D-loop mtDNA frequently exhibit higher population gene diversi-ties than loci with low mutation rates (Chakraborty and Jim, 1992). In the present analysis, 47% of the diversity is due to differentiation among breeds, but this value drops to 14% if onlyB. p. taurussamples are compared. In this last case the variability due to differentiation within population is as high as those verified in other species (Bortolini et al., 1998; Simonsen et al., 1998). Therefore, this very high level of differentiation among breeds verified herein results from the highly divergentB. p. indicussequences.
Acknowledgements
Thanks are due to the Fundação Hemocentro de Ri-beirão Preto, SP (FHCRP) in the person of Dr. Marco Antônio Zago for the facilities provided. We are also grate-ful to Dr. João F. Oliveira for help in the collection of the Brangus-Ibage samples and Dr. Flavio V. Meirelles for providing Nellore samples. This study was supported by Financiadora de Estudos e Projetos (FINEP/ PRONEX), Fundação de Amparo à Pesquisa do Estado do Rio Grande do Sul (FAPERGS), Conselho Nacional de Desenvolvi-mento Científico e Tecnológico (CNPq), Pró-Reitoria de Pesquisa e Pós-Graduação da Universidade Federal do Rio Grande do Sul (PROPESQ/UFRGS), FHCRP, and EMBRAPA/CPPSUL.
References
Anderson S, Bruijn MH, Coulson AR, Eperon IC, Sanger F and Young IG (1982) Complete sequence of bovine mitochon-drial DNA. Conserved features of the mammalian mito-chondrial genome. J Mol Biol 156:683-717.
Bandelt HJ, Forster P, Sykes BC and Richards MB (1995) Mito-chondrial portraits of human populations. Genetics 141:743-753
Bortolini MC, Baptista C, Callegari-Jacques SM, Weimer TA and Salzano FM (1998) Diversity in protein, nuclear DNA, and mtDNA in South Amerinds - Agreement or discrepancy? Ann Hum Genet 62:133-145.
Bradley DG and Cunningham EP (1999) Genetic aspects of do-mestication, common breeds and their origins. In: Fries R and Ruvinsky A (eds) The Genetics of Cattle. CABI Pub-lishing, Oxon, UK, pp 15-31.
Brown WM, George M and Wilson AC (1979) Rapid evolution of animal mitochondrial DNA. Proc Natl Acad Sci USA 76:1967-1971.
Chakraborty R and Jin L (1992) Heterozygote deficiency, popula-tion substructure and their implicapopula-tions in DNA fingerprint-ing. Hum Genet 88:267-272.
Cymbron T, Loftus RT, Malheiro MI and Bradley DG (1999) Mi-tochondrial sequence variation suggests an African
influ-Table 4- Hierarchical analysis of molecular variance.
Source of variation
d.f. Sum of squares
Variance components
Percentage of variation
Among breeds 53 1035.79 1.4264 Va 46.59
Within breeds 610 1028.35 1.6349 Vb 53.41
Total 663 2064.14 3.0613
ence in Portuguese cattle. Proc R Soc Lond B Biol Sci 266:597-603.
Excoffier L, Smouse PE and Quattro JM (1992) Analysis of mo-lecular variance inferred from metric distances among DNA haplotypes: Application to human mitochondrial DNA re-striction data. Genetics 131:479-491.
Felsenstein J (1985) Confidence limits on phylogenies: An ap-proach using the bootstrap. Evolution 39:783-791. Hall T (1999) BioEdit: A user-friendly biological sequence
align-ment editor and analysis program for Windows 95/98/NT. Nucleic Acids Symposium Series 41.
Hedges SB (1992) The number of replications needed for accurate estimation of the bootstrap P value in phylogenetic studies. Mol Biol Evol 9:366-369.
Henkes LE, Benavides MV, Oliveira JFC, Moraes JCF and Weimer TA (2004) Evaluation of cytoplasmic genetic ef-fects on reproductive traits in a beef cattle herd. Ciencia Ru-ral 34 (in press).
Kumar S, Tamura K, Jakobsen IB and Nei M (2001) MEGA2: Molecular evolutionary genetics analysis software. Bioinformatics 17:1244-1245.
Loftus RT, MacHugh DE, Bradley DG, Sharp PM and Cunningham P (1994) Evidence for two independent do-mestications of cattle. Proc Natl Acad Sci USA 91:2757-2761.
Magee DA, Meghen C, Harrison S, Troy CS, Cymbron T, Gaillard C, Morrow A, Maillard JC and Bradley DG (2002) A partial African ancestry for the Creole cattle populations of the Caribbean. J Hered 93:429-432.
Mannen H, Morimoto ML, Oyamat K, Mukai F and Tsuji S (2003) Identification of mitochondrial DNA substitutions related to meat quality in Japanese Black cattle. J Anim Sci 81:68-73.
Meirelles FV, Rosa AJM, Garcia JM, Lobo RB, Smith LC and Duarte FAM (1999) Is the American Zebu really a Bos indicus? Genet Mol Biol 22:543-546.
Nei M (1989) Molecular Evolutionary Genetics. Columbia Uni-versity Press, New York, 512 pp.
Nei M and Tajima F (1981) DNA polymorphism detectable by re-striction endonucleases. Genetics 97:145-163.
Oliveira NM, Salomoni E, Leal JJB, Moraes JCF and Del Duca LOA (1998) Genetic and environment effects on growth of ??? Nellore x ??? Aberdeen Angus beef cattle derived from different crossbreeding schemes. Arch Lat Prod Anim 6:173-188.
Plante Y, Schmutz S and Lang K (1992) Restriction fragment length polymorphism in the mitochondrial DNA of cloned cattle. Theriogenology 38:897-904.
Saitou N and Nei M (1987) The neighbor-joining method: A new method for reconstructing phylogenetic trees. Mol Biol Evol 4:406-425.
Schneider S, Roessli D and Excoffier L (2000) Arlequin: A soft-ware for population genetics data analysis. Ver 2.000. Ge-netics and Biometry Lab, Dept. of Anthropology, University of Geneva.
Schutz MM, Freeman AE, Beitz DC and Mayfield JE (1992) The importance of maternal lineage on milk yield traits of dairy cattle. J Dairy Sci 75:1331-1341.
Schutz MM, Freeman AE, Lindberg GL, Koehler CM and Beitz DC (1994) The effect of mitochondrial DNA on milk pro-duction and health of dairy cattle. Livestock Propro-duction Sci-ence 37:283-295.
Simonsen BT, Siegismund HR and Arctander P (1998) Population structure of African buffalo inferred from mtDNA se-quences and microsatellite loci: High variation but low dif-ferentiation. Mol Ecol 7:225-237.
Smith LC, Bordignon V, Garcia JM and Meirelles FV (2000) Mi-tochondrial genotype segregation and effects during mam-malian development: Applications to biotechnology. Theriogenology 53:35-46.
Steinborn R, Muller M and Brem G (1998) Genetic variation in functionally important domains of the bovine mtDNA con-trol region. Biochim Biophys Acta 1397:295-304.
Taanman JW (1999) The mitochondrial genome: Structure, tran-scription, translation and replication. Biochim Biophys Acta 1410:103-123.
Tamura K and Nei M (1993) Estimation of the number of nucleo-tide substitutions in the control region of mitochondrial DNA in humans and chimpanzees. Mol Biol Evol 10:512-526.
Troy CS, MacHugh DE, Bailey JF, Magee DA, Loftus RT, Cunningham P, Chamberlain AT, Sykes BC and Bradley DG (2001) Genetic evidence for Near-Eastern origins of Eu-ropean cattle. Nature 410:1088-1091.
Ward RH, Frazier BL, DewJager K and Paabo S (1991) Extensive mitochondrial diversity within a single Amerindian tribe. Proc Natl Acad Sci USA 88:8720-8724.
Wood NJ and Phua SH (1996) Variation in the control region se-quence of the sheep mitochondrial genome. Anim Genet 27:25-33.