Genetic characterization of Aberdeen Angus cattle using molecular markers
Luciana Pimentel de Mello Klocker Vasconcellos
1, Daniella Tambasco-Talhari
1, Andréa Pozzi Pereira
1,
Luiz Lehmann Coutinho
2and Luciana Correia de Almeida Regitano
31
Programa de Pós-Graduação em Genética e Evolução, Universidade Federal de São Carlos,
São Carlos, SP, Brazil.
2
Departamento de Produção Animal, Escola Superior de Agricultura Luiz de Queiroz, USP,
Piracicaba, SP, Brazil.
3
Laboratório de Biotecnologia Animal, Embrapa Pecuária Sudeste, São Carlos, SP, Brazil.
Abstract
Aberdeen Angus beef cattle from the Brazilian herd were studied genetically using restriction fragment length polymorphism (RFLP) of theκ-casein - HinfI (CSN3 - HinfI),β-lactoglobulin -HaeIII (LGB - HaeIII) and growth hormoneAluI (GH- AluI) genes, as well as four microsatellites (TEXAN15, CSFM50, BM1224 and BM7160). The RFLP genotypes were determined using the polymerase chain reaction (PCR) followed by digestion with restriction endonucleases and electrophoresis in agarose gels. With the exception of the microsatellite BM7160, which was analyzed in an automatic sequencer, the PCR products were genotyped by silver staining. The allele and genotype frequencies, heterozygosities and gene diversity were estimated. The values for these parameters of variability were comparable to other cattle breeds. The genetic relationship of the Aberdeen Angus to other breeds (Caracu, Canchim, Charolais, Guzerath, Gyr, Nelore, Santa Gertrudis and Simmental) was investigated using Nei’s genetic distance. Cluster analysis placed the Aberdeen Angus in an isolated group in theBos taurus breeds branch. This fact is in agreement with the geographic origin of this breed.
Key words:Aberdeen Angus, bovine, DNA, characterization, RFLP, microsatellite.
Received: April 22, 2002; accepted: December 4, 2002.
Introduction
Various aspects of a population are useful in its char-acterization, including phenotypic traits (monogenic and polygenic), reproduction, geographic distribution, origin and habitat. The genetic characterization of populations, breeds and species allows the assessment of genetic vari-ability, a crucial element in determining breeding strategies and genetic conservation programs.
The assessment of genetic variability is especially important in highly specialized livestock breeds since the use of assisted reproduction techniques, such as artificial insemination and embryo transfer, to maintain these breeds can rapidly reduce the genetic variability of the population. Molecular markers have been widely used to access this variability since they provide information on every region of the genome, regardless of the level of gene expression. RFLP and microsatellites (highly
polymor-phic simple sequence repeats) are currently the most widely used molecular markers, mainly because of the possibility of combining their analysis with the polymer-ase chain reaction (PCR). These markers have been used to explain bovine domestication and migration patterns (Loftuset al., 1994; Bradleyet al., 1994) and to character-ize cattle populations (MacHughet al., 1994; Kemeneset al., 1999; Tambascoet al., 2000). Another application of molecular markers is in uncovering parentage mistakes. This is especially important for guaranteeing the accuracy of breeding programs in which the relationship between individuals is used to estimate breeding value. For this ap-plication, the frequencies of each marker in the population must be known.
Aberdeen Angus cattle have been bred in Scotland for more than 400 years, although the presence of polled cattle in the counties of Aberdeen and Angus dates from prehis-toric times, as suggested by prehisprehis-toric carvings found in these regions (http://www.ansi.okstate.edu/breeds/cattle/). This polled black breed of cattle is considered to have a long life span, high fertility, precocity and easy calving (Hermsdorf, 1941). The latter attribute makes Aberdeen
www.sbg.org.br
Send correspondence to Luciana Correia de Almeida Regitano. Rodovia Washington Luiz km 234, Caixa Postal 339, 13560-970, São Carlos, SP, Brasil. Fone: (0xx16) 261-5611. Fax: (0xx16) 261-5754. E-mail: [email protected].
Angus sires a good choice for first parity females. The polled phenotype is another attractive attribute since it re-duces losses from injury to cohorts and allows for denser occupation. Aberdeen Angus cattle were introduced to Brazil in 1906 by Leonardo Colares Sobrinho in Bagé, in the state of Rio Grande do Sul. In southern Brazil, the breed is used in purebred schemes, whereas in southeast and mid-west Brazil it is used in crosses with Nelore cattle.
The aim of the present work was to evaluate the ge-netic variability of the Brazilian herd of Aberdeen Angus cattle and it’s genetic relationship to other beef cattle breeds used in Brazil, in order to provide information for beef cattle breeding programs.
Material and Methods
Animals
Fifty-two unrelated Aberdeen Angus animals were sampled from the Bela Vista farm at Pardinho, São Paulo state (N = 25), from artificial insemination centers (N = 4), and from two farms in Paraná state (N = 23). These animals were chosen to represent all of the sire lines used in the Bra-zilian Aberdeen Angus herd.
Markers
Four microsatellites (TEXAN15, CSFM50, BM1224 and BM7160) and three RFLPs (CSN3 - HinfI, LGB
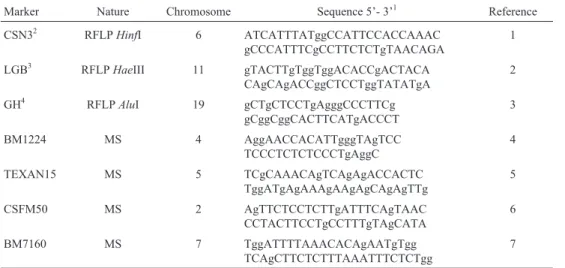
-HaeIII andGH-AluI) were analyzed by PCR. The corre-sponding chromosomal location and primer sequences of these markers are given in Table 1.
DNA extraction
DNA was extracted from blood or semen samples us-ing the saltus-ing out procedures described by Regitano (2001).
Genotyping
PCR reactions were done in a GeneAmp 2400 thermocycler with 200 ng of DNA in PCR solution (20 mM Tris-HCl, pH 8.4, 50 mM KCl) plus 1.5 mM MgCl2, 0.2µM
of each dNTP, 0.4µM of each primer and 0.5 U ofTaq
DNA polymerase in a final volume of 25 µL. For the microsatellite BM7160, the forward primer was labeled with fluorescein at the 5’ end. The RFLP cycling conditions were those described in the references listed in Table 1. Af-ter digestion with the appropriate restriction enzyme, frag-ments were analyzed in 3% agarose gels in 1X TBE buffer, stained with ethidium bromide and photographed using an EDAS (KodakTM) digital system. For microsatellite loci the cycles were the same as described by Bishop et al. (1994) and the PCR products were analyzed in 8% polya-crylamide gels in a manual sequencing apparatus, followed by silver staining (Cominciniet al., 1995). Genotypes for the locus BM7160 were determined with an automatic laser fluorescence DNA sequencer (Pharmacia Biotech).
Statistical analysis
Gene and genotype frequencies were estimated ac-cording to Weir (1996). Hardy-Weinberg equilibrium was tested using an exact probability test (Guo and Thompson, 1992). Heterozygosity (H) and gene diversity (D) were esti-mated as genetic variability parameters (Weir, 1996). Poly-morphic information content (PIC) was estimated according to Botsteinet al., (1980). Nei’s genetic distance
Table 1- Description of molecular markers analyzed.
Marker Nature Chromosome Sequence 5’- 3’1 Reference
CSN32 RFLPHinfI 6 ATCATTTATggCCATTCCACCAAAC
gCCCATTTCgCCTTCTCTgTAACAGA
1
LGB3 RFLPHaeIII 11 gTACTTgTggTggACACCgACTACA
CAgCAgACCggCTCCTggTATATgA
2
GH4 RFLPAluI 19 gCTgCTCCTgAgggCCCTTCg
gCggCggCACTTCATgACCCT
3
BM1224 MS 4 AggAACCACATTgggTAgTCC
TCCCTCTCTCCCTgAggC
4
TEXAN15 MS 5 TCgCAAACAgTCAgAgACCACTC
TggATgAgAAAgAAgAgCAgAgTTg
5
CSFM50 MS 2 AgTTCTCCTCTTgATTTCAgTAAC
CCTACTTCCTgCCTTTgTAgCATA
6
BM7160 MS 7 TggATTTTAAACACAgAATgTgg
TCAgCTTCTCTTTAAATTTCTCTgg
7
1
Sequence of forward primer is given in the upper line of each pair. The bottom line corresponds to the reverse primer. RFLP = restriction fragment length polymorphism, MS = microsatellite.2κ-casein,3β-lactoglobulin,4Growth hormone.
(Nei, 1978) was used to investigate the relationship be-tween the Aberdeen Angus breed and the cattle breeds Caracu, Canchim, Charolais, Guzerath, Gyr, Nelore, Santa Gertrudis and Simmental. This data was used for cluster analysis by the unweighted pair-group method using an arithmetic mean (UPGMA).
Results and Discussion
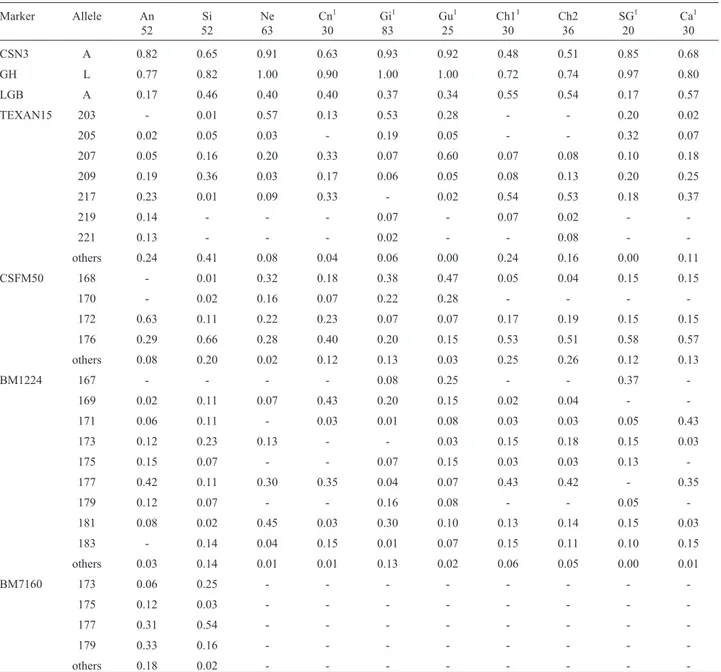
The allele frequencies observed for the seven markers are listed in Table 2, as are the frequencies reported for other breeds in the literature. The only significant departure from Hardy-Weinberg equilibrium (p < 0.05) was for the
GH-AluI locus, which resulted from an excess of homozy-gotes. This disequilibrium may reflect a series of events such as inbreeding, selection, genetic drift or population subdivision. The latter event could also result from sam-pling few individuals from each location, although this would be expected to affect more than one locus. Several reports on the effects ofGH-AluI polymorphism suggest that this is not a neutral mutation for production traits (Schleeet al., 1994b; Pereiraet al., 2002). However, the data obtained here was insufficient to assess this hypothesis in our Aberdeen Angus sample. The microsatellite loci were polymorphic and the number of alleles ranged from 3
Table 2- Allele frequencies for the seven markers in ten bovine populations.
Marker Allele An
52
Si 52
Ne 63
Cn1 30
Gi1 83
Gu1 25
Ch11 30
Ch2 36
SG1 20
Ca1 30
CSN3 A 0.82 0.65 0.91 0.63 0.93 0.92 0.48 0.51 0.85 0.68
GH L 0.77 0.82 1.00 0.90 1.00 1.00 0.72 0.74 0.97 0.80
LGB A 0.17 0.46 0.40 0.40 0.37 0.34 0.55 0.54 0.17 0.57
TEXAN15 203 - 0.01 0.57 0.13 0.53 0.28 - - 0.20 0.02
205 0.02 0.05 0.03 - 0.19 0.05 - - 0.32 0.07
207 0.05 0.16 0.20 0.33 0.07 0.60 0.07 0.08 0.10 0.18
209 0.19 0.36 0.03 0.17 0.06 0.05 0.08 0.13 0.20 0.25
217 0.23 0.01 0.09 0.33 - 0.02 0.54 0.53 0.18 0.37
219 0.14 - - - 0.07 - 0.07 0.02 -
-221 0.13 - - - 0.02 - - 0.08 -
-others 0.24 0.41 0.08 0.04 0.06 0.00 0.24 0.16 0.00 0.11
CSFM50 168 - 0.01 0.32 0.18 0.38 0.47 0.05 0.04 0.15 0.15
170 - 0.02 0.16 0.07 0.22 0.28 - - -
-172 0.63 0.11 0.22 0.23 0.07 0.07 0.17 0.19 0.15 0.15
176 0.29 0.66 0.28 0.40 0.20 0.15 0.53 0.51 0.58 0.57
others 0.08 0.20 0.02 0.12 0.13 0.03 0.25 0.26 0.12 0.13
BM1224 167 - - - - 0.08 0.25 - - 0.37
-169 0.02 0.11 0.07 0.43 0.20 0.15 0.02 0.04 -
-171 0.06 0.11 - 0.03 0.01 0.08 0.03 0.03 0.05 0.43
173 0.12 0.23 0.13 - - 0.03 0.15 0.18 0.15 0.03
175 0.15 0.07 - - 0.07 0.15 0.03 0.03 0.13
-177 0.42 0.11 0.30 0.35 0.04 0.07 0.43 0.42 - 0.35
179 0.12 0.07 - - 0.16 0.08 - - 0.05
-181 0.08 0.02 0.45 0.03 0.30 0.10 0.13 0.14 0.15 0.03
183 - 0.14 0.04 0.15 0.01 0.07 0.15 0.11 0.10 0.15
others 0.03 0.14 0.01 0.01 0.13 0.02 0.06 0.05 0.00 0.01
BM7160 173 0.06 0.25 - - -
-175 0.12 0.03 - - -
-177 0.31 0.54 - - -
-179 0.33 0.16 - - -
-others 0.18 0.02 - - -
(CSFM50) to 12 (TEXAN15). Allele sizes and frequencies are shown in Table 2.
The parameters H and D have been used to assess the genetic variability of a population. The values obtained for Aberdeen Angus cattle based on the seven markers are shown in Table 3. The Aberdeen Angus breed is a highly specialized beef breed in which intense use is made of arti-ficial insemination and embryo transfer, and this could re-sult in a decrease in genetic variability. However, the average heterozygosity (H = 0.491) and the gene diversity (D = 0.554) determined here do not indicate such a reduc-tion. The PIC values for each marker were estimated in or-der to assess the relevance of each locus for linkage analysis (Table 3). With the exception of CSFM50, the microsatellite loci would provide an excellent contribution to a genome scan with more than 70% of the meiosis ex-pected to be informative in this population.
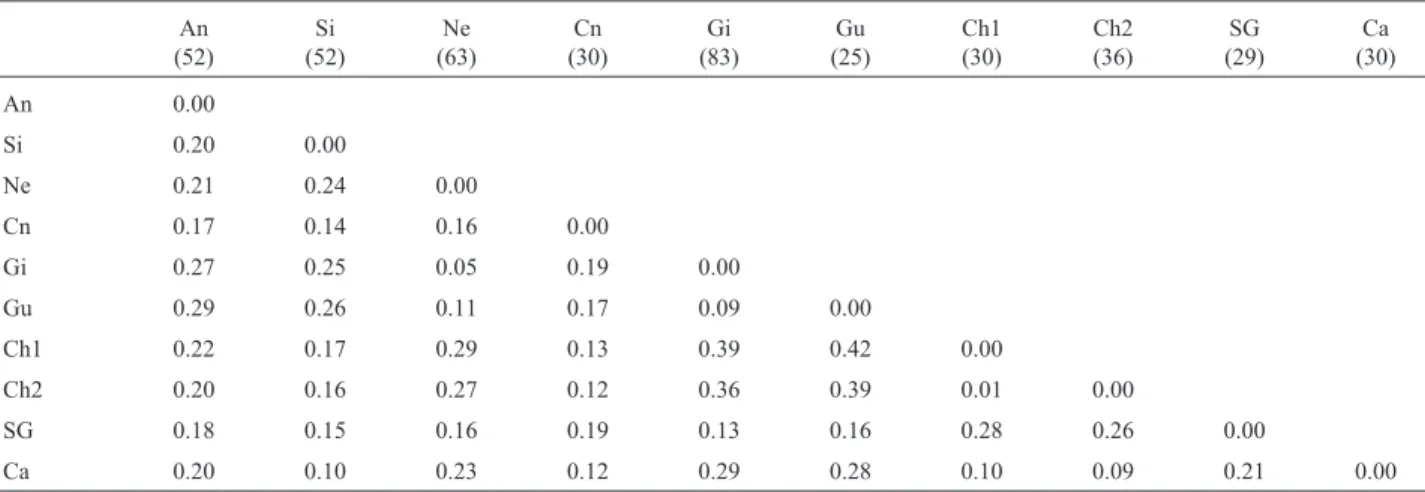
The genetic distances between the Aberdeen Angus population and eight other breeds used in Brazil were deter-mined using published frequency data - Simmental (Regitanoet al.,2000), Charolais (Regitanoet al., 1999), Nelore, Gyr, Guzerath, Charolais, Santa Gertrudis, Can-chim and Caracu RFLP data from Kemeneset al. (1999)
and microsatellite data from Garcia (2001) - (Table 4). The dendrogram obtained for these distances using the UPGMA clustering method (Figure 1) clearly distin-guished the two main groups of cattle (Bos indicusandBos taurus) and placed the crossbred Canchim (5/8 Charo-lais+3/8Bos indicus) in theBos taurusgroup. In this analy-sis, Aberdeen Angus was placed in an isolated group in the
Bos taurus branch. Since Aberdeen Angus is a Scottish breed, it was expected to be less related to continental Euro-pean breeds, such as Charolais and Simmental, because of its geographic separation.
In conclusion, genetic marker analysis showed that the genetic variability of the Brazilian population of Aberdeen Angus was comparable to that of other cattle
Table 3 - Genetic diversity (D), heterozygosity (H) and polymorphic information content (PIC) estimates for Aberdeen Angus cattle.
Marker Number of alleles H D PIC
CSN3 2 0.288 0.302 0.254
LGB 2 0.346 0.358 0.292
GH 2 0.192 0.289 0.245
TEXAN15 12 0.840 0.866 0.842
CSFM50 3 0.596 0.524 0.447
BM1224 8 0.608 0.769 0.736
BM7160 8 0.569 0.770 0.728
Table 4- Nei’s (1978) genetic distances.
An (52)
Si (52)
Ne (63)
Cn (30)
Gi (83)
Gu (25)
Ch1 (30)
Ch2 (36)
SG (29)
Ca (30)
An 0.00
Si 0.20 0.00
Ne 0.21 0.24 0.00
Cn 0.17 0.14 0.16 0.00
Gi 0.27 0.25 0.05 0.19 0.00
Gu 0.29 0.26 0.11 0.17 0.09 0.00
Ch1 0.22 0.17 0.29 0.13 0.39 0.42 0.00
Ch2 0.20 0.16 0.27 0.12 0.36 0.39 0.01 0.00
SG 0.18 0.15 0.16 0.19 0.13 0.16 0.28 0.26 0.00
Ca 0.20 0.10 0.23 0.12 0.29 0.28 0.10 0.09 0.21 0.00
An - Aberdeen Angus, Si - Simmental, Ch - Charolais (Ch1 - Garcia, 2001 and Ch2 - Regitanoet al., 2000), Ca Caracu, Cn Canchim, Ne Nelore, Gi -Gyr, Gu - Guzerath, SG - Santa Gertrudis. Sample size in parentheses.
breeds in Brazil. Genetic distance analysis separated the Aberdeen Angus breed from other taurine breeds, a result consistent with their geographic origins.
Acknowledgements
The authors thank Jovelino Carvalho Mineiro (Bela Vista Farm) for providing blood samples. This work was supported by Embrapa and Fapesp.
References
Bishop MD, Kappes SD, Keele JW, Stone RT, Sunden SLF, Hawkins GA, Solinas Toldo S, Fries R, Grosz MD, Yoo J and Beattie CW (1994) A genetic linkage map for cattle. Genetics136:619-639.
Botstein D, White RL, Skolnick M and Davis RW (1980). Con-struction of genetic linkage map in man using restriction fragment length polymorphisms. Am J Hum Genet 32:314-331.
Bradley DG, MacHugh DE, Loftus RT, Sow RS, Hoste CH and Cunningham EP (1994) Zebu-taurine variation in Y chro-mosomal DNA: a sensitive assay for genetic introgression in West African trypanotolerant cattle populations. Anim Genet 25:7-12.
Burns BM, Taylor JF, Herring AD, Holder MT, Collins JF, Guer-ra TM and Sanders JO (1995). Bovine mirosatellite dinu-cleotide repeat polymorphisms at the TEXAN11, TEXAN12, TEXAN13, TEXAN14 and TEXAN15 loci. Anim Genet 26:201-202.
Comincini S, Leone P, Redaelli L, De Giuli L, Zhang Y and Ferretti, L (1995) Characterization of bovine microsatellites by silver staining. J Anim Breed Genet 112:415-420. Garcia MCC (2001) Estudo da diversidade genética entre sete
raças de bovinos pelo uso de marcadores microssatélites. PhD Thesis, Universidade Estadual Paulista, Botucatu. Guo SW and Thompson EA (1992) Performing the exact test of
Hardy-Weinberg proportion for multiple alleles. Biometrics 48:361-372.
Hermsdorff GE (1941) Zootecnia Especial - Bovinos. Etnologioa das Raças Européias que mais Interessam ao Brasil. Rio de Janeiro, Imprensa Nacional, v. 2, 387 p.
Kemenes PA, Regitano LCA, Rosa AJM, Packer IU, Razook AG, Figueiredo LA, Silva NA, Etchegaray MAL and Coutinho LL (1999)κ-casein,β-lactoglobulin and growth hormone allele genetic distances in Nelore, Gyr, Guzerá, Caracu, Charolais, Canchim and Santa Gertrudis cattle. Genet Mol Biol 22:539-541.
Loftus RT, MacHugh DE, Bradley DG, Sharp PM and Cunningham P (1994) Evidence for two independent do-mestications of cattle. Proc Natl Acad Sci USA 91:2757-2761.
MacHugh DE, Loftus RT, Bradley DG, Sharp PM and Cunningham P (1994) Microsatellite DNA variation within
and among European cattle breeds. Proc R Soc Lond B 256:25-31.
Medrano JF and Aguilar-Cordova E (1990) Genotyping of bovine kappa-casein loci following DNA sequence amplification. Bio/Technology 8:144-146.
Moore SS, Byrne K, Berger KT, Barendse W, McCarthy F, Womack JE and Hetzel DJS (1994) Characterization of 65 bovine microsatellites. Mamm Genome 5:84-90.
Nei M (1978) Estimation of average heterozygosity and genetic distance from a small number of individuals. Genetics 89:583-590.
Pereira AP, Alencar MM, Oliveira HN and Regitano LCA (2002) Association of GH and IGF-1 polymorphisms to growth traits in a synthetic beef cattle breed. In: 28thConference of
the International Society of Animal Genetics, Goettingen, Germany.
Regitano LCA (2001) Extração de DNA para aplicação em reação em cadeia da polimerase (PCR). In: Regitano LCA and Coutinho LL (eds) Biologia Molecular Aplicada à Produção Animal. Embrapa, Brasilia, DF, pp 179-186.
Regitano LCA, Azevedo JL, Vencovsky R, Packer IU, Barbosa PF, Rosa AJM, Silva NA, Etchegaray MAL and Coutinho LL (1999) Selection for breed-specific growth hormone and IGF-I alleles in synthetic beef cattle cross, Canchim. Genet Mol Biol 22:531-537.
Regitano LCA, Vasconcellos LPMK, Jacinto E, Tambasco-Studart M, Tambasco DD, Euclides Filho K, Barbosa PF, Packer IU and Coutinho LL (2000) Genetic distances among Aberdeen Angus, Canchim, Caracu, Nellore and Simmental beef cattle breeds. In: Global Conference on Conservation of Domestic Animal Breeds,5, 2000, Brasília, DF. Proceed-ings...Brasília, DF: Embrapa Genetic Resources and Bio-technology, 2000a 1 CD-ROM.
Ron M, Yoffe O, Ezra E, Medrano JF and Weller JI (1994) Deter-mination of effects of milk protein genotyping on produc-tion traits of Israeli Holstein. J Dairy Sci 77: 11061113. Schlee P, Graml R, Rottmann O and Pirchner F (1994a) Influence
of growth-hormone genotypes on breeding values of Sim-mental bulls. J Anim Breed Genet 111:253-256.
Schlee P, Graml R, Schallenberger E, Schams D, Rottmann O, Olbrich-Bludau A and Pirchner F (1994b). Growth hormone and insulin-like growth factor I concentrations in bulls of various growth hormone genotypes. Theor Appl Genet 88:497-500.
Stone RT, Pulido JC, Duyk GM, Kappes SM, Keele JW and Beat-tie CW (1995) A small-insert bovine genomic library highly enriched for microsatellite repeat sequences. Mamm Ge-nome 6:714-724.
Tambasco DD, Alencar MM, Coutinho LL, Tambasco AJ, Tam-basco MD and Regitano LCA (2000) Caracterização molec-ular de animais da raça Nelore utilizando microssatélites e genes candidatos. Rev Bras Zootec 29:1044-1049. Weir BS (1996). Genetic Data Analysis: Methods for Discrete