1Universidade Federal de Santa Catarina, Centro de Ciências da Saúde, Programa de Pós-Graduação em Nutrição. Florianópolis,
SC, Brasil.
2Universidade Federal do Rio Grande do Sul, Centro de Estudos em Alimentação e Nutrição, Departamento de Nutrição.
R. Ramiro Barcelos, 2400, Rio Branco, 90035-003, Porto Alegre, RS, Brasil. Correspondência para/correspondence to: T STEEMBURGO. E-mail: <[email protected]>.
Article based on the dissertation of CS SANTOS, entitled “Estado nutricional e fatores dietéticos de pacientes com fibrose cística portadores da mutação delta F508”. Universidade Federal de Santa Catarina; 2013.
Support: Coordenação de Aperfeiçoamento de Pessoal de Nível Superior for the financial support by granting research scholarship.
Nutrional status and dietary factors in
cystic fibrosis patients
with
delta F508 mutation
Estado nutricional e fatores dietéticos de pacientes
com fibrose cística portadores da
mutação delta F508
Carina de Sousa SANTOS1
Thais STEEMBURGO2
A B S T R A C T
Objective
To examine the association between nutritional status and dietary factors in children and adolescents with cystic fibrosis that are carriers of delta F508 mutation.
Methods
Cross-sectional study of cystic fibrosis children and adolescents. Nutritional status (body mass index percentile) and dietary intake (3-day diet records presented as a percentage of estimated energy requirement) were assessed.
Results
Thirty six patients (median of 8.6; interquartile range 6.8-12.5 years; 50% male). The Poisson regression analysis showed that the carriers for delta F508 mutation had 60% lower prevalence ratio of body mass index ≥25° (PR=0.4; 95%IC=0.2-0.8) and 90% lower prevalence ratio (PR=0.1; confidence interval 95%IC=0.02-0.3) of
Conclusion
Carriers for delta F508 mutation showed lower body mass index percentile and lower daily caloric consumption when compared with patients without this mutation.
Keywords: Cystic fibrosis. Diet. Nutritional status.
R E S U M O
Objetivo
Avaliar a associação entre estado nutricional e fatores dietéticos na fibrose cística em crianças e adolescentes portadores da mutação delta F508.
Métodos
Estudo transversal com crianças e adolescentes com fibrose cística. Foram avaliados o estado nutricional (índice de massa corporal em percentil) e consumo alimentar (três registros alimentares apresentados em porcentagem da necessidade de energia estimada).
Resultados
Foi avaliado um total de 36 pacientes (mediana de 8,6; intervalo interquartil de 6,8-12,5 anos; 50% do sexo masculino). Na regressão de Poisson, pacientes com a mutação delta F508 apresentaram uma razão de pre-valência 60% menor de índice de massa corporal ≥25° (RP=0,4; IC95%=0,2-0,8) e uma razão de prevalência 90% menor de ≥150% da necessidade de energia estimada (RP=0,1; IC95%=0,02-0,3) quando comparados àqueles com ausência dessa mutação. Modelo ajustado para função pulmonar, necessidade de energia estimada e índice de massa corporal.
Conclusão
Pacientes portadores da mutação delta F508 apresentaram um menor percentil de índice de massa corporal e menor consumo calórico diário quando comparados àqueles sem a mutação.
Palavras-chave: Fibrose cística. Dieta. Estado nutricional.
I N T R O D U C T I O N
Cystic fibrosis is characterized by diverse clinical expressions and a considerable variability
intensity and rate of progression1. The
heterogeneity of such phenotypes may be attributed to 1,940 mutations already identified in the Cystic Fibrosis Transmembrane Conductance Regulator (CFTR)2, which are classified as class I
to V according to the mechanisms through which
they disrupt the membrane protein function3.
There is a substantial interest in the influence of the genotype on the cystic fibrosis phenotype, but the use of class of mutations to establish associations should be intended for population studies only and not for individual prediction purposes because they are not designed to serve as an instrument for clinical
prognosis4. Therefore, studies on the genotype
and phenotype relationships focus on the investigation of delta F508 mutation (deletion of
Phenylalanine at 508)4, which is the most frequent
mutation, found in approximately 70% of alleles worldwide2.
Delta F508 homozygous individuals often have more pronounced clinical manifestations compared to other genotypes: they have higher levels of sweat chloride5, are more susceptible to
pancreatic insufficiency5,6, and have more severe
lung insufficiency, leading to an early diagnosis
of the disease5,6 and higher mortality risk5.
Although there are studies addressing the relation between delta F508 mutation and nutrition-related phenotypes in cystic fibrosis, such as poor nutritional status5-8, high energy consumption9,10,
presence of Mellitus diabetes11, and decreased
levels of essential fatty acids12, these factors have
It is known that the nutritional conditions of cystic fibrosis individuals directly affect the clinical course of the disease, and irrespective of the genotype, an increase by 10 to 100% in
Estimated Energy Requirement (EER) is
recommended to achieve optimum weight gain13.
In this regard, knowing that the type of mutation present in the CFTR gene of cystic fibrosis may determine the between nutritional status and dietary factors in cystic fibrosis children and adolescents that are carriers for delta F508 mutation.
M E T H O D S
This is a cross-sectional study on cystic fibrosis children and adolescents that are under treatment at the Joana Gusmão Children Hospital, a reference center in the state of Santa Catarina
(Florianópolis, Brazil) for pediatric cystic fibrosis
treatment. Children aged ≥5 years (age at which
pulmonary function tests starts) who were tested for the presence of delta F508 mutation and did not have any associated disease that could affect the outcome of the study were invited to participate in the research. Data was collected once a week from September/2012 to June/2013 on the day of the routine treatment of cystic fibrosis at the hospital. The invitations to participate were sent out by the researcher in charge, and the study was carried out after the participants signed the Free and Informed Consent Form.
Participants were divided into three groups according to the presence of mutation: homozygous for delta F508, heterozygous for delta F508, and non-delta F508 mutation. The genotyping test consisted of a screening of the most frequent mutations using fluorescent
allele-specific polymerase chain reaction (TaqMan® SNP
Genotyping Assays; Applied Biosystems, Foster City, California, United States).
The variables were: gender (female/male); patient age (years), age and education (years) of
patient parent or guardian and their economic
level, which was estimated based on their
purchasing power14 (class B/class C - there were
no families belonging to classes A, D, and E).
The patient’s medical record variables
were: use of pancreatic enzymes (yes/no); use of antibiotics and pulmonary bacterial colonization during the period of data collection (yes/no); and type of pulmonary bacterial colonization (Burkholderiacepacia, Pseudomonas aeruginosa,
Staphylococcus aureus, and methicillin-resistant
Staphylococcus aureus). The colonization-type test was performed by collecting material from the oropharynx. Bacteriological determination was performed using the quantitative method, and a
count of >104 CFU/mL indicated presence of
infection15,16.
Lung function was assessed by the estimated value of the Forced Expiratory Volume
in the first second (FEV1) as percentage and
prevalence ratio of <70 and ≥70%using a
spirometer (Spirolab®, Medical International,
Research, Rome, Italy). The 70% cutoff value, considered as mild obstruction, is the last cutoff value for this classification17.
Variables for assessment of the nutritional status
To assess the patients’ nutritional status, Triceps Skinfold (TSF), Mid-Arm Muscle Circumference (MAMC) and Body Mass Index (BMI), which are indicators recommended by the American Consensus of Nutrition for cystic fibrosis18,
were used.
To calculate Mid-Arm Muscle Circumference (centimeter [cm]), the Mid-Arm Circumference (MAC) (cm) and TSF (millimeter [mm]) were
measured following protocols19. MAC was
measured using a Cescorf® steel tape, 0.10 mm
sensitivity in 1 mm (Cescorf Equipamentos para
Esporte Ltda®, Porto Alegre [RS], Brazil).TSF was
Tecnology Inc., Cambridge, Maryland, United States) 0-60 mm scale, 1 mm accuracy, and constant pressure of 10 g/mm² at any aperture. Using MAC and TSF, MAMC was calculated according to the following formula: (= MAC - 3.1416 x [TSF/10])19.
MAMC and TSF were also presented as a percentage of adequacy to fifth percentile, according to the following formula: [= resulting MAMC/TSF/ (MAMC/TSF 5th percentile) x 100]. The percentile
values were related to the values of the National
Health and Nutrition Examination Survey19.
To calculate body mass index, the weight (kilogram [kg]) and height (meters [m]) were
measured following protocols20. The weight was
measured using a BK50F digital scale with 150 kg maximum capacity and 0.1 kg resolution (Balmak®, Santa Barbara d’Oeste [SP], Brazil).
Height was measured using an anthropometer,
with precision of 0.1 cm (Alturaexata®, Belo
Horizonte, Brazil). BMI (=weight/height²)20 was
calculated (percentile) based on the weight and
height using the Stata® software, v.11.0 (Stata
Corp, College Station, Texas, United States). The growth charts used were those developed by the
World Health Organization21. BMI was expressed
as percentile and prevalence of <25° and ≥25°. Cutoff was defined according to American consensus on nutrition for cystic fibrosis, which considers BMI ≥25° as acceptable18.
Variables for dietary intake assessment
Dietary intake data collection
Dietary intake assessment was based on 3 non-consecutive-day diet records (two week days and one day on the weekend) completed at home by the parents. On the day of data collection the patients’ parents or guardians were given oral
and written instructions on how to complete the diet records. The data (3 reports) was collected over the phone at a time convenient to the respondents.
Assessment of dietary intake
Calories, macronutrients, and dietary fibers intake were calculated using the Avanutri®
software v.4.0 (Avanutri & Nutrição Serviços, Três Rios [RJ], Brazil), based on the Brazilian Table of
Foods Composition22 , and whenever the food
was not described in the table used as reference, the product’s label was used. In order to determine
the average intake from the 3-day diet records, two methods of adjustment were used. The first adjustment was the within-person and between-person variance, which resulted in a corrected distribution using an error correction model with
formula syntax in Excel® 2010 (Microsoft
Corporation)23. The second adjustment was made
for total energy intake using the residual method
and the linear regression model with the Stata®
software, version 11.0. The consumption of each macronutrient was considered as a dependent variable, and the total caloric value as an independent variable24. The total average energy
intake over the three days after adjustment was compared to the EER of the Dietary Reference Intakes25.
Presentation of variables to assess dietary intake
Energy intake was expressed as: Total Caloric Value (TCV), considering the daily amount of calories and as a percentage higher than EER (% EER).
Macronutrients and dietary fibers were expressed in grams/day. The macronutrients were also expressed as a percentage in relation to the TCV values (% TCV).
Total caloric value was also shown in three categories of percentages higher than EER (%
EER) <110% EER; ≥110% EER - <150% EER and
≥150% EER. A cutoff value of 10% was chosen
based on a systematic review as requested by the Cystic Fibrosis Foundation, in which, due to the caloric imbalance that occurs in such individuals,
intake from 10 to 100% of the total daily caloric value suggested for healthy individuals. The percentage of contribution of the macronutrients was also investigated according to the minimum and maximum average intake of each macronutrient of the sample.
Quality control and statistical analysis
Data entry was performed with double
data entry using the EpiData® software, version
3.1 (The EpiData Association, Odense, Denmark), followed by the external consistency test. Subsequently, and the data were analyzed using the statistical Stata® software, version 11.0.
With regard to the categorical outcome, the Chi-square test of heterogeneity was used. This test was replaced with the Fisher test when there were estimated values <5 in more than 20% of the cells. When there was a symmetrical numerical outcome, the Analysis of Variance (Anova) test (heterogeneity and trend) was used, and when it was asymmetrical, the Kruskal-Wallis test was used. Categorical variables were described as prevalence at a 95% confidence interval. Symmetrical numeric variables were expressed as mean and standard deviation (±), and asymmetrical variables as median and Interquartile (IQ) range.
Poisson regression analysis was performed with a robust error variation to construct the adjusted model, and the variables were categorized as follows: exposure: presence and absence of delta F508 mutation and outcomes of nutritional status: BMI <25° and ≥25° and dietary intake:
<150% EER and ≥150% EER.
In this model, possible confounding variables were adjusted forward, and the variables
that showed a p-value ≤0.25 in the Wald test,
when associated with the exposure and outcome, were considered; the variables with p-value <0.05
remained in the final model. The p-value of 5%
(p<0.05) was considered the statistical significance level in all analyses performed.
The present study was approved by The Research Ethics Committee for Research Involving
Humans of the Joana Gusmão Children Hospital
(Register nº 011/2012, and opinion issued by the National Research Ethics Commission under nº 03/2012).
R E S U L T S
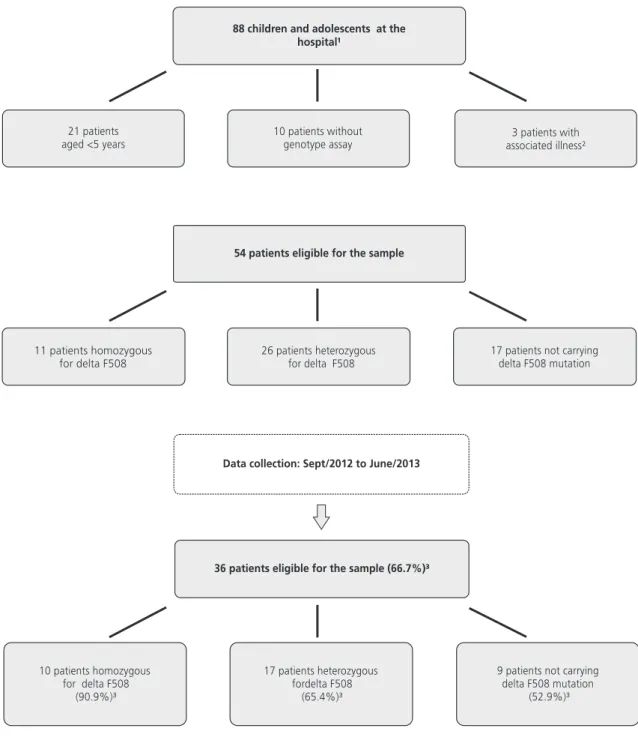
The sample comprised 36 patients (median of 8.6; IQ=6.8-12.5 years; 50.0% male), among which 27.7% (n=10) were homozygous for delta F508, 47.3% (n=17) heterozygous for delta F508, and 25.0% (n=9) did not have this mutation. Figure 1 shows the steps for the sample selection.
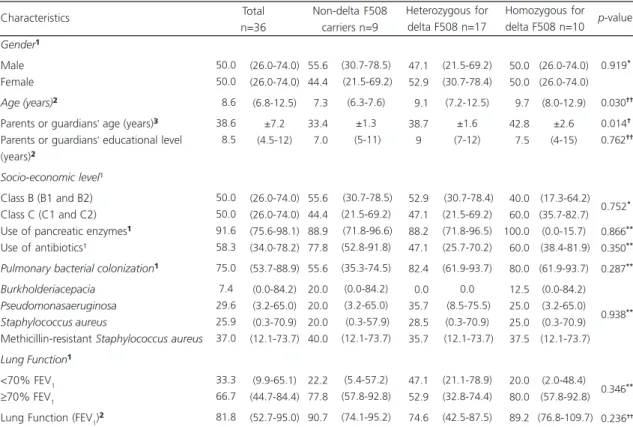
The socio-demographic and clinical characteristics are described in Table 1. The patients’ age (9.7; IQ=8.0-12.9 years; p=0.030) and the parents or guardians’ age (42.8±2.6 years;
p=0.014) were higher for the patients who were
homozygous for delta F508; both results showed significant difference. No significant difference
was observed in the parents or guardians’
educational and economic level groups. Although the prevalence of bacterial colonization was higher between the patients homozygous for
delta F508 (80.0%; 5%CI=61.9-93.7; p=0.287),
this difference was not significant in the comparison between the groups and for the other clinical characteristics.
Indicators of the patients or guardians’
nutritional status are shown in Table 2. Patients carrying delta F508 homozygotes had lower BMI
percentile (21.9±23.3; p=0.017) when compared
to the other groups. A weak relationship was
observed when the prevalence of BMI ≥25 was
assessed, and the patients homozygous for delta F508 had a lower value (40.0%; 5%CI=18.1-61.5;
p=0.077) than those of the other two groups.
However, when the prevalence of BMI ≥25° was
assessed between the patients homozygous and heterozygous for delta F508 and those with absence of F508 mutation, a significant statistical association between these two groups was
absence, Chi-square test p=0.032) (data not included in the Table). No statistical difference was found for the other nutritional status indicators.
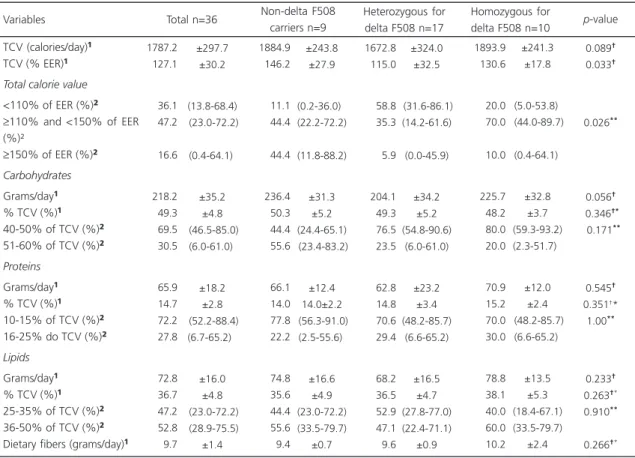
The consumption of calories, macronutrients, and dietary fibers is shown in Table 3. When the
percentage of TCV was higher than the EER was assessed, the patients with delta F508 mutation, either homozygous (130.6±17.8%) or heterozygous (115.0±32.5%), showed lower consumption compared to the non-delta F508 patients
Figure 1. Flowchart of the steps for sample selection. Florianópolis (SC), Brazil, 2012-2013.
Table 1. Socio-demographic and clinical characteristics according to the presence of delta F508 mutation. Florianópolis (SC), Brazil, 2012-2013.
Gender¹
Male Female Age (years)²
Parents or guardians’ age (years)³
Parents or guardians’ educational level (years)²
Socio-economic level¹ Class B (B1 and B2) Class C (C1 and C2) Use of pancreatic enzymes¹
Use of antibiotics¹
Pulmonary bacterial colonization¹
Burkholderiacepacia Pseudomonasaeruginosa Staphylococcus aureus
Methicillin-resistant Staphylococcus aureus Lung Function¹
<70% FEV1
≥70% FEV1
Lung Function (FEV1)²
55.6 44.4 07.3 33.4 07.0 55.6 44.4 88.9 77.8 55.6 20.0 20.0 20.0 40.0 22.2 77.8 90.7 47.1 52.9 09.1 38.7 9 52.9 47.1 88.2 47.1 82.4 00.0 35.7 28.5 35.7 47.1 52.9 74.6 Characteristics Total n=36 Non-delta F508 carriers n=9 Heterozygous for delta F508 n=17
050.0 050.0 009.7 042.8 007.5 00 040.0 060.0 100.0 060.0 080.0 012.5 025.0 025.0 037.5 020.0 080.0 089.2 Homozygous for delta F508 n=10
0.919* 0.030†† 0.014† 0.762†† 0.752* 0.866** 0.350** 0.287** 0.938** 0.346** 0.236†† p-value
Nota:Values expressed as: ¹Prevalence and confidence interval of 95%; ²Median and Interquartile range (25-75%); ³Mean and standard deviation. *Chi-square test of heterogeneity; **Fisher’s exact test; †Analysis of Variance test of heterogeneity; ††Kruskal-Wallis test.
FEV1: Forced Expiratory Volume in the first second.
Table 2. Nutritional status according to the presence of delta F508 mutation. Florianópolis (SC), Brazil, 2012-2013.
BMI (percentile)¹
BMI ≥25° (%)²
TSF (mm)³
TSF Adequacy 5° (%)³
MAMC (cm)¹
Adequacy 5° (%)¹
033.0 058.3 010.9 203.5 013.8 095.9 052.2 088.9 011.0 200.0 013.1 097.2 030.1 052.9 010.9 180.0 014.2 095.9 21.9 40.0 12.2 219.1 13.9 92.1 0.017†* 0.077** 0.629†† 0.597†† 0.433† 0.310†*
Note:Values expressed as: ¹Mean and standard deviation; ²Prevalence and confidence interval of 95%; 3Median and Interquartile Interval (25-75%). **Fisher’s exact test; †Analysis of Variance (Anova) heterogeneity test; †*Anova trend test; ††Kruskal-Wallis test.
BMI: Body Mass Index; TSF: Triceps Skinfold; MAMC: Mid-Arm Muscle Circumference.
Variables Total n=36 Non-delta F508
carriers n=9
Heterozygous for delta F508 n=17
Homozygous for
delta F508 n=10 p-value
(146.2±27.9%; p=0.033). However, when the
TCV was assessed in categories, it was found that both groups of patients, heterozygous for delta F508 (5.9%; 95%CI=0.0-45.9) and homozygous for delta F508 (10.0%; 95%CI=0.4-64.1), had the
lowest values of prevalence ≥150% EER when
compared to the non-delta F508 patients (44.4%;
CI95%=11.8-88.2; p=0.026).
When the prevalence of consumption
≥150% EER was assessed between the groups
with presence (homozygous and heterozygous) and absence of delta F508 mutation, lower
Table 3. Consumption of calories, macronutrients, and dietary fibers according to the presence of delta F508 mutation. Florianópolis (SC), Brazil, 2012-2013.
TCV (calories/day)¹
TCV (% EER)¹
Total calorie value
<110% of EER (%)²
≥110% and <150% of EER (%)²
≥150% of EER (%)²
Carbohydrates
Grams/day¹
% TCV (%)¹
40-50% of TCV (%)²
51-60% of TCV (%)²
Proteins
Grams/day¹
% TCV (%)¹
10-15% of TCV (%)²
16-25% do TCV (%)²
Lipids
Grams/day¹
% TCV (%)¹
25-35% of TCV (%)²
36-50% of TCV (%)²
Dietary fibers (grams/day)¹
Variables 1787.2 0127.1 0036.1 0047.2 0016.6 0218.2 0049.3 0069.5 0030.5 0065.9 0014.7 0072.2 0027.8 0072.8 0036.7 0047.2 0052.8 0009.7 Total n=36 1884.9 146.2 11.1 44.4 44.4 236.4 50.3 44.4 55.6 66.1 14.0 77.8 22.2 74.8 35.6 44.4 55.6 9.4 Non-delta F508 carriers n=9 1672.8 115.0 58.8 35.3 5.9 204.1 49.3 76.5 23.5 62.8 14.8 70.6 29.4 68.2 36.5 52.9 47.1 9.6 1893.9 130.6 20.0 70.0 10.0 225.7 48.2 80.0 20.0 70.9 15.2 70.0 30.0 78.8 38.1 40.0 60.0 10.2 0.089† 0.033† 0.026** 0.056† 0.346†* 0.171** 0.545† 0.351†*
1.00**
0.233† 0.263†* 0.910**
0.266†*
Heterozygous for delta F508 n=17
Homozygous for
delta F508 n=10 p-value
Note: Values expressed as: ¹Mean and standard deviation; ²Prevalence and confidence interval of 95%. **Fisher’s exact test; †Analysis of Variance (Anova) heterogeneity test; †*Anova trend test.
TCV: Total Caloric Value; EER: Estimated Energy Requirement.
Table 4. Poisson regression model: negative association for BMI ≥25°, TCV ≥150% EER, and presence of delta F508 mutation. Florianópolis (SC), Brazil, 2012-2013.
Presence of delta F508 mutation Absence of delta F508 mutation
1
0.4 (0.2-0.8) 0.006
PR (95%CI) p-value*
¹BMI ≥25°
1
0.1 (0.02-0.3) 0.001
PR (95%CI) p-value*
2TCV ≥150% EER
Nota:1Adjusted for FEV
1 (%) and %EER (mean);
2Adjusted for BMI; *Wald test.
BMI: Body Mass Index; TCV: Total Caloric Value; EER: Estimated Energy Requirement;PR: Prevalence Ratio; 95%CI: 95% Confidence Interval.
prevalence of consumption was observed in the
group with the mutation (7.4% versus 44.4%,
Chi-square test, p=0.010) (data not included in
the table). With regard to the macronutrient intake, only the carbohydrates showed a significant statistical difference between the groups, with higher consumption in the group of
patients with absence of delta F508 mutation
(236.4 g/day ±31.3; p=0.056).
A Poisson regression model was developed to estimate the prevalence ratios for BMI ≥25°
and TCV ≥150% EER between the groups with
presence (homozygous and heterozygous for delta F508) and absence of delta F508 mutation
(Table 4). Among the children and adolescents with delta F508 mutation, there was 60% lower prevalence (PR=0.4; 95%CI=0.2-0.8) of BMI ≥25° (adjusted for % FEV and % EER) and 90% lower
prevalence (PR=0.1; 95%CI=0.02-0.3) of TCV
≥150% EER (adjusted for BMI) when compared
to the individuals not carrying this mutation.
D I S C U S S I O N
In this study, a significant association between the low BMI percentile and the presence of delta F508 mutation was found. Patients homozygous for delta F508 had lower BMI
percentile (21.9±23.3°; p=0.017), value lower
than that considered acceptable (BMI ≥25°),
according to the American Consensus on Nutrition for cystic fibrosis18. This result corroborates other
studies, which despite using other indicators (weight, height, weight and height percentile for age, and weight and BMI Z-scores) found values lower than those obtained in the present study
when delta F508 mutation was present5-8. The
latest recommendation for patients with cystic fibrosis is that the BMI should be maintained as far as possible above 50°13, and in general, the
sample average value was not close to that value (33.0°±27.9).
A significant association between the daily energy consumption above EER and the presence of delta F508 mutation was also observed in this study. Even though, on average, all patients’ EER
exceeded 110%13, either the homozygous or
heterozygous patients for delta F50 showed lower average percentages and lower prevalence
≥150% EER when compared to non-delta F508
patients. It is known that as far as cystic fibrosis is concerned, there are many factors that hinder food intake (inflammation and chronic infections, use of medications, intestinal losses, and cough among others) and that energy requirement
increase is individual13,18,26. However, it is
important to examine the type of genotype to
increase the energy requirement once delta F508 mutation has already been associated with
increased energy expenditure per se. In studies
carried out in Philadelphia9 and Australia10, the
energy expenditure of cystic fibrosis children homozygous for delta F508 was 23 and 30% higher, respectively, when compared to healthy children of the control group.
In the final model of Poisson regression, it could be seen that the presence of delta F508 mutation was negatively and significantly associated with BMI and energy consumption. In general, patients carrying delta F508 showed lower caloric intake and, consequently, poorer nutritional status. Individuals with cystic fibrosis with good nutritional status also showed better health conditions, especially better lung function assessed by FEV18. With respect to the presence
of delta F508 mutation, it has already been
observed a protective effect of high BMI on FEV1
in adolescents and children homozygous for said mutation27.
Some results do not show significant association between the nutritional status28,29 and
food intake9,28,30 in the presence of delta F508
mutation, which indicates that irrespective of the large existing variability, which is due to the genotype, environmental factors may also have influence (including beneficial and harmful effects of the treatment).
records to remove the effect of variation of the
individuals’ food intake on themselves and on
others23. The second was the residual method of
nutrients with the purpose of removing the
variation caused by energy consumption24.
Although this study had a small sample size, the number of individuals participating in this research corresponded to more than half of the eligible patients (of a total of 54 eligible individuals, data from 36 patients were collected) at the cystic fibrosis care center of the children hospital in the state of Santa Catarina, Brazil.
Therefore, it can be concluded that the analysis of possible associations with delta F508 mutation is not the answer for all phenotypes, but in the clinical context, a good characterization of cystic fibrosis children and adolescents is possible providing a better guidance and awareness of nutritional care.
Thus, close monitoring of the nutritional status and a specific dietary intervention should be part of the diet therapeutic approach to this disease aiming at improving the patients’ overall health. Further cohort studies are needed for a better understanding of the associations found.
A C K N O W L E D G E M E N T S
The authors wish to thank the Coordenação de Aperfeiçoamento de Pessoal de Nível Superior for the financial support (research scholarship), the Joana Gusmao Children Hospital - a reference center in the state of Santa Catarina (Florianópolis, Brazil) for pediatric treatment of cystic fibrosis, the dietitian Eliana Barbosa, and all participating patients and their families.
C O N T R I B U T O R S
C SANTOS and T STEEMBURGO contributed to the conception and design of the study, data collection, interpretation, and analysis. All authors critically reviewed the manuscript and approved the final version submitted for publication.
R E F E R E N C E S
1. Mickle JE, Cutting GR. Genotype-phenotype relationships in cystic fibrosis. Med Clin North Am. 2000; 84(3):597-607.
2. Cystic Fibrosis Mutation Database. 2013 [2013 Jul 1]. Available from: http://www.genet.sickkids.on.ca/ Home.html
3. O’Sullivan BP, Freedman SD. Cystic fibrosis. The Lancet. 2009; 373(9678):1891-904. http://dx.doi. org/10.1016/S0140-6736(09)60327-5
4. Castellani C, Cuppens H, Macek Jr M, Cassiman JJ, Kerem E, Durie P, et al. Consensus on the use and interpretation of cystic fibrosis mutation analysis in clinical practice. J Cystic Fibrosis. 2008; 7(3):179-96. http://dx.doi.org/10.1016/j.jcf.2008.03.009 5. McKone EF, Emerson SS, Edwards KL, Aitken ML.
Effect of genotype on phenotype and mortality in cystic fibrosis: A retrospective cohort study. The Lancet. 2003; 361(9370):1671-6. http://dx.doi.org/ 10.1016/S0140-6736(03)13368-5
6. Kerem E, Corey M, Kerem B, Rommens J, Markiewicz D, Levison H, et al. The relation between genotype and phenotype in cystic fibrosis: Analysis of the most common mutation (delta F508). New England J Med. 1990; 323(22):1517-22.
7. Keller BM, Casaulta Aebischer C, Kraemer R, Schöni MH. Growth in prepubertal children with cystic fibrosis, homozygous for the delta F508 mutation. J Cystic Fibrosis. 2003; 2(2):76-83. http://dx.doi.org/ 10.1016/S1569-1993(03)00023-7
8. Stephenson AL, Mannik LA, Walsh S, Brotherwood M, Robert R, Darling PB, et al. Longitudinal trends in nutritional status and the relation between lung function and BMI in cystic fibrosis: A population-based cohort study. Am J Clin Nutr. 2013; 97(4):872-7. http://dx.doi.org/10.3945/ajcn.1 12.051409
9. Tomezsko JL, Stallings VA, Kawchak DA, Goin JE, Diamond G, Scanlin TF. Energy expenditure and genotype of children with cystic fibrosis. Pediatr Res. 1994; 35(4 Pt. 1):451-60. http://dx.doi.org/ 10.1203/00006450-199404000-00013
10. Thomson MA, Wilmott RW, Wainwright C, Masters B, Francis PJ, Shepherd RW. Resting energy expenditure, pulmonary inflammation, and genotype in the early course of cystic fibrosis. J Pediatr. 1996; 129(3):367-73.
12. Strandvik B, Gronowitz E, Enlund F, Martinsson T, Wahlstrom J. Essential fatty acid deficiency in relation to genotype in patients with cystic fibrosis. J Pediatr. 2001; 139(5):650-5. http://dx.doi.org/ 10.1067/mpd.2001.118890
13. Stallings VA, Stark LJ, Robinson KA, Feranchak AP, Quinton H. Evidence-based practice recommendations for nutrition-related management of children and adults with cystic fibrosis and pancreatic insufficiency: Results of a systematic review. J Am Dietetic Assoc. 2008; 108(5):832-9. http://dx.doi. org/10.1016/j.jada.2008.02.020
14. Associação Brasileira de Empresas de Pesquisa. Critério de classificação econômica Brasil. São Paulo: Abep; 2013 [acesso 2012 jun 12]. Disponível em: http://www.abep.org/novo/Content.aspx? ContentID=301
15. Hammerschlag MR, Harding L, Macone A, Smith AL, Goldmann D. Bacteriology of sputum in cystic fibrosis: Evaluation of dithiothreitol as a mucolytic agent. J Clin Microbiol. 1980; 11(6):552-7. 16. Gilligan P, Kiska D, Appleman M. Cystic fibrosis
microbiology. Cumitech 43. Washington (DC): ASM Press; 2006.
17. Pellegrino R, Viegi G, Brusasco V, Crapo R, Burgos F, Casaburi R, et al. Interpretative strategies for lung function tests. Euro Respir J. 2005; 26(5):948-68. http://dx.doi.org/10.1183/09031936.05.00 035205
18. Borowitz D, Baker RD, Stallings V. Consensus report on nutrition for pediatric patients with cystic fibrosis. J Pediatr Gastroenterol Nutr. 2002; 35(3):246-59. http://dx.doi.org/10.1097/01.MPG.0 000025580.85615.14
19. Frisancho AR. New norms of upper limb fat and muscle areas for assessment of nutritional status. Am J Clin Nutr. 1981; 34(11):2540-5.
20. World Health Organization. Physical status: The use and interpretation of anthropometry. Report of a WHO Expert Committee. Geneva: WHO; 1995.
21. Wold Health Organization, Multicentre Growth Reference Study Group. WHO Child Growth Standards: Length/height-for-age, weight-for-age,
weight-for-length, weight-for-height and body mass index-for-age: Methods and development. Geneva: WHO; 2006.
22. Universidade Estadual de Campinas. Tabela Brasi-leira de Composição de Alimentos - TACO. 4ª ed. rev. ampl. Campinas: Unicamp; 2011.
23. Slater B, Marchioni DL, Fisberg RM. Estimando a prevalência da ingestão inadequada de nutrientes. Rev Saúde Pública. 2004; 38:599-605. http://dx. doi.org/10.1590/S0034-89102004000400019 24. Willett WC, Howe GR, Kushi LH. Adjustment for
total energy intakein epidemiologic studies. Am J Clin Nutr. 1997; 65(Suppl.):1220S-8S.
25. Instituto de Medicina. Dietary reference intakes for energy, carbohydrate, fiber, fat, fatty acids, cholesterol, protein, and amino acids. Washington (DC): Institute of Medicine; 2002.
26. Sinaasappel M, Stern M, Littlewood J, Wolfe S, Steinkamp G, Heijerman HGM, et al. Nutrition in patients with cystic fibrosis: A European Consensus. J Cystic Fibrosis. 2002; 1(2):51-75.
27. Kastner-Cole D, Palmer CNA, Ogston SA, Mehta A, Mukhopadhyay S. Overweight and obesity in delta F508 homozygous cystic fibrosis. J Pediatr. 2005; 147(3):402-4. http://dx.doi.org/10.1016/j. jpeds.2005.06.003
28. Kawchak DA, Zhao H, Scanlin TF, Tomezsko JL, Cnaan A, Stallings VA. Longitudinal, prospective analysis of dietary intake in children with cystic fibrosis. J Pediatr. 1996; 129(1):119-29.
29. White H, Wolfe SP, Foy J, Morton A, Conway SP, Brownlee KB. Nutritional Intake and status in children with cystic fibrosis: Does age matter? J Pediatric Gastroenterol Nutr. 2007; 44(1):116-23. http://dx.doi.org/10.1097/01.mpg.000023792 9.45846.78
30. Bines JE, Truby HD, Armstrong DS, Phelan PD, Grimwood K. Energy metabolism in infants with cystic fibrosis. J Pediatr. 2002; 140(5):527-33. http:/ /dx.doi.org/10.1067/mpd.2002.123284