RESEARCH ARTICLE
Impact of the CFTR-Potentiator Ivacaftor on
Airway Microbiota in Cystic Fibrosis Patients
Carrying A G551D Mutation
Cédric Bernarde1, Marlène Keravec1, Jérôme Mounier1, Stéphanie Gouriou1, Gilles Rault2,
Claude Férec3,5,6,7, Georges Barbier1, Geneviève Héry-Arnaud1,4
*
1EA 3882-Laboratoire Universitaire de Biodiversité et Ecologie Microbienne, Université de Brest, Brest, France,2Centre de Perharidy, CRCM mixte, Roscoff, France,3UMR1078, Institut National de la Santé et de la Recherche Médicale, Brest, France,4Département de Bactériologie-Virologie, Hygiène et
Parasitologie-Mycologie, CHRU Brest, Brest, France,5Laboratoire de Génétique Moléculaire, CHRU Brest, Brest, France,6Faculté de Médecine et des Sciences de la Santé, Université de Brest, Brest, France,
7Etablissement Français du Sang—Bretagne, Brest, France
*hery@univ-brest.fr
Abstract
Background
Airway microbiota composition has been clearly correlated with many pulmonary diseases, and notably with cystic fibrosis (CF), an autosomal genetic disorder caused by mutation in the CF transmembrane conductance regulator (CFTR). Recently, a new molecule, ivacaf-tor, has been shown to re-establish the functionality of the G551D-mutated CFTR, allowing significant improvement in lung function.
Objective and Methods
The purpose of this study was to follow the evolution of the airway microbiota in CF patients treated with ivacaftor, using quantitative PCR and pyrosequencing of 16S rRNA amplicons, in order to identify quantitative and qualitative changes in bacterial communities. Three G551D children were followed up longitudinally over a mean period of more than one year covering several months before and after initiation of ivacaftor treatment.
Results
129 operational taxonomy units (OTUs), representing 64 genera, were identified. There was no significant difference in total bacterial load before and after treatment. Comparison of global community composition found no significant changes in microbiota. Two OTUs, however, showed contrasting dynamics: after initiation of ivacaftor, the relative abundance of the anaerobePorphyromonas1 increased (p<0.01) and that ofStreptococcus1 (S.mitis
group) decreased (p<0.05), possibly in relation to the anti-Gram-positive properties of iva-caftor. The anaerobePrevotella2 correlated positively with the pulmonary function test FEV-1 (r=0.73, p<0.05). The study confirmed the presumed positive role of anaerobes in lung function.
a11111
OPEN ACCESS
Citation:Bernarde C, Keravec M, Mounier J, Gouriou S, Rault G, Férec C, et al. (2015) Impact of the CFTR-Potentiator Ivacaftor on Airway Microbiota in Cystic Fibrosis Patients Carrying A G551D Mutation. PLoS ONE 10(4): e0124124. doi:10.1371/ journal.pone.0124124
Academic Editor:Michael Tunney, Queens University Belfast, IRELAND
Received:August 21, 2014
Accepted:February 26, 2015
Published:April 8, 2015
Copyright:© 2015 Bernarde et al. This is an open access article distributed under the terms of the
Creative Commons Attribution License, which permits unrestricted use, distribution, and reproduction in any medium, provided the original author and source are credited.
Data Availability Statement:All relevant data are within the paper and its Supporting Information files.
Funding:This study was supported by a grant to GHA from the French Cystic Fibrosis Association
“Vaincre la Mucoviscidose”(contract No. RC20120600696).http://www.vaincrelamuco.org/ ewb_pages/p/projets-finances.php. The funders had no role in study design, data collection and analysis, decision to publish, or preparation of the manuscript.
Conclusion
Several airway microbiota components, notably anaerobes (obligate or facultative anaer-obes), could be valuable biomarkers of lung function improvement under ivacaftor, and could shed light on the pathophysiology of lung disease in CF patients.
Background
With the advent of high-throughput DNA sequencing, the human body can be depicted as a niche of complex microbial communities. Even lungs, long considered sterile, exhibit unex-pected microbial diversity, including in healthy people [1–4]. The composition of the airway microbiota is generally disrupted in patients suffering from respiratory disease, especially when there is an infectious component, as in cystic fibrosis (CF) [1,5,6]. Recent studies of CF airway microbial communities depicted a very complex and abundant microbiota [7–9]. Moreover, several fractions of these microbial communities, and variations in their relative abundance, correlated with CF patients’clinical status [10]. These new findings thus demonstrated the im-portance of studying the microbiota as a whole rather than focusing on a few well-known path-ogens [10,11]. Under this new paradigm, it is important that future clinical studies of
respiratory status in CF patients should considered the airway microbiota in their clinical outcome datasets.
Over 1,900 mutations have been reported in the cystic fibrosis transmembrane conductance regulator (CFTR), the gene that is defective in CF patients [12]. Some of these mutations lead to a gating defect of the CFTR protein located in the apical membrane of epithelial cells; one such is G551D-CFTR, which, while a less common mutation in CF patients (approx. 5% of cases), has a very severe clinical phenotype. Recently, a first-in-class molecule named ivacaftor (VX-770) has been shown to increase the activity of wild-type and defective cell-surface CFTR in vitro[13]. This CFTR potentiator was tested on CF patients bearing at least one
G551D-CFTR allele, and gave very promising results on major clinical parameters (notably, percentage of predicted forced expiratory volume in 1 second: FEV-1), with significant im-provement in lung function [14–16]. Because the physicochemical microenvironment influ-ences CF airway microbiota composition [17], it may be hypothesized that ivacaftor treatment, by inducing changes in ion flux and improving ventilation capacity, leads to a shift in microbial communities. Furthermore, ivacaftor has been shown to have antibacterial properties [18], which may also contribute to modifications in microbiota structure. To date, clinical studies of ivacaftor’s effects have mainly focused on conventional clinical and paraclinical parameters [14–16].
Results and Discussion
Airway microbial community structure in CF patients
16S rRNA pyrosequencing data. A total 498,373 high-quality reads were generated, with an average 24,918 reads per sample. Based on 97% sequence similarity and after normalization to the lowest number of reads for a sample (14,855 reads), 129 operational taxonomic units (OTUs) were identified, representing 64 genera. Mean sequence length was approximately 420 bp. The UPARSE quality filtering tool ensured high confidence for the identified OTUs [19]. The core microbiota, representing OTUs present in at least 50% of samples [20], comprised only 65 OTUs: i.e., half of all OTUs. Of these 65 OTUs, the 16 accounting for more than 1% of the total number of reads were selected for further analysis (major core microbiota). These 16 OTUs belonged to 11 genera,Fusobacterium,Haemophilus(specifically,H.parainfluenzae; H.influenzaedid not belong to the core microbiota),Prevotella,Rothia,Staphylococcus(S. au-reus),Streptococcus,Veillonella,Gemella,Neisseria,PorphyromonasandPeptostreptococcus. These genera were those commonly identified in other studies [10,11,21]. One major difference from previous studies was thatPseudomonas aeruginosawas not found to be part of the core microbiota: only 1 OTU assigned toP.aeruginosawas found in 5 samples obtained from the three patients, but with relative abundance<1% except in 1 sample (S1 Fig); this sample (RM8, S1 Fig), with the highest relative abundance ofP.aeruginosacame from a sample collected after tobramycin treatment had been discontinued, which probably had a significant impact on this particular observation. This low prevalence ofP.aeruginosacan be explained by the young age of the patients, except patient RM who was significantly older (16 years old). This may also explain the wide bacterial diversity within the CF pulmonary core microbiota as compared to findings in adults [6,21]: the present series was pediatric, with a mean age of 12 years, which, according to Coxet al., is the age-group with the highest microbial diversity [22]. The study of patients without traditional CF pathogens may be of great interest, as underlined by Zemanick et al. [10].
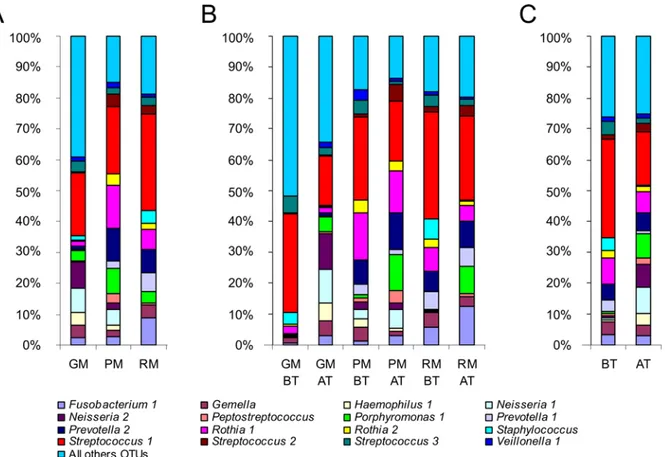
Patient-specific airway microbiotas share a common core. Each patient had a specific airway microbiota some OTUs being specific to one or two patients (results not shown). How-ever, the 16 OTUs belonging to the core microbiota were shared by all patients, although the variability in their relative abundance clearly highlighted 8 OTUs (Fig 1A). They represented 7 genera (i.e.,Veillonella,Streptococcus,Rothia,Prevotella,Porphyromonas,Gemellaand Fuso-bacterium) belonging to the endogenous anaerobic microbiota of the oral airway, the composi-tion of which is indistinguishable from the lung microbiota of healthy subjects [3]. Numerous studies have clearly demonstrated that their detection in sputum samples was not the conse-quence of oral contamination [23,24], which we confirmed by cytological scoring to evaluate salivary contamination. Furthermore, the presence of these bacterial genera suggested that the oral cavity may act as a reservoir for respiratory infection [25,26]. In all patients,Streptococcus 1, corresponding to theS.mitisgroup, was the most abundant OTU in the core microbiota, in agreement with Maeda’s findings that patients harbored at least 1 viridans streptococcus spe-cies, with strong prevalence for theS.mitisgroup [27].
To go further in the comparison of the community structure of samples, principal coordi-nate analysis (PCoA) and unweighted pair-group method using average linkages (UPGMA) clustering were performed using Bray-Curtis (Fig 2) and UniFrac (S2 Fig) distance metrics. Both analyses highlighted a clustering of samples from patient GM (Pseudomonas aeruginosa (Pa) status:“never”), whereas thePa-intermittent patients RM and PM exhibited more similar microbiotas (Figs2andS2; seeTable 1for patient characteristics). This may suggest that, whereas it was thought that each CF patient harbors a specific airway microbiota [8], shared microbiological history, such asP.aeruginosaacquisition, can make for common points in the
microbiota. Moreover, patient GM was the only one who was not under antibiotherapy at the time of sampling (Table 1), which could also be an explanation. Likewise, principal component analysis (PCA) distinguished GM’s samples, which were all negatively located on the F1 axis (Fig 3).
CF airway microbiota dynamics throughout ivacaftor treatment
Study design for optimal assessment of microbiota dynamics, and its limitations. For each CF patient, between 6 and 7 sputum samples were analyzed over a period of 13 months covering 2 periods: before (BT) and after (AT) ivacaftor treatment initiation (Table 1). Sam-pling every 2 months on average with an average 3 samples per period enabled better assess-ment of baseline and post-treatassess-ment microbiotas. This is a major difference compared to the only other study on the subject, in which only 2 samples per patient were analyzed [14]. One limitation of the present study is that it would have been better to have had more evenly spaced samples. For robustness, statistical analyses were conducted pooling all BT and AT sequencing data in order to compare them. AT follow-up data covered both short- and long-term periods, with a lag-time of 1 to 16 months after initiation of ivacaftor. Phase-3 studies showed that the clinical benefit of ivacaftor can be seen within 15 days, and are maintained with treatment Fig 1. Relative abundance (RA) of OTUs belonging to the major core microbiota.A) RA of OTUs for the three patients (GM, PM, and RM) highlighted that each individual harbored his or her own microbiota, even if several genera were shared. B) RA of OTUs before ivacaftor treatment (BT) and after the beginning of ivacaftor treatment (AT) for each patient. RA ofStreptococcus1 showed a tendency to decrease from BT to AT samples, whereas
Porphyromonas1 increased. C) Grouping all BT samples (on the left of the graph) and all AT samples (on the right of the graph) confirmed the tendency observed per patient: after ivacaftor treatment, the RA ofStreptococcus1 decreased while that ofPorphyromonas1 increased.
Fig 2. Analysis of microbiota data for the 20 CF sputum samples based on non-phylogenetic distances.A) Principal coordinate analysis of microbial community structure per patient using Bray Curtis distances. PC1 and PC2 represented 55.3% of the variability. Red triangles: patient GM’s samples. Green circles: patient PM’s samples. Blue squares: patient RM’s samples. B) UPGMA clustering of samples using Bray Curtis distances. BT samples are represented by red branches and AT samples by blue branches. The scale bar represents a 5% sequence divergence.
doi:10.1371/journal.pone.0124124.g002
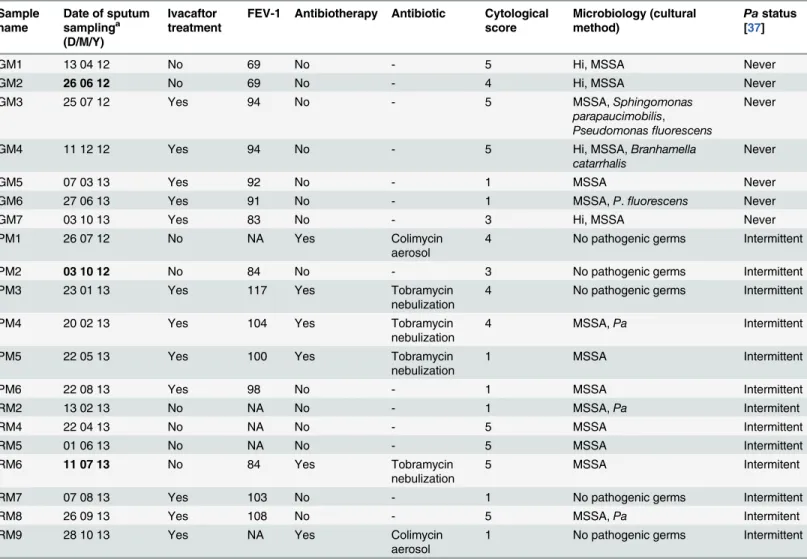
[15,16]. Results obtained for these three patients were consistent with those of clinical trials: FEV-1 improved systematically after ivacaftor administration (Table 1). Furthermore, this close follow-up was necessary considering the young age of the patients and the likely complex-ity of their airway microbiota [22]. The main limitation of the study was the small number of patients: we sought to focus on patients in the same age range and attending the same CF cen-ter in order to limit confounding factors: but patients with the G551D mutation are rare as this mutation accounts for only 4% of CFTR alleles. Moreover, ivacaftor is not presently indicated for patients under 6 years of age, which further restricted candidates for the study. Another limitation of the study was the multiplicity of antibiotherapy schedules received by the 3 pa-tients. Patient GM was receiving no antibiotics as the time of sampling time; patient PM was receiving antibiotics by nebulization at almost each time of sampling; and patient RM occa-sionally received inhaled antibiotics (Table 1). This may have led to interactions, disrupting the Table 1. Patient characteristics associated with each sputum sample.
Sample name
Date of sputum samplinga (D/M/Y)
Ivacaftor treatment
FEV-1 Antibiotherapy Antibiotic Cytological score
Microbiology (cultural method)
Pastatus [37]
GM1 13 04 12 No 69 No - 5 Hi, MSSA Never
GM2 26 06 12 No 69 No - 4 Hi, MSSA Never
GM3 25 07 12 Yes 94 No - 5 MSSA,Sphingomonas
parapaucimobilis,
Pseudomonasfluorescens
Never
GM4 11 12 12 Yes 94 No - 5 Hi, MSSA,Branhamella
catarrhalis
Never
GM5 07 03 13 Yes 92 No - 1 MSSA Never
GM6 27 06 13 Yes 91 No - 1 MSSA,P.fluorescens Never
GM7 03 10 13 Yes 83 No - 3 Hi, MSSA Never
PM1 26 07 12 No NA Yes Colimycin
aerosol
4 No pathogenic germs Intermittent
PM2 03 10 12 No 84 No - 3 No pathogenic germs Intermittent
PM3 23 01 13 Yes 117 Yes Tobramycin
nebulization
4 No pathogenic germs Intermittent
PM4 20 02 13 Yes 104 Yes Tobramycin
nebulization
4 MSSA,Pa Intermittent
PM5 22 05 13 Yes 100 Yes Tobramycin
nebulization
1 MSSA Intermittent
PM6 22 08 13 Yes 98 No - 1 MSSA Intermittent
RM2 13 02 13 No NA No - 1 MSSA,Pa Intermitent
RM4 22 04 13 No NA No - 5 MSSA Intermittent
RM5 01 06 13 No NA No - 5 MSSA Intermittent
RM6 11 07 13 No 84 Yes Tobramycin
nebulization
5 MSSA Intermitent
RM7 07 08 13 Yes 103 No - 1 No pathogenic germs Intermittent
RM8 26 09 13 Yes 108 No - 5 MSSA,Pa Intermitent
RM9 28 10 13 Yes NA Yes Colimycin
aerosol
1 No pathogenic germs Intermittent
a
Dates in bold correspond to the beginning of ivacaftor treatment; sputum samples corresponding to thefirst day of ivacaftor treatment were collected before its administration.
FEV-1: forced expiratory volume in 1 second.
Hi:Haemophilus influenzae, MSSA: methicillin sensitiveStaphylococcus aureus,Pa:Pseudomonas aeruginosa.
effects of ivacaftor on the microbiota. Although studies tend to show that, in the long term, the airway microbiota is resilient [25], it would be very interesting to apply the approach of Zhao et al., who recently addressed the challenging question of the impact of antibiotic exposure on the microbiota by testing different models [28]. Other variables such as age and gender [28] may also act on diversity. Therefore, it will be important to conduct larger studies addressing this issue and taking account of a huge number of variables in order to implement an optimally reliable model of the relationship between disease and treatment.
Overall stability of bacterial density. The evolution of total bacterial load was measured by quantitative PCR (qPCR). The DICO internal control (Argène) showed similar DNA ex-traction efficiency in each sample and the absence of PCR inhibitors. The mean quantity of 16S rRNA gene copies/mL was 8.9 log10 (standard deviation: 0.54), with no significant difference between the BT and AT periods (Colin White test, p>0.05;S2 Table). These data suggest that
ivacaftor treatment did not disturb total bacterial density, in agreement with Rowe [14]. CF microbiota stability seems perennial, despite any factors liable to disturb it, as previously de-scribed for different clinical states [11,25,29]. It might have been expected that the ivacaftor-re-lated improvement in mucociliary clearance [14] would have at least presaged a significant decrease in microbial density. One possible explanation often discussed [10] is that increased contamination by oral bacterial species may counterbalance the reduction in lung species. The Fig 3. Principal component analysis (PCA) of the 20 sputum samples according to different quantitative variables.For each sample, the name contained the group (BT: before ivacaftor treatment; AT: after the beginning of ivacaftor treatment), cytologic class (1 to 5) and presence (AB+) or absence (AB-) of antibiotic treatment. The F1 and F2 axes explained respectively 35% and 22% of the variability. Only 15 samples are represented, because FEV-1 data were lacking for 5 samples (Table 1). The F1 axis was positively correlated with FEV-1,Peptostreptococcus(Pept),Prevotella1&2 (Pre1&2),
Porphyromonas1 (Por1),Rothia1&2 (Rot1&2) andStreptococcus2 (Str2). These variables also correlated positively with each other, suggesting that these taxa may be positively correlated with FEV-1 improvement. In contrast, the F1 axis correlated negatively with qPCR,Haemophilus1 (Ha1),Neisseria1&2 (Neis1&2),Staphylococcus aureus(Sta) andStreptococcus3 (Str3), indicating that these taxa may be more abundant and with higher bacterial density when respiratory capacity is lower. The F2 axis opposedS.aureusand OTUs not belonging to the core microbiota (Oth) toVeillonella(Veil),Neisseria1&2,
Haemophilus1,Gemella(Ge) and higher diversity indices (Shannon index (Shan), phylogenetic diversity whole tree (PDwt) and observed species (ObsSp)).
doi:10.1371/journal.pone.0124124.g003
issue of contamination requires careful consideration [30]. Obtaining samples from the lower airways involves passage through regions that are typically heavily colonized by microbes [31], with a risk of comparing microbiota samples from different niches. To take this phenomenon into account, we applied a quality score to evaluate the degree of salivary contamination (Table 1), and we were able to demonstrate that there was no significant impact of salivary contamination, whether on microbial composition (S3 Fig) or the other variables analyzed (S2 Table), as the 4 observed cytological scores (Table 1) were scattered on the PCA graph (Fig 3).
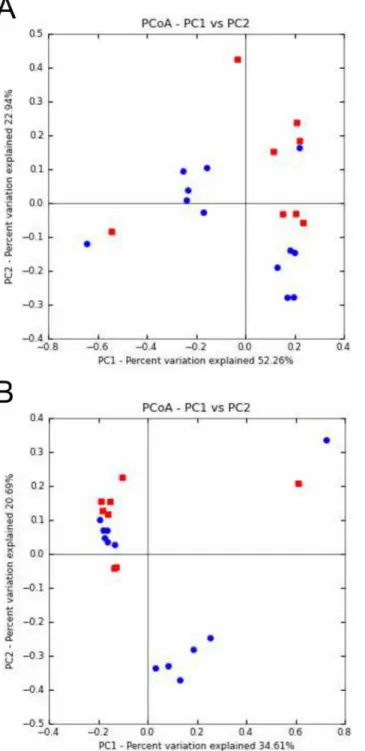
Greater dissimilarity between microbial communities after ivacaftor administration.
PCoA based on UniFrac and Bray Curtis distance metrics revealed groupings of respectively 6 and 7 out of the 8 BT samples (Fig4Aand4B). Conversely, the AT samples did not cluster, suggesting broader dissimilarity in microbial community composition and relative abundance after ivacaftor treatment. These two observations, taken together with a tendency for greater di-versity in AT samples (S4 Fig), suggest that ivacaftor may disrupt the CF microbiota, even if no significant differences were observed on the Colin White test (S2 Table). This tendency corrob-orates the hypothesis made by Roweet al., who suggested increased microbial diversity result-ing from ivacaftor administration [14]. As for other clinical situations in CF [11,25,32], increased biodiversity may be supposed to be associated with improved respiratory function, as well as other clinical endpoints in phase-3 studies of ivacaftor [15,16].
Two components of the airway microbiota showed common evolution under ivacaftor treatment. Although the dynamics of most OTUs were patient-specific (Fig 1B), analyses pooling the common core microbiotas of BT and AT samples (compared using Colin White test) revealed 2 OTUs with significant evolution (Fig 1C,S2 Table). The relative abundance of Streptococcus1 (S.mitisgroup) decreased after ivacaftor treatment initiation (p<0.05), while
that ofPorphyromonas1 increased in all 3 patients (p<0.01); these significant differences were
the only ones observed between the BT and AT groups (S2 Table). One possible explanation of the two-way dynamics of the airway microbiota (Streptococcus1 decrease concomitant to Por-phyromonas1 increase) is in terms of the antibacterial properties of ivacaftor recently described by Reznikovet al. [18]: ivacaftor was shown to be specifically active on Gram-positive bacteria; the fact thatPorphyromonasis Gram-negative, unlikeStreptococcus, may explain these results in part. The authors suggested that ivacaftor’s structure (containing a quinolone ring) could en-able more selectivity against Gram-positive versus Gram-negative bacteria [18]. A second ex-planation could concern inter-species relations within bacterial communities. The two bacteria in question were previously shown to be negatively correlated in dental plaque [33]: Streptococ-cus mitisenhanced the capacity to limitP.gingivalisandP.intermediaadhesion [34]. By analo-gy, the diminution of theS.mitispopulation due to ivacaftor’s antibiotic effect may have allowedPorphyromonas1 to adhere better and then develop.
Potential involvement of several anaerobes in respiratory capacity improvement.
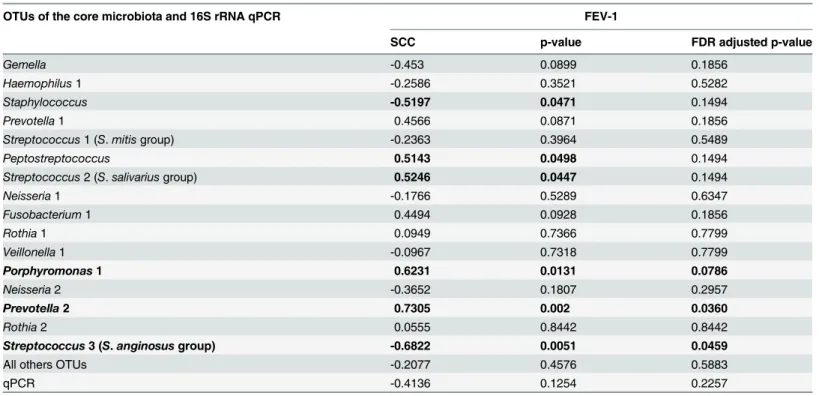
Zemanicket al. demonstrated that anaerobes are associated with less inflammation and better lung function [10]. We confirmed this finding. In the PCA graph (Fig 3), the F1 axis was tively correlated with FEV-1 and with 8 OTUs. Two of these 8 OTUs were significantly posi-tively correlated with FEV-1, as highlighted by the Spearman correlation test (Table 2): Prevotella2 (r = 0.73, p<0.05) andPorphyromonas1 (r = 0.62, p<0.1). Some showed
correla-tion on the adjusted Spearman correlacorrela-tion test (Table 3):Prevotella2 was significantly positive-ly correlated withPeptostreptococcus(r = 0.69, p<0.05) andPrevotella1 (r = 0.61, p<0.05);
Porphyromonas1 was significantly positively correlated withPeptostreptococcus(r = 0.68, p<0.05); andPrevotella 1was significantly positively correlated withStreptococcus2 (r = 0.65,
Fig 4. Principal coordinates analysis (PCoA) of CF sputum samples according to ivacaftor treatment and microbial community composition and abundance.A) PCoA of microbial community structures using weighted and normalized UniFrac phylogenetic distances. A clustering of 6 of the 8 BT samples (before ivacaftor treatment; red squares) was observed. Conversely, AT samples (after ivacaftor treatment; blue circles) appeared scattered on the graph. PC1 and PC2 represented 75.2% of the variability. B) PCoA of microbial community structures using Bray Curtis non-phylogenetic distances. Seven of the 8 BT samples (red squares) were clustered. PC1 and PC2 represented 55.3% of the variability.
doi:10.1371/journal.pone.0124124.g004
Potential implication of Streptococcus 3 (
S
.
anginosus
group) in
respiratory impairment (
Fig 5
)
PCA (Fig 3) revealed that the F1 axis was negatively correlated with 5 OTUs, some of which (Gemella,Haemophilus1,Neisseria1&2,Veillonella1) were themselves positively correlated as shown by the adjusted Spearman correlation test (Table 3). The F1 axis was also negatively cor-related withStreptococcus3 (S.anginosusgroup).Streptococcus3 was significantly negatively correlated with FEV-1 (r = -0.68, p<0.05;Fig 3,Table 2) and withPorphyromonas1 (r = -0.58,
p<0.1;Table 3), an anaerobe significantly positively correlated with FEV-1.
The role of viridans streptococci remains under debate, with conflicting or contradictory correlations reported: either poor outcome or stability [9,35]. Our results highlighted these op-positions betweenStreptococcusspecies. AlthoughStreptococcus1 (S.mitisgroup) did not sig-nificantly correlate with FEV-1 (Fig 3,Table 2), the Colin White test showed a significantly lower relative abundance in the AT group, which showed higher FEV-1 values. Moreover, Streptococcus1 showed a positive correlation withStreptococcus3 (r = 0.56, p<0.1;Table 3), an
OTU significantly negatively correlated with FEV-1 (r = -0.62, p<0.05,Table 2), and negatively
correlated withPorphyromonas1 (r = -0.58, p<0.1,Table 3). Conversely,Streptococcus2 (S.
salivariusgroup) was significantly positively correlated withPrevotella1 (r = 0.65, p<0.05), an
anaerobe potentially positively associated with FEV-1 (Fig 5). The difference between the 3 groups of streptococci in terms of correlation with respiratory function highlights the need for streptococci to be the focus of dedicated study, with accurate species identification.
Table 2. Association between relative abundance of OTUs belonging to the major core microbiota and FEV-1 (n = 15 sputum samples).
OTUs of the core microbiota and 16S rRNA qPCR FEV-1
SCC p-value FDR adjusted p-value
Gemella -0.453 0.0899 0.1856
Haemophilus1 -0.2586 0.3521 0.5282
Staphylococcus -0.5197 0.0471 0.1494
Prevotella1 0.4566 0.0871 0.1856
Streptococcus1 (S.mitisgroup) -0.2363 0.3964 0.5489
Peptostreptococcus 0.5143 0.0498 0.1494
Streptococcus2 (S.salivariusgroup) 0.5246 0.0447 0.1494
Neisseria1 -0.1766 0.5289 0.6347
Fusobacterium1 0.4494 0.0928 0.1856
Rothia1 0.0949 0.7366 0.7799
Veillonella1 -0.0967 0.7318 0.7799
Porphyromonas1 0.6231 0.0131 0.0786
Neisseria2 -0.3652 0.1807 0.2957
Prevotella2 0.7305 0.002 0.0360
Rothia2 0.0555 0.8442 0.8442
Streptococcus3 (S.anginosusgroup) -0.6822 0.0051 0.0459
All others OTUs -0.2077 0.4576 0.5883
qPCR -0.4136 0.1254 0.2257
SCC: Spearman's correlation coefficient (r). FDR: false discovery rate.
Significant correlations after FDR adjustment are in bold (threshold = 0.1).
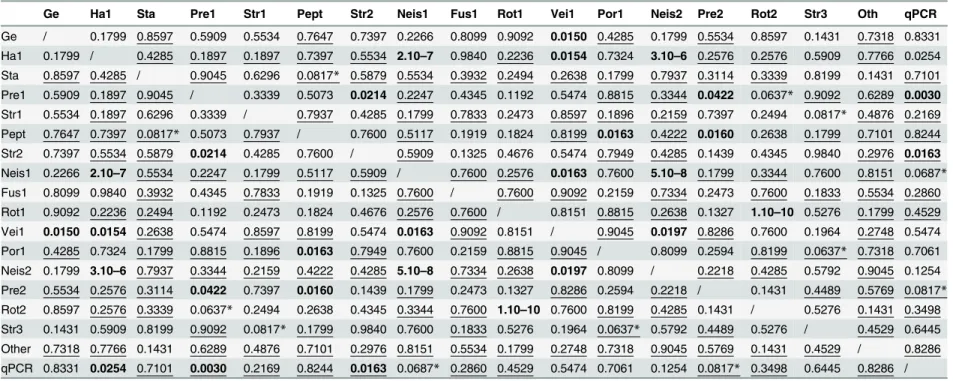
Table 3. FDR adjusted p-values associated with Spearman correlations between relative abundance (RA) of OTUs belonging to the major core microbiota and qPCR results.
Ge Ha1 Sta Pre1 Str1 Pept Str2 Neis1 Fus1 Rot1 Vei1 Por1 Neis2 Pre2 Rot2 Str3 Oth qPCR
Ge / 0.1799 0.8597 0.5909 0.5534 0.7647 0.7397 0.2266 0.8099 0.9092 0.0150 0.4285 0.1799 0.5534 0.8597 0.1431 0.7318 0.8331 Ha1 0.1799 / 0.4285 0.1897 0.1897 0.7397 0.5534 2.10–7 0.9840 0.2236 0.0154 0.7324 3.10–6 0.2576 0.2576 0.5909 0.7766 0.0254 Sta 0.8597 0.4285 / 0.9045 0.6296 0.0817* 0.5879 0.5534 0.3932 0.2494 0.2638 0.1799 0.7937 0.3114 0.3339 0.8199 0.1431 0.7101 Pre1 0.5909 0.1897 0.9045 / 0.3339 0.5073 0.0214 0.2247 0.4345 0.1192 0.5474 0.8815 0.3344 0.0422 0.0637* 0.9092 0.6289 0.0030 Str1 0.5534 0.1897 0.6296 0.3339 / 0.7937 0.4285 0.1799 0.7833 0.2473 0.8597 0.1896 0.2159 0.7397 0.2494 0.0817* 0.4876 0.2169 Pept 0.7647 0.7397 0.0817* 0.5073 0.7937 / 0.7600 0.5117 0.1919 0.1824 0.8199 0.0163 0.4222 0.0160 0.2638 0.1799 0.7101 0.8244 Str2 0.7397 0.5534 0.5879 0.0214 0.4285 0.7600 / 0.5909 0.1325 0.4676 0.5474 0.7949 0.4285 0.1439 0.4345 0.9840 0.2976 0.0163 Neis1 0.2266 2.10–7 0.5534 0.2247 0.1799 0.5117 0.5909 / 0.7600 0.2576 0.0163 0.7600 5.10–8 0.1799 0.3344 0.7600 0.8151 0.0687* Fus1 0.8099 0.9840 0.3932 0.4345 0.7833 0.1919 0.1325 0.7600 / 0.7600 0.9092 0.2159 0.7334 0.2473 0.7600 0.1833 0.5534 0.2860 Rot1 0.9092 0.2236 0.2494 0.1192 0.2473 0.1824 0.4676 0.2576 0.7600 / 0.8151 0.8815 0.2638 0.1327 1.10–10 0.5276 0.1799 0.4529 Vei1 0.0150 0.0154 0.2638 0.5474 0.8597 0.8199 0.5474 0.0163 0.9092 0.8151 / 0.9045 0.0197 0.8286 0.7600 0.1964 0.2748 0.5474 Por1 0.4285 0.7324 0.1799 0.8815 0.1896 0.0163 0.7949 0.7600 0.2159 0.8815 0.9045 / 0.8099 0.2594 0.8199 0.0637* 0.7318 0.7061 Neis2 0.1799 3.10–6 0.7937 0.3344 0.2159 0.4222 0.4285 5.10–8 0.7334 0.2638 0.0197 0.8099 / 0.2218 0.4285 0.5792 0.9045 0.1254 Pre2 0.5534 0.2576 0.3114 0.0422 0.7397 0.0160 0.1439 0.1799 0.2473 0.1327 0.8286 0.2594 0.2218 / 0.1431 0.4489 0.5769 0.0817* Rot2 0.8597 0.2576 0.3339 0.0637* 0.2494 0.2638 0.4345 0.3344 0.7600 1.10–10 0.7600 0.8199 0.4285 0.1431 / 0.5276 0.1431 0.3498 Str3 0.1431 0.5909 0.8199 0.9092 0.0817* 0.1799 0.9840 0.7600 0.1833 0.5276 0.1964 0.0637* 0.5792 0.4489 0.5276 / 0.4529 0.6445 Other 0.7318 0.7766 0.1431 0.6289 0.4876 0.7101 0.2976 0.8151 0.5534 0.1799 0.2748 0.7318 0.9045 0.5769 0.1431 0.4529 / 0.8286 qPCR 0.8331 0.0254 0.7101 0.0030 0.2169 0.8244 0.0163 0.0687* 0.2860 0.4529 0.5474 0.7061 0.1254 0.0817* 0.3498 0.6445 0.8286 /
Significant correlations after FDR adjustment are represented in bold (threshold: 0.05), or are indicated by a star (threshold: 0.1). Negative correlations are underlined (S3 Table). Ge:Gemella, Str2:Streptococcus2 (S.salivariusgroup), Neis2:Neisseria, Ha1:Haemophilus1, Neis1:Neisseria1, Pre2:Prevotella2, Sta:Staphylococcus aureus, Fus1: Fusobacterium1, Rot2:Rothia2, Pre1:Prevotella1, Rot1:Rothia1, Str3:Streptococcus3 (S.anginosusgroup), Str1:Streptococcus1 (S.mitisgroup), Vei1:Veillonella1, Other: OTUs out of the major core microbiota, Pept:Peptostreptococcus, Por1:Pophyromonas1.
doi:10.1371/journal.pone.0124124.t003
Impact
of
Ivacaftor
on
CF
Airway
Microbiota
PLOS
ONE
|DOI:10.137
1/journal.p
one.0124124
April
8,
To sum up, two congruent statistical analyses, the Colin White and Spearman correlation tests, highlighted an association between higher relative abundance ofStreptococcus1&3, BT group and lower FEV-1 values, in contrast to an association between higher relative abundance ofPeptostreptococcus,Prevotella2,Porphyromonas1,Prevotella1, andStreptococcus2 (S. sali-variusgroup), AT group, and higher FEV-1 values (Fig 5). These 7 OTUs could represent po-tential new biomarkers of either deleterious or healthy airway microbiota, interesting for the follow-up of respiratory capacity under ivacaftor. It may be hypothesized that the potentially beneficial bacteria selected by ivacaftor may contribute to improved respiratory function in G551D patients. However, this promising hypothesis remains to be confirmed as it is very diffi-cult to assess the direct impact that ivacaftor itself has on the airway microbiota, given the var-ied courses of antibiotics that two of the patients received during the study period; therefore, a larger study has to be performed on more patients and samples, with stratification according to antibiotic courses.
Fig 5. Dynamics and interrelations of 7 key-role OTUs throughout ivacaftor treatment, and their correlations with lung function.Streptococcus1 (S.
mitisgroup) andPorphyromonas1 were the two OTUs for which a significant association with ivacaftor treatment period emerged (Colin-White test; SeeS2 Table):Streptococcus1 (S.mitisgroup) was associated with sputum samples collected before (p<0.05) andPorphyromonas1 with samples collected after initiation of treatment (p<0.01). The depicted correlations between OTUs were all statistically significant with the adjusted p-values (Spearman correlation test; seeTable 3). Significant correlations between OTUs and lung function (on FEV-1 test) are shown by red arrow when negative (p<0.05) and green arrow (light green if p<0.1; dark green if p<0.05) when positive (adjusted p-values; seeTable 2).
Using anin-vitromodel mimicking the host and its microenvironment would also be rele-vant, as recently proposed by Crabbéet al. [36].
Conclusion
Ivacaftor is a very promising first-in-class molecule, providing improvement in the clinical (in-cluding infectious) parameters of CF patients [14], and does not induce major changes in CF airway microbiota density and composition, but seems to enhance bacterial diversity. Its antibi-otic properties could explain the significant decrease in the relative abundance ofStreptococcus 1 (S.mitisgroup) counterbalanced by an increase in the relative abundance ofPorphyromonas 1. It would be interesting to confirm these opposing microbial dynamics (with a possible bene-ficial side-effect on lung function) in a larger number of patients, and to monitor immune re-sponse. It would also be interesting to decipher the mechanisms involved in the evolution of these bacterial populations, which represent potential biomarkers of lung function. Given the effect of ivacaftor on the intestinal fluid, studying the gut microbiota would be of interest too. Finally, as clinical trials have focused on patients with more prevalent mutations (e.g., dF508 mutation), it is becoming obvious that, with the advent of new treatments that will soon con-cern almost all CF patients, microbiota analysis offers potentially valuable biomarkers for fol-low-up, and a means of improving our understanding of the pathophysiology of the disease.
Methods
Ethics statements, patients, data collection, and sputum sampling
The local institutional review board (Comité de Protection des Personnes Ouest VI) approved the protocol. All patients and relatives gave written informed consent. The specimen archive was registered with the French Ministry of Research and the regional hospital admissions agen-cy (Agence Régionale de l’Hospitalisation)under the number #DC-2008-214.
Three CF children (GM, PM and RM), all female, aged 10, 11 and 16 years respectively, at-tending the Roscoff (France) CF Center were included in the study between April 2012 and Oc-tober 2013. Sputum sampling was performed at a mean 3 months before initiation of ivacaftor and every 2 months (68.9 days) on average for a mean 10 months during treatment. Seven spu-tum specimens were collected for patients GM and RM and 6 for patient PM. The data collect-ed for these 20 sputum samples includcollect-ed pulmonary function, antibiotherapy andP.
aeruginosastatus according to Lee’s definition [37] (Table 1).
Sputum processing
Sputum samples were processed using a standard operating procedure [38]. As recommended by the French guidelines [38], sputum sample quality was verified by cytological examination of fresh smears under a ×10 lens microscope (×100 magnification) and classified according to the number of epithelial cells (EC) and leukocytes (L) (class 1:>25 EC,<10 L in a given
micro-scopic field; class 2:>25 EC, 10–25 L; class 3:>25 EC,>25 L; class 4: 10–25 EC,>25 L; class 5: <10 EC,>25 L). Class 1 and 2 samples, highly contaminated by saliva, were classified as poor
quality; class 3 and 4 samples were classified as moderate quality, and class 5 as appropriate quality. Each sputum sample was mixed with an equal volume of dithiothreitol (Digest-EUR Eurobio, Courtaboeuf, France) and incubated at room temperature for 30 min. Tenμl liquefied
sputum, pure or diluted 1/1,000, was inoculated and incubated in several non-selective and se-lective media, and conventional microbiological diagnosis was conducted as previously de-scribed [39]. After processing for bacterial culture, the liquefied sputum samples were stored at -80°C for further analysis.
DNA extraction
DNA extraction was performed as previously described [39] with the QIamp DNA mini kit (QIAGEN, USA) according to the manufacturer’s guidelines. One hundred and fifty microli-ters of each sputum sample were loaded into new tubes and sonicated for 5 min (Branson 200, USA). Then, proteinase K (0.8 mg per sample, QIAGEN, USA), ATL buffer (180μl per sample)
and the universal control IC2 (10μl per sample) from the DICO Extra r-gene kit (Argène,
Ver-niolle, France) were added, followed by incubation for 3h at 56°C with 15 s vortexing every 30 min. Purified DNA was harvested with elution buffer and quantified using a NanoVue Plus spectrophotometer (GE Healthcare, USA).
Quantitative PCR
Primers, probe and methods previously described by Zemanicket al. were used to quantify total bacterial population by qPCR targeting 16S rRNA gene [10]. qPCR was performed using the TaqMan Gene Expression Master Mix (Applied Biosystems, USA) and the AB7500 Fast Real-Time PCR system (Applied Biosystems, USA). For the standard curve, thePseudomonas aeruginosaPAO1 strain was used. Based on its genome size (6,264,404 bp) and its 16S rRNA copy number (4 copies), DNA concentration was converted into 16S rRNA copy number. Thus, the standard curve obtained (R² = 0.998, slope = -3.974) determined one 16S rRNA copy number per sample, according to the cycle threshold value obtained. The IC2 internal control used the premix included in the DICO extra r-gene kit (Argène) with the Hotstart enzyme (Qiagen).
Sample preparation for pyrosequencing
All DNA samples were diluted to 50 ng/μl and a ~420 pb V3–V4 hypervariable region of the
16S rRNA gene was amplified in duplicate for each sample (total reaction volume, 50μl) using
primers 347F and 803R [40]. Primers comprised an adaptor sequence (A for the reverse prim-er, B for the forward primprim-er, Life Technologies), and each reverse primer had its own multiplex identifier sequence. After pooling amplification products and checking that approximately the same amount of amplicons was produced for each sample by electrophoresis, samples were as-sayed by Agilent Bioanalyzer 2100 (Agilent Technologies). The same amounts were pooled and sequenced by GATC-Biotech (Konstanz, Germany) on a 454 FLX-titanium sequencer (Roche). The DNA sequencing data was deposited in the National Center for Biotechnology Informa-tion (NCBI) Short Read Archive database under the BioProject number PRJNA258369 follow-ing NCBI guidelines [41].
Bioinformatics tools and statistical analysis
The 670,843 raw reads obtained after pyrosequencing were processed as described in the UPARSE pipeline (http://drive5.com/usearch/manual/uparse_cmds.html) with the following quality-filtering parameters: truncation length, 250 bp; truncation to the first nucleotide with quality score<20; maximal expected error, 0.25 [19]. After removal of singletons, sequences
Ecological indices were calculated using QIIME. More precisely, phylogeny and non-phylogeny based metrics were used to describe alpha (phylogenetic diversity whole tree, observed species, Chao1 and Shannon index), and beta diversity (UniFrac and Bray Curtis).
Samples obtained before initiation of ivacaftor treatment were referred to as BT (Before Treatment), and those obtained after as AT (After Treatment). Statistical analysis used StatBox software (Grimmersoft, Paris, France), and R software (Hmisc andstatspackages;
http://www.r-project.org). Conventional checks (normality test, homogeneity of variance) were made before applying the appropriate statistical test. The non-parametric Colin White test [46] was performed on Excel software.
Given that ivacaftor treatment improves FEV-1 [14–16], we checked for a potential correla-tion between FEV-1 and OTUs belonging to the core microbiota on all samples. Thus, the asso-ciation between the quantitative variable FEV1 and the relative abundance of OTUs was tested by Spearman correlation (Table 2; n = 15). The same test was used to check the correlation be-tween OTUs belonging to the major core microbiota (S3 Table; n = 20). The p-values associat-ed with the correlation coefficients (Table 2;S4 Table) were adjusted for false discovery using the Benjamini-Hochberg procedure [47] on the Rstatspackage (Table 3). To be able to sum-marize all data in a graph and analyze links between FEV-1 values, qPCR data and relative abundance of OTUs belonging to the major core microbiota, principal component analysis (PCA) was performed. Each sample was named according to BT versus AT status, cytologic class (1 to 5) and presence (AB+) or absence (AB-) of antibiotic treatment.
Supporting Information
S1 Text.
(DOCX)
S1 Fig. Representation of the relative abundance of OTUs not belonging to the major core microbiota for each of the 20 samples.
(TIF)
S2 Fig. Analysis of microbiota data for the 20 CF sputum samples based on phylogenetic distances.
(TIF)
S3 Fig. Relative abundance (RA) of OTUs belonging to the major core microbiota for all samples (n = 20).The very high RA of“All other OTUs”in samples GM2 and GM4 can be ex-plained by the high prevalence ofHaemophilus2 (Haemophilus influenzae) in these samples (S1 Fig).
(TIF)
S4 Fig. Alpha diversity metrics of CF airway microbiota according to ivacaftor treatment or not.
(TIF)
S1 Table. Coordinates and Cosine square (Cos2) of variables on F1 and F2 axes.
(PDF)
S2 Table. Quantitative variables used for statistical analysis and p-values on Colin White test for all samples, comparing the BT (before treatment) and AT (after treatment) groups for relative abundance of OTUs.
(PDF)
S3 Table. Correlation (Spearman test) between relative abundance of OTUs belonging to the major core microbiota and qPCR results.
(PDF)
S4 Table. Uncorrected p-values associated with Spearman correlations between relative abundance of OTUs belonging to the major core microbiota and qPCR results.
(PDF)
Acknowledgments
We are indebted to Professor Pierre Lehn for his warm support, unfailing encouragement and excellent advice; we wish him a wonderful and well-deserved retirement.
Author Contributions
Conceived and designed the experiments: GHA. Performed the experiments: CB MK JM SG GHA. Analyzed the data: CB GHA GB MK JM. Contributed reagents/materials/analysis tools: GR CF. Wrote the paper: GHA CB.
References
1. Willner D, Furlan M, Haynes M, Schmieder R, Angly FE, Silva J, et al. Metagenomic analysis of respira-tory tract DNA viral communities in cystic fibrosis and non-cystic fibrosis individuals. PLOS One. 2009; 4:e7370. doi:10.1371/journal.pone.0007370PMID:19816605
2. Hilty M, Burke C, Pedro H, Cardenas P, Bush A, Bossley C, et al. Disordered microbial communities in asthmatic airways. PLOS One. 2010; 5:e8578. doi:10.1371/journal.pone.0008578PMID:20052417
3. Charlson ES, Bittinger K, Haas AR, Fitzgerald AS, Frank I, Yadav A, et al. Topographical continuity of bacterial populations in the healthy human respiratory tract. Am J Respir Crit Care Med. 2011; 184:957–963. doi:10.1164/rccm.201104-0655OCPMID:21680950
4. Segal LN, Alekseyenko AV, Clemente JC, Kulkarni R, Wu B, Gao Z, et al. Enrichment of lung micro-biome with supraglottic taxa is associated with increased pulmonary inflammation. Micromicro-biome. 2013; 1:19. doi:10.1186/2049-2618-1-19PMID:24450871
5. Rogers GB, Hart CA, Mason JR, Hughes M, Walshaw MJ, Bruce KD. Bacterial diversity in cases of lung infection in cystic fibrosis patients: 16S ribosomal DNA (rDNA) length heterogeneity PCR and 16S rDNA terminal restriction fragment length polymorphism profiling. J Clin Microbiol. 2003; 41:3548– 3558. PMID:12904354
6. Delhaes L, Monchy S, Fréalle E, Hubans C, Salleron J, Leroy S, et al. The airway microbiota in cystic fi-brosis: a complex fungal and bacterial community-implications for therapeutic management. PLOS One. 2012; 7:e36313. doi:10.1371/journal.pone.0036313PMID:22558432
7. Rogers GB, Carroll MP, Serisier DJ, Hockey PM, Jones G, Bruce KD. Characterization of bacterial community diversity in cystic fibrosis lung infections by use of 16s ribosomal DNA terminal restriction fragment length polymorphism profiling. J Clin Microbiol. 2004; 42:5176–5183. PMID:15528712
8. Harris JK, De Groote MA, Sagel SD, Zemanick ET, Kapsner R, Penvari C, et al. Molecular identification of bacteria in bronchoalveolar lavage fluid from children with cystic fibrosis. Proc Natl Acad Sci U S A. 2007; 104:20529–20533. PMID:18077362
9. Sibley CD, Parkins MD, Rabin HR, Duan K, Norgaard JC, Surette MG. A polymicrobial perspective of pulmonary infections exposes an enigmatic pathogen in cystic fibrosis patients. Proc Natl Acad Sci U S A. 2008; 105:15070–15075. doi:10.1073/pnas.0804326105PMID:18812504
10. Zemanick ET, Harris JK, Wagner BD, Robertson CE, Sagel SD, Stevens MJ, et al. Inflammation and airway microbiota during cystic fibrosis pulmonary exacerbations. PLOS One. 2013; 8:e62917. doi:10. 1371/journal.pone.0062917PMID:23646159
11. Zhao J, Schloss PD, Kalikin LM, Carmody LA, Foster BK, Petrosino JF, et al. (2012) Decade-long bac-terial community dynamics in cystic fibrosis airways. Proc Natl Acad Sci U S A. 2010; 109:5809–5814. doi:10.1073/pnas.1120577109PMID:22451929
13. Van Goor F, Hadida S, Grootenhuis PDJ, Burton B, Cao D, Neuberger T, et al. (2009) Rescue of CF air-way epithelial cell function in vitro by a CFTR potentiator, VX-770. Proc Natl Acad Sci 106:
18825–18830. doi:10.1073/pnas.0904709106PMID:19846789
14. Rowe SM, Heltshe SL, Gonska T, Donaldson SH, Borowitz D, Gelfond D, et al. (2014) Clinical Mecha-nism of the CFTR Potentiator Ivacaftor in G551D-Mediated Cystic Fibrosis. Am J Respir Crit Care Med 90:175–84.
15. Ramsey BW, Davies J, McElvaney NG, Tullis E, Bell SC, Dřevínek P, et al. A CFTR potentiator in pa-tients with cystic fibrosis and the G551D mutation. N Engl J Med. 2011; 365:1663–1672. doi:10.1056/ NEJMoa1105185PMID:22047557
16. Davies JC, Wainwright CE, Canny GJ, Chilvers MA, Howenstine MS, Munck A, et al. Efficacy and safe-ty of ivacaftor in patients aged 6 to 11 years with cystic fibrosis with a G551D mutation. Am J Respir Crit Care Med. 2013. 187:1219–1225. doi:10.1164/rccm.201301-0153OCPMID:23590265
17. Quinn RA, Lim YW, Maughan H, Conrad D, Rohwer F, Whiteson KL. Biogeochemical forces shape the composition and physiology of polymicrobial communities in the cystic fibrosis lung. mBio. 2014; 5: e00956–00913. doi:10.1128/mBio.00956-14PMID:24667707
18. Reznikov LR, Abou Alaiwa MH, Dohrn CL, Gansemer ND, Diekema DJ, Stoltz DA, et al. Antibacterial properties of the CFTR potentiator ivacaftor. J Cyst Fibros. 2014 Sep; 13(5):515–9. doi:10.1016/j.jcf. 2014.02.004PMID:24618508
19. Edgar RC. UPARSE: highly accurate OTU sequences from microbial amplicon reads. Nat Methods. 2013. 10:996–998. doi:10.1038/nmeth.2604PMID:23955772
20. Tap J, Mondot S, Levenez F, Pelletier E, Caron C, Furet JP, et al. Towards the human intestinal micro-biota phylogenetic core. Environ Microbiol. 2009; 11(10):2574–2584. doi:10.1111/j.1462-2920.2009. 01982.xPMID:19601958
21. Guss AM, Roeselers G, Newton ILG, Young CR, Klepac-Ceraj V, Lory S, et al. Phylogenetic and meta-bolic diversity of bacteria associated with cystic fibrosis. ISME J. 2011; 5:20–29. doi:10.1038/ismej. 2010.88PMID:20631810
22. Cox MJ, Allgaier M, Taylor B, Baek MS, Huang YJ, Daly RA, et al. Airway microbiota and pathogen abundance in age-stratified cystic fibrosis patients. PLOS One. 2010; 5:e11044. doi:10.1371/journal. pone.0011044PMID:20585638
23. Rogers GB, Carroll MP, Serisier DJ, Hockey PM, Jones G, Kehagia V, et al. Use of 16S rRNA gene pro-filing by terminal restriction fragment length polymorphism analysis to compare bacterial communities in sputum and mouthwash samples from patients with cystic fibrosis. J Clin Microbiol. 2006; 44:2601– 2604. PMID:16825392
24. Tunney MM, Field TR, Moriarty TF, Patrick S, Doering G, Muhlebach MS, et al. Detection of anaerobic bacteria in high numbers in sputum from patients with cystic fibrosis. Am J Respir Crit Care Med. 2008; 177:995–1001. doi:10.1164/rccm.200708-1151OCPMID:18263800
25. Fodor AA, Klem ER, Gilpin DF, Elborn JS, Boucher RC, Tunney MM, et al. The adult cystic fibrosis air-way microbiota is stable over time and infection type, and highly resilient to antibiotic treatment of exac-erbations. PLOS One. 2012; 7:e45001. doi:10.1371/journal.pone.0045001PMID:23049765
26. Rivas Caldas R, Boisramé S. Upper aero-digestive contamination byPseudomonas aeruginosaand implications in Cystic Fibrosis. J Cyst Fibros. 2015 Jan; 14(1):6–15. doi:10.1016/j.jcf.2014.04.008 PMID:24933711
27. Maeda Y, Elborn JS, Parkins MD, Reihill J, Goldsmith CE, Coulter WA, et al. Population structure and characterization of viridans group streptococci (VGS) includingStreptococcus pneumoniaeisolated from adult patients with cystic fibrosis (CF). J Cyst Fibros. 2011; 10:133–139. doi:10.1016/j.jcf.2010. 11.003PMID:21145793
28. Zhao J, Murray S, Lipuma JJ. Modeling the impact of antibiotic exposure on human microbiota. Sci Rep. 2014. 4:4345. doi:10.1038/srep04345PMID:24614401
29. Price KE, Hampton TH, Gifford AH, Dolben EL, Hogan DA, Morrison HG, et al. Unique microbial com-munities persist in individual cystic fibrosis patients throughout a clinical exacerbation. Microbiome. 20131:27.
30. Goddard AF, Staudinger BJ, Dowd SE, Joshi-Datar A, Wolcott RD, Aitken ML, et al. Direct sampling of cystic fibrosis lungs indicates that DNA-based analyses of upper-airway specimens can misrepresent lung microbiota. Proc Natl Acad Sci. 2012. 109:13769–13774. doi:10.1073/pnas.1107435109PMID: 22872870
31. Rogers GB, Shaw D, Marsh RL, Carroll MP, Serisier DJ, Bruce KD. Respiratory microbiota: addressing clinical questions, informing clinical practice. Thorax. 2015 Jan; 70(1):74–81 doi: 10.1136/thoraxjnl-2014-205826PMID:25035125
32. Van der Gast CJ, Walker AW, Stressmann FA, Rogers GB, Scott P, Daniels TW, et al. Partitioning core and satellite taxa from within cystic fibrosis lung bacterial communities. ISME J. 2011; 5:780–791. doi: 10.1038/ismej.2010.175PMID:21151003
33. Peterson SN, Snesrud E, Liu J, Ong AC, Kilian M, Schork NJ, et al. The dental plaque microbiome in health and disease. PLOS One. 2013; 8:e58487. doi:10.1371/journal.pone.0058487PMID:23520516
34. Van Hoogmoed CG, Geertsema-Doornbusch GI, Teughels W, Quirynen M, Busscher HJ, Van der Mei HC. Reduction of periodontal pathogens adhesion by antagonistic strains. Oral Microbiol Immunol. 2008; 23:43–48. doi:10.1111/j.1399-302X.2007.00388.xPMID:18173797
35. Filkins LM, Hampton TH, Gifford AH, Gross MJ, Hogan DA, Sogin ML, et al. Prevalence of streptococci and increased polymicrobial diversity associated with cystic fibrosis patient stability. J Bacteriol. 2012; 194:4709–4717. doi:10.1128/JB.00566-12PMID:22753064
36. Crabbé A, Ledesma MA, Nickerson CA. Mimicking the host and its microenvironment in vitro for study-ing mucosal infections byPseudomonas aeruginosa. Pathog Dis. 2014; 71:1–19. doi: 10.1111/2049-632X.12180PMID:24737619
37. Lee TWR, Brownlee KG, Conway SP, Denton M, Littlewood JM. Evaluation of a new definition for chronicPseudomonas aeruginosainfection in cystic fibrosis patients. J Cyst Fibros. 2003; 2:29–34. PMID:15463843
38. Anonyme. Recommandations pour l’analyse bactériologique des prélèvements d’expectoration chez les patients atteints de mucoviscidose. In: REMIC, Référentiel en Microbiologie Médicale. Paris: So-ciété Française de Microbiologie; 2010. pp. 90–104.
39. Le Gall F, Le Berre R, Rosec S, Hardy J, Gouriou S, Boisramé-Gastrin S, et al. Proposal of a quantita-tive PCR-based protocol for an optimalPseudomonas aeruginosadetection in patients with cystic fibro-sis. BMC Microbiol. 2013; 13:143. doi:10.1186/1471-2180-13-143PMID:24088260
40. Nossa CW, Oberdorf WE, Yang L, Aas JA, Paster BJ, Desantis TZ, et al. Design of 16S rRNA gene primers for 454 pyrosequencing of the human foregut microbiome. World J Gastroenterol. 2010; 16:4135–4144. PMID:20806429
41. Wheeler DL, Barrett T, Benson DA, Bryant SH, Canese K, Chetvernin V, et al. Database resources of the National Center for Biotechnology Information. Nucleic Acids Res. 2008; 36:D13–21. PMID: 18045790
42. Caporaso JG, Kuczynski J, Stombaugh J, Bittinger K, Bushman FD, Costello EK, et al. QIIME allows analysis of high-throughput community sequencing data. Nat Methods. 2010; 7:335–336. doi:10. 1038/nmeth.f.303PMID:20383131
43. McDonald D, Price MN, Goodrich J, Nawrocki EP, DeSantis TZ, Probst A, et al. An improved Green-genes taxonomy with explicit ranks for ecological and evolutionary analyses of bacteria and archaea. ISME J. 2012; 6:610–618. doi:10.1038/ismej.2011.139PMID:22134646
44. Cole JR, Wang Q, Fish JA, Chai B, McGarrell DM, Sun Y, et al. Ribosomal Database Project: data and tools for high throughput rRNA analysis. Nucleic Acids Res. 2014; 42:D633–642. doi:10.1093/nar/ gkt1244PMID:24288368
45. Yilmaz P, Parfrey LW, Yarza P, Gerken J, Pruesse E, Quast C, et al. (2014) The SILVA and“All-species Living Tree Project (LTP)”taxonomic frameworks. Nucleic Acids Res 42: D643–648. doi:10.1093/nar/ gkt1209PMID:24293649
46. White C. The use of ranks in a test of significance for comparing two treatments. Biometrics. 1952; 8:33–41.