Collinear Mirage Eect Measurement of the
Thermal Diusivity in Ferrouids
A.L.L.Dantas( a)
, D.Walton( b)
andS.M. Shibli( a)
a)Instituto de Fisica, Universidade de S~ao Paulo, Caixa Postal 66318, 05315-970, S~ao Paulo, SP, BRAZIL
b) Physics Dept., McMaster University Hamilton, Ontario, CANADA L8S 4M1
Received29Octob er,1998
Thermal diusivity results obtained for dierent concentrations of the same ferrouid are reported. The collinear mirage technique was used for its adequacy in obtaining the thermal properties of semitransparent materials with low thermal diusivities. The results show that, as the ferrouid concentration increases, the thermal diusivity also increases, leading to a dierent trend compared to those reported for ferronematics. The dierent behaviors observed can be related to the dierent geometries of thermal waves propagating through the material.
PACS numbers: 77.84.Nh, 78.20.Nv
I Introduction
A ferrouid is a colloidal suspension of small ferromag-netic particles dispersed in a carrier solvent. It has the uidity of a homogeneous isotropic liquid and high magnetic susceptibility. These two characteristics make the ferrouid a material of numerous interesting tech-nical applications, such as technological, medical and academic purposes. [1] - [3] Thus, the interest in char-acterizing this material has been intense. Optical [4], magnetic [5] and structural [6] analysis, among others, have been focused in an eort of characterizing the fer-rouid properties. Nevertheless, to our knowledge, no attempt to study the thermal diusivity of ferrouids has been carried out so far.
For obtaining the thermal diusivity of this material we have applied photothermal wave physics. Depending of the thermo-optical properties and of the structure of the analysed material, a dierent technique and theory is indicated. In our case the collinear mirage method is the most adequated one.
The use of the collinear conguration is a reliable photothermal alternative for measuring thermal
diu-sivities of semitransparent materials. [7] This technique was also chosen due to its well known potential of avoid-ing large errors from experimental parameters, and to its high sensitivity to the thermal properties of the sam-ple. Another important advantage, is due to the exis-tence of simple linear relations between two measurable parameters, whose slope can be used to obtain the ther-mal diusivity directly.
The collinear mirage eect is accomplished by the absorption of a modulated exciting beam which heats the medium, generating a refractive index gradient within the sample. A second (probe) laser beam runs, through the sample, collinearly and in a direction oppo-site to that of the pump beam. The probe beam is de-ected by the gradient in the index of refraction due to the thermal gradients generated by the exciting beam. The magnitude of the beam deection, known as mi-rage deection, carries information about the thermal properties of the sample.
In the work reported here we have studied the per-formance of the collinear mirage technique in measur-ing the thermal diusivity of ferrouids (FF's). We have analysed the linearity obtained from measuring
the phase of the collinear mirage deection as a function of the spacing between the exciting and probe beams, for a xed frequency. This model is known as the phase method, [8]-[10] and is indicated for analysing data ob-tained in collinear mirage geometries.
In Section II this model is presented highlighting its validity and limitations for the calculation of the collinear deection, which is measured through the set up shown in Sec.III. The linear relation used to retrieve the thermal diusivity of ferrouids is pointed out and discussed for the analysis of the experimental results, in Sec.IV. Finally, in Sec.V we present the conclusion of this work comparing it to our reported results of the thermal diusivities for an anisotropic complex uid, known as ferronematics, which are lyotropic nematic liquid crystals doped with small amounts of ferrou-ids. This material was measured at the same photother-mal set up presented here and has been also analysed through a linear relation methodology. The dierent results observed for these two materials can be related to the way of propagation of thermal waves through the media.
II Theory
A theoretical 3D model for the calculation of the collinear mirage deection is presented in details elsewhere.[8] From this general theoretical calculation, the authors have found a numerical integration that gives a collinear mirage deection for the probe beam. There are no known analytical solutions for this mea-surable magnitude, so this integral has been numeri-cally calculated. [9] This procedure leads to several dierent linear relations, whose slope give directly the thermal diusivity, being each one indicated for a spe-cic type of material and experimental set up. To
choose the most reliable linear relation, it is necessary to verify the ideal conditions, theoretically and exper-imentally, for the verication of a specic sample and, after that, establish the limits where this linear relation is aected by the experimental parameters, as pump and probe beam sizes.
We have reported that for anisotropic complex u-ids, as ferronematics, these linear relations also apply, but not in a direct way. [11] Here, for this point of view, we have a simpler case, since it is known that ferrouids is an isotropic material, in the absence of a magnetic eld, which is the condition kept throughout this work. So, rstly we know that the material ana-lyzed here is homogeneous and isotropic. Secondly, we assume that the geometrical conguration used extends to an innite medium.
Fig. 1(a) shows the geometry and parameters in-volved in the collinear mirage detection. Both the probe and exciting beams are assumed to be single rays rected collinearly to the sample, but in an opposite di-rection. They are separated by a distance r
0 and
ori-ented relative to the X axis by an angle
0. The radius
of the exciting beam was considered to be zero. [9] The expression for the collinear mirage deection is given by
c( r
0) = , 1 n dn dT Z 1 0 @T @r ! r 0 dz ^ 0 (1)
where n is the refractive index and T is the absolute
temperature.
For the collinear conguration, in the limit of very low absorption we have used a straightforward way of extracting the thermal diusivity,, from the data:
The temperature in an innite medium at a dis-tancerfrom a cylindrical source of radiusr
0is given in
Carslaw and Jaeger. [12]
c
T(r;r 0
;t) = Z
t
0 F(t
0) exp(,
r 2 +r 02 4(t,t 0 ))
4(t,t 0)
I
0[ r r
0
2(t,t 0)]
dt
0 (2)
where I
0 is the modied Bessel function of the rst kind of zero order, and F(t
0) is the time dependence of the
radius a. Thus integrating over the beam we obtain T(r;t) =Z
r
0
e,( r
0
a )
2
dr0 Z
t
0
F(t0)exp( ,
r 2
+r 02
4(t,t 0
))
4(t,t 0) I
0[ rr 0
2(t,t 0)]dt
0 (3)
If F(t0) = Aei! t 0
, where A is a constant that depends on the power of the exciting laser and the optical absorption of the medium, and ! is the modulation angular frequency, it is easy to show that
T(r;t) = Aei! t Z
r
0
e,( r
0
a )
2
dr0I 0(
p
ir0 r
! 2)K0(
p
ir
r
!
2) (4)
where K0 is the modied Bessel function of the second kind of zero order.
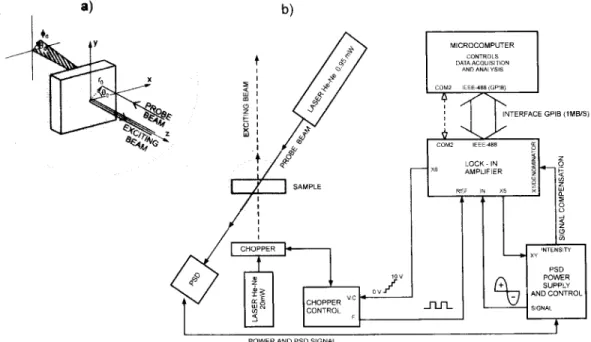
Figure 1. a) Representation of the geometry for the collinear mirage deection
c.The probe beam is separated by a distance r
0 and oriented by an angle
0 from the exciting beam which is located at coordinates (0,0); b) Schema of the experimental
setup used in our collinear mirage technique.
Thus for a given experimental conguration, in which a and r are kept constant,
T(r;t) = Const:[ei! tG( r
!
2)] (5)
where G is some function whose explicit form is not required.
Substituting the above sample temperature expres-sion into Eq.(1), and taking into account the mentioned assumptions, it is possible to obtain c numerically.
There is a linear relation when plotting the phase of the collinear deection [ (c)] as a function of the
sep-aration between the pump and probe beams r0, for a
xed frequency. [9] The slope (m) of this linear relation is given by
m =
r
!
2 (6)
which can be used to calculate the thermal diusivity . This procedure is known as Phase Method. [8, 9]
III Experimental
Ferrouids are composed by magnetic particles, with typical dimensions of about 10nm, dispersed in water. [3] Each particle is coated with a dispersive agent to pre-vent their aggregation. The nanoparticles are magnetic monodomains of magnetite (Fe3O4) purchased from
Ferrouidics Co., with quantities of magnetite, in the solution, of 5.78 g=cm3. Dierent concentrations of
anisotropic when subjected to a magnetic eld. In this study, the samples were not submitted to a magnetic eld, keeping its isotropy. The measurements were per-formed at room temperature (T = 22C).
From the thermal measurements in ferrouids by collinear mirage eect technique we have obtained the mirage signal related to the separation between the pump and probe beams, for a xed frequency. The deection of the probe beam, due to the change in the index of refraction, is detected by a position sensitive detector. The curve obtained from plotting the results of the amplitude of the mirage signal as a function of the beams separation was used for calibrating our set up, and has the same shape of the ones reported for measurements in solids. [8, 9]
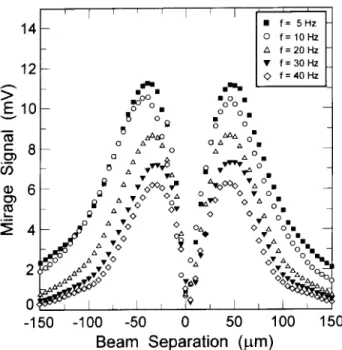
Figure 2. The graph of the mirage signal as a function of the separation between the pump and probe beams, of the variable frequencies (f) for the raw data of the ferrouid sample with the highest ferrouid concentration. The align-ment observed for both peaks at each frequency insures the reliability of the measurements and the calibration of the setup.
A 20 mW He-Ne laser provided the pump beam, while a 0.95 mW laser provided the probe beam. Lenses highly focusing were used for both the pump and probe beams, for more accurate measurements. The pump beam was modulated by a mechanical chopper operat-ing between 4 and 400 Hz. The amplitude and phase of the deected probe beam was provided by a position sensitive detector and a lock-in amplier connected to the computer through a GPIB interface. This set up, which is shown in Fig.1(b), has been validated by means
of experimental measurements on a set of samples with known thermal diusivities.
To determine the reliability of each measurement, rst of all we have measured the mirage signal, which is obtained directly in Volts, from the amplitude values of the lock-in. The signal was then plotted against the beams separation, in micrometers, for each frequency, as seen in Fig. 2.
IV Results and Discussion
Plotting the phase of the collinear deection as a func-tion of the beams separafunc-tion, for a low frequency, linear relations are attainable. A linear least-squares t allows us to get the slope (m) of this linear relation and then, by using Eq. (6), the thermal diusivity. Thus, fol-lowing always this same procedure, we have been able to retrieve the thermal diusivity, for a set of samples with dierent ferrouid concentration.
Fig. 3 shows the experimental data for one sample with ferrouid concentration of 10 % by volume, with frequencies values varying from 5 to 40 Hz. This highest doped sample shows the more reliable data throughout the frequency range. Note that the linearity is more ev-ident for the two lowest frequencies. Taking the linear part of these data and applying the phase method, we have obtained directly the thermal diusivity values for each dierent sample, in every given frequency.
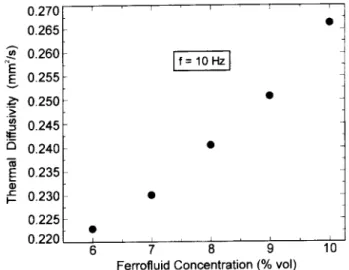
Comparing the ve samples shown in Fig. 4, the thermal diusivity for a given frequency of 10 Hz, which is the more reliable one with errors of about 5 %, we have observed that this thermal parameter decreases with the decrease of the ferrouid concen-tration, leading nearly to the water thermal diusiv-ity. As the ferrouid concentration increases the ther-mal diusivity increases from (0:2230:011)mm
2=s to
(0:2680:013)mm
2=s. The same trend was observed in
Figure 3. The same data as shown in Fig. 2, for the phase data plotted at the linear part of the beam sepa-ration. These data were adjusted until the plotted points coincided with the tting of a linear slope, used to retrieve the thermal diusivity. The symbols refer to the same data as that plotted in Fig. 2.
Then, the inuence of the addition of ferrouid in lyotropic liquid crystals in the nematic phase, to the mi-cellar shape anisotropy and, consequently, to the ther-mal anisotropy, is related only to the molecular ori-entation, and not to the ferrouid addition. Thus, this
study shows that the thermal properties of the ferrouid does not compromise its addition in liquid crystals, dur-ing the studies of the thermal properties of ferronemat-ics, as pointed out in our previous work. [11] Though it highligths the importance in the orientation of the micelles, in liquid crystals, for a more accurate thermal result, which seems to aect directly the propagation of the thermal waves through the material. Further analysis of this matter is on its way.
Figure 4. The data of ve samples with variable ferrouid (FF) concentrations, calculated at frequencies of 10 Hz. From this gure we observe the decrease of the thermal dif-fusivity with the decrease of FF concentration.
Table I. Thermal diusivities parallel and perpendicular to the director and the ratio between them for the three dierent ferronematic samples. The ratio shown in the right column is the calculated value for plain lyotropic nematic liquid crystal. [11]
Ferrouid concentration k
?
k =
?
k =
?
(wt %) (10,3cm2/s) (10,3cm2/s) (measured) (calculated)
0.50 1.55 1.30 1.19
0.75 1.40 1.15 1.22 1.27
1.00 1.40 1.10 1.27
V Conclusion
In conclusion, we have obtained the thermal diusivi-ties of ve samples with dierent ferrouid concentra-tion. The results show that for these ferrouid samples the thermal diusivity values are higher compared to those already reported for ferronematics. The most in-teresting result is the opposite trend observed in each case, where we have obtained that the increase of fer-rouid concentration increases the thermal diusivities in the ferrouid analysis, but it decreases this same parameter for ferronematic materials. Thus, the
VI acknowledgment
Financial support received from the Brazilian agency Fundac~ao de Amparo a Pesquisa do Estado de S~ao Paulo - FAPESP is gratefully acknowledged.
References
[1] R.E. Rosensweig, Ferrohydrodynamics (Cambridge University Press, Cambridge, England, 1985).
[2] Magnetic Fluids and Applications - Handbook, edited by B. Berkovsky and M. Krakov (Begel-House, New York, 1994).
[3] R. Massart, IEEE Trans. Magn. MAG-17, 1247 (1981). [4] M.F. da Silva and A.M. Figueiredo Neto, Phys. Rev. E
48, 4483 (1993); and references therein.
[5] M.C. Cowley and R.E. Rosensweig, J. Fluid Mech.30,
671 (1967).
[6] L.A. do Amaral and F.A.Tourinho, Brazilian J. Phys.
25, 142 (1995); and references therein.
[7] A.C. Boccara, D. Fournier and J. Badoz, Appl. Phys. Lett.36, 130 (1980).
[8] A. Salazar, A. Sanchez-Lavega and J. Fernandez, J. Appl. Phys.74, 1539 (1993).
[9] A. Salazar and A. Sanchez-Lavega, Rev. Sci. Instrum.
65, 2896 (1994).
[10] A. Salazar, A. Sanchez-Lavega, A. Ocariz, J. Guitonny, G.C. Pandey, D. Fournier and A.C. Boccara, J. Appl. Phys.79, 3984 (1996).
[11] S.M. Shibli, A.L.L. Dantas and D. Walton, Appl. Phys. Lett.72, 674 (1998).