AR
TICLE
1 Departamento de Epidemiologia, Faculdade de Saúde Pública, USP. Av. Dr. Arnaldo 715, Cerqueira César. 01246-904 São Paulo SP Brasil. [email protected] 2 Departamento de Medicina Preventiva. Universidade Federal de São Paulo. São Paulo SP Brasil. 3 Departamento de Política, Gestão e Saúde, Faculdade de Saúde Pública, USP. São Paulo SP Brasil.
Medicine poisoning mortality trend by gender and age group, São
Paulo State, Brazil, 1996-2012
Abstract This study looked into mortality due to medicinal drug poisoning by age, gender and in-tent among the population of the state of São Pau-lo. The adjusted time sequence of mortality due to drug poisoning was developed based on data available in the DATASUS Mortality Data Sys-tem for 1996 to 2012. We checked the variables for magnitude and trends. We found an increase in adjusted mortality starting in 2005, and more so as of 2009, confirmed by a 95% CI for the average annual rate of change. (AARC) We did not find the same trend in overall mortality in the state (AARC = -0.22%, 95% CI = -1.12 - 0.69) for spe-cific, external cause mortality (AARC = -3.14%, 95% CI = -4.75 - -1.49) and for mortality due to accidental drug poisoning (AARC=+9,76%, 95% IC = -12.16 – 37.14). The largest increase was found in intentional self-poisoning with me-dicinal drugs (AARC = +10.64%, 95% CI = 6.92 - 14.40), and among the younger subjects (largest magnitude). The trend in mortality due to drug poisoning in the State of São Paulo, the impor-tance of intent and mortality among the younger population reiterate the need to implement con-trol measures.
Key words Mortality, Intoxication, Drugs
Janessa de Fátima Morgado de Oliveira 1
Gabriela Arantes Wagner 2
Nicolina Silvana Romano-Lieber 3
O
li
ve
ir
a JFM
Introduction
Medicinal drugs are essential for healthcare
ser-vices1, and are associated with prophylactic,
cu-rative, palliative and diagnostic purposes2. The
widespread use of medicines fuels the
emer-gency of problems related to them3. Between
1986 and 2006, SINITOX, the National System for Toxic-Pharmacology Information, recorded 1,220,987 cases of poisoning, and 7,597 deaths (0.06%). In 1994, medicinal drugs took over as the leading cause of poisoning among the tox-ic agents investigated, accounting for 24.5% of
all cases recorded in the country2.
Consequent-ly, drug poisoning has become a public health challenge, as is the case in other developed and
emerging nations3,4.
Deaths due to drug poisoning are considered
a public health issue5. Such deaths are primarily
the result of intentional (homicide or suicide)6,7
and accidental (abuse and/or associations, non-medical/recreational use of prescription
drugs) misuse8. Mortality due to drug
poison-ing may be a reflection of the pattern of use of medication, and to social phenomena such as
inequality, poverty and unemployment2. Studies
describing fatal intentional poisoning with drugs may help plan and implement programs to pre-vent such incidents, and also call the attention of healthcare professionals to the importance of the
rational use of drugs9.
Despite the importance of this theme, in Bra-zil there is a dearth of studies on drug poisoning
deaths based on vital statistics2. Published
stud-ies are based on data provided by SINITOX and
state or city toxicology center data (CIAT)3,10,11.
The aim of this study is to provide an assessment of the magnitude and the trend for deaths due to drug poisoning in the state of São Paulo, Brazil between 1996 and 2012, and analyze the differ-ences in mortality by gender, age group and tent, and include a description of the drugs in-volved.
Methods
Study design and population
This is an exploratory, time series ecological study. The state of São Paulo has the second
high-est HDI (Human Development Index) in Brazil12.
Twenty percent of the nation’s population lives in
the state13,14. According to data from the 2008
Na-tional Sample-Based Household Survey - Access
and Use of Services, Health Condition, Risk Factors and Health Protection, 72.7% of the population in the State had been to a doctor in the 12 months prior to the survey interview. This same percentage
is only 67.7% nation-wide15. Data on access to
ser-vices suggests that access is better in the state of Sao Paulo than elsewhere in the country.
Data regarding deaths due to medicinal drug poisoning in the state comes from the SIM/SUS (Unified Healthcare System Mortality Data Sys-tem) for 1996 - 2012. Data were stratified by age group and sex (the word used for gender in the DATASUS database). In this study, we use gen-der, as making this a cross-sectional dimension of healthcare investigation means betting on the possibility that evidence will emerge of inequali-ty between men and women due to gender biases, capable of impacting public policies focused on
reducing such inequalities14.
This study was approved by the University of São Paulo School of Public Health Ethics Com-mittee.
Data Gathering
This time series of death data starts in 1996,
when ICD-10 (10th Review of the International
Classification of Diseases and Health-Related Problems). 2012 is the last year because it is the last year for which SIM had published data at the time of this study. For analysis purposes we selected and stratified deaths due to drug poi-soning, where records show as the basic cause of death the following ICD-10 codes: X40-X44 (accidental poisoning); X60-X64 (intentional self-poisoning - suicide); X85 (aggression using drugs, medicines or other biological substances);
Y10-Y14 (poisoning due to unknown cause)16.
Data analysis
Mortality coefficients were calculated using official population data for the state of São Paulo, taken from data published by the IBGE
Funda-tion13. This data is estimated each year based on
general population censuses. Annual mortality coefficients are calculated per 1,000,000 inhabi-tants for each year. Population data in the state is
stratified by age as follows: ≤5 years, 5 - 9 years,
10 - 14 years, 15 - 19 years, 20 - 29 years, 30 - 39 years, 40 - 49 years, 50 - 59 years, 60 - 69 years,
≥70 years.
Data on the global population was researched to adjust mortality coefficients due to drug
aúd e C ole tiv a, 22(10):3381-3391, 2017
age. We designed a time series running from 1996 through 2012, based on estimates of the adjusted
coefficients for mortality due to drug poisoning18.
Non-adjusted annual coefficients for mortality due to accidental drug poisoning (X40-X44), in-tentional self-poisoning / suicide (X60-X64) and undetermined intent (Y10-Y14) were estimated to provide a subsidy for the analysis of intent to poison. We analyzed trends over the period, dif-ferences by gender and the contribution of each intent to mortality.
Annual coefficients of mortality due to drug poisoning were also estimated by age group. The trend in each age group was analyzed over the study period, bearing in mind also differences in distribution by gender. The magnitude of mor-tality by age group and gender was also assessed. We looked at data on total deaths and deaths due to external causes in the state of São Paulo over the study period, and used this data to esti-mate mortality coefficients.
We calculated the average annual rate of change (AARC) to check trends for all of the
mortality coefficients estimated19.
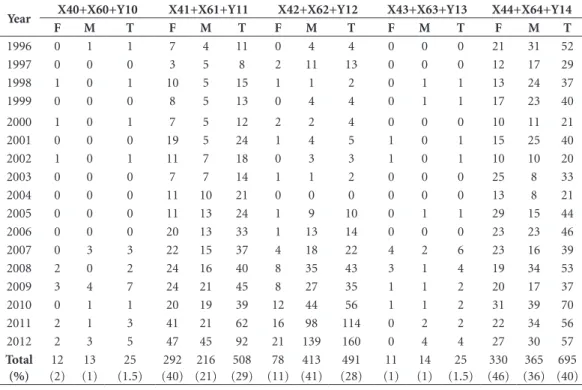
Data on deaths due to drug poisoning was stratified to subsidize the analysis of the drugs involved in the deaths. Stratification followed the following criteria: X40, X60 and Y10 correspond to deaths due to analgesic, antipyretic, antirheu-matic (non-opioid) drug poisoning X41, X61 and Y11 correspond to deaths due to anticon-vulsive, sedative, hypnotic, anti-Parkinson and psychotropic drug poisoning; X42, X62 and Y12 correspond to deaths due to narcotic and psy-chodysleptic drug poisoning; X43, X63 and Y13 correspond to deaths due to poisoning by auton-omous central nervous system drugs; X44, X64 and Y14 correspond to deaths due to unspecified drug poisoning.
We used Excel®2013 to calculate mortal-ity coefficients, adjustments to mortalmortal-ity due to drug poisoning, AARC and the frequency at which drug groups are involved in deaths. To analyze trends, we used Stata10.0 (Stata Corpo-ration, College Station, Texas, 2007) to calculate the 95% Confidence Intervals (95% CI) for the AARC.
Results
Between 1996 and 2012, 4,170,358 deaths were recorded in the state of São Paulo. Of these, 0.04% were due to drug poisoning (1,760 cas-es). External causes accounted for 491,040 of the
deaths, 0.4% of which were due to drug poison-ing. Of these, 58.8% were males. In 0.3% of the cases age was not reported, all of them male.
Figure 1 shows adjusted data for death due to drug poisoning for the State of São Paulo be-tween 1996 and 2012. Mortality rates were sta-ble through 2004, but started to go up in 2005. The largest growth was in 2009. An analysis of the 95% CI for the average annual rate of change (AARC) in adjusted mortality due to drug poi-soning shows a growing trend (AARC = +8.2% with a 95% CI of 0.6 - 16.4).
Table 1 shows the variation in all-cause mor-tality and specific mormor-tality from external causes in the state of São Paulo between 1997 and 2012. Analysis of the AARC and 95% CI suggest that all-cause mortality remained stationary over the study period (AARC = -0.22%, 95% CI = -1.12 - 0.69), while external cause mortality declined (AARC = -3.14%, 95% CI = -4.75 - -1.49). This means that the trend mortality due to drug poi-soning is different from that found for overall mortality (growing vs. constant), and from mor-tality due to external causes (decreasing) in this period.
Table 2 shows the AARC and 95% CI for mortality due to accidental, intentional and un-determined drug poisoning in the State of São Paulo over the study period. Although the AARC suggests an increase in mortality due to acci-dental drug poisoning in both genders and the entire study population, the confidence intervals 995% IC calculated for the AARC suggest that the trend in mortality due to accidental drug poi-soning over the period is actually stable (AARC = 9.76%, 95% CI = -12.16 - 37.14). We found high-er rates of accidental mortality among males in each year of the study period (Table 2). Most of the deaths due to drug poisoning among males were classified as accidental and involved the use of narcotics and psychodysleptics (ICD-10 X42), corresponding to 27.7% of all of the deaths we investigated in this gender.
O
li
ve
ir
a JFM
These amounted to 28.9% of the deaths we inves-tigated for this gender.
The AARC for all mortality due to drug poi-soning of undetermined cause in the State of São Paulo grew among both genders over this peri-od, slightly more among females than males. The 95% CI confirmed this upwards trend. Mortality due to drug poisoning of undetermined intent was higher among males in all years except 1997, 2002, 2003, 2004, 2005, 2007 and 2008.
If we consider total variation by intent (Table 2), we find that intentional drug poisoning (sui-cide) grew faster than other types over the study period (+10.64%).
Figure 2 shows mortality due to drug poison-ing rates by age group. We see an increase in mor-tality among adolescents (15-19) and adults (20-40) starting in 2009. The largest increases were found among adolescents (15-19) and young adults (20-29), followed by adults (30-40) and the elderly (over 70).
Stratification of cases in terms of the drugs involved in these deaths shows a gender differ-ence (Table 3). Among males, narcotics and psy-chodysleptics accounted for 40.5% of the deaths due to drug poisoning (ICD-10X42, X62 and Y12), while the use of unspecified drugs
account-ed for 35.7% of the cases (ICD-10 X44. X64 and Y14). Among females, 45.6% of the deaths due to drug poisoning were unspecified in terms of the drugs involved (ICD-10 X44, X64 and Y14). In 40.4% of the cases, the drugs involved were anti-convulsants, sedatives, hypnotics, anti-Parkinson and psychotropics (ICD-10 X44, X64 and Y14).
Discussion
Estimates of mortality based on secondary death data showed an increasing trend in adjusted mor-tality due to drug poisoning in the state of São Paulo, starting in 2005. This is different from the trend in all-cause mortality and external cause mortality. These findings agree with a study us-ing the same data source to describe mortality due to drug poisoning in Brazil between 1996
and 20052. The authors found a 17.8% rate of
crease in drug poisoning mortality, and 8.7%
in-crease in all-cause mortality15. However,
compar-ing this data to those of the present study must be made with reservations, as the method used by those authors to calculate AARC is different from the one used in the present study, as is the popu-lation (all of Brazil) and the period (1996 - 2005).
Figure 1. Death due to medicinal drug poisoning in the state of São Paulo (1992-2012): adjusted mortality coefficients (annually per 1,000,000 inhabitants).
Source: Mortality Information System and AHMAD et al. (2001) - world population.
Note: The average annual rate of change (AARC) in adjusted mortality due to drug poisoning was +8.2%, with a 95% CI of 0.6 - 16.4, suggesting it is on the rise.
1996 1997 1998 1999 2000 2001 2002 2003 2004 2005 2006 2007 2008 2009 2010 2011 2012 8
7 6 5 4 3 2 1 0
2,0
1,4 1,6 1,5 1
1,8
1,1 1,3 1
1,9 2,1 2,3
3 2,7
3,6 5,1
aúd e C ole tiv a, 22(10):3381-3391, 2017
According to DATASUS, in 2011 the content of Death Statements (DS) changed to include more detail. The SIM CGIAE, the Agency that Coordinates Epidemiological Data and Analyses, points out that the more detailed forms led to a drop in poorly defined cause of death or death due to undetermined intent. This, in turn, led to an increase in other causes of death; the decrease in deaths due to undetermined intent resulted in an increase in the number of cases considered accidental or intentional. It is important to note that DS forms changed in 2011, and that both forms were used simultaneously for that entire year. The new form could partly explain the in-crease in mortality due to drug poisoning as of 2011. However, according to the SIM CGIAE, the state of São Paulo used the new form in only 58% of the deaths in 2011, a percentage the
coordina-tors consider to be small20. We also found that the
trend in mortality due to drug poisoning differs from the trend for all-cause mortality and specif-ic mortality for external causes, reinforcing the hypothesis of growth in adjusted mortality due
to drug poisoning in the state of São Paulo over the study period.
ICD-10 categories X42, X62 and Y12 codify circumstances involving the use of hallucinogen-ics in general, and is not restricted to medicinal products. This results in inaccuracy regarding the number of drug poisonings, which may actually be smaller, and inaccurate numbers for medici-nal drug poisonings, which could be smaller. This should be taken into account, especially when considering deaths due to drug poisoning among males, where these codes were more significant.
On the other hand, data on drug poisoning refers primarily to situations where exposure and outcome come close together in time (acute poi-soning). Therefore, these estimates may be low by not including cases of continued drug use. Even cases of acute poisoning may occur without a di-agnosis of poisoning as the cause of death, as of-ten the poisoning is unclear, there is no confirmed diagnosis and patients receive only symptomatic
treatment21. Many drugs and poisons produce no
characteristic pathology, and the symptoms of
poisoning or overdose are often non-specific22.
For this reason, deaths due to poisoning could be mistakenly assigned to other causes.
This incidence refers to the speed at which new events happen within a given population, bearing in mind the time during which individ-uals are free of the problem or, in other words, at
risk of developing it23. Therefore, for calculating
the incidence of a problem we use the number of new cases over a certain period of time with-in a specific population at risk of developwith-ing the problem. Considering this definition, mortality due to drug poisoning does not correspond to the incidence of poisoning, as we do not know the number of people exposed to drugs (at risk of poisoning), necessary for the correct calcula-tion. We used the total population instead, which shows that an estimate of incidence, had it been possible, would have resulted in higher values for these coefficients than those found. Other studies
on the theme also used the total population2.
We found differences in the drugs responsi-ble for the death of males and females. We point out the importance of studies showing the differ-ence in health profiles between men and women, aiming to find possible variations in gender-re-lated perceptions and practices in understanding
health-disease processes24.
The results show that suicides are relevant among the deaths selected for this study. We found that deaths due intentional drug poison-ing were the largest contributors to the increase
Table 1. Overall and specific external cause mortality. State of São Paulo, 1997 - 2012.
Year Overall mortality (per 1,000 inhabitants) Specific external cause mortality (per 10,000 inhabitants)
1997 6.7 9.4
1998 6.6 9.1
1999 6.6 9.5
2000 6.6 9.3
2001 6.3 9.0
2002 6.2 8.6
2003 6.2 8.1
2004 6.1 7.4
2005 5.8 6.8
2006 5.9 6.1
2007 6.1 5.8
2008 6.1 5.8
2009 6.2 5.8
2010 6.4 5.9
2011 6.5 5.8
2012 6.5 6.0
AARC (95% CI)
-0.22% (-1.12 – 0.69)
-3.14% (-4.75 – -1.49)
O
li
ve
ir
a JFM
in mortality during the study period. However, we should point out that the coefficients of mor-tality due to drug poisoning of undetermined in-tent were also significant and growing.
The availability of information that is based on solid and reliable data is key for objective analysis of the health situation of any location, and for making evidence-based decisions and
program healthcare actions25. The category of
undetermined events in the data on mortality was classified as such whenever the intent was unknown (accidental or intentional). It is im-portant to realize that knowing the actual cause could increase the number of suicides and
acci-dental deaths26.
Suicide is a legal term, not a diagnosis27.
Le-gal and religious issues involved in intentional poisoning could favor their classification as an-other intent. Furthermore, a study conducted
in England between 1990 and 2005 shows that there are time trends in the verdicts of examin-ers regarding possible suicides, influenced by an increase in the rulings of accidental or undefined
death, especially in cases involving poisoning28.
Another study found that most of the deaths as-signed to substance disorders are considered
ac-cidental29. These facts point to the possibility that
some of the deaths classified as accidental were not, in fact, accidental, resulting in under-re-porting and under-estimating the magnitude of mortality due to intentional self-poisoning with drugs.
Higher mortality coefficients were found among adolescents and young adults. Suicide is one of the three leading causes of death among
the economically more productive population30.
One study found that the population groups most susceptible to suicide in Brazil are young
Table 2. Death due to medicinal drug poisoning by intent (accidental, suicide and undetermined). State of São Paulo, 1996 - 2012.
Year
Mortality due to accidental drug poisoning (per 1,000,000 inhabitants/
year)
Death due to intentional drug self-poisoning (suicide) (per 1,000,000 inhabitants/
year)
Death due to drug poisoning by intent (accidental, suicide
and undertermined). (per 1,000,000 inhabitants/
year)
F M Total F M Total F M Total
1996 0.64 1.01 0.82 0.81 0.71 0.76 0.17 0.65 0.41 1997 0.45 1.23 0.83 0.34 0.58 0.46 0.17 0.12 0.14 1998 0.39 0.81 0.60 0.73 0.58 0.65 0.28 0.40 0.34 1999 0.44 0.79 0.61 0.66 0.62 0.64 0.28 0.45 0.36 2000 0.05 0.11 0.08 0.79 0.39 0.59 0.21 0.50 0.35 2001 0.10 0.43 0.27 1.20 0.76 0.98 0.57 0.65 0.61 2002 0.05 0.16 0.10 0.72 0.53 0.63 0.41 0.37 0.39 2003 0.00 0.05 0.03 0.91 0.53 0.72 0.76 0.26 0.52 2004 0.00 0.00 0.00 0.70 0.52 0.61 0.50 0.42 0.46 2005 0.10 0.25 0.17 0.82 0.86 0.84 1.07 0.81 0.94 2006 0.19 0.70 0.44 1.58 1.14 1.36 0.33 0.60 0.46 2007 0.19 0.49 0.34 1.50 1.48 1.49 0.80 0.69 0.74 2008 0.48 1.20 0.83 1.57 2.50 2.02 0.62 0.60 0.61 2009 0.28 1.04 0.65 1.74 1.79 1.76 0.61 0.65 0.63 2010 0.47 2.09 1.26 2.03 1.99 2.01 0.52 1.10 0.80 2011 0.75 3.80 2.24 2.20 2.57 2.38 0.84 1.33 1.08 2012 0.98 6.38 3.60 2.79 3.14 2.96 0.74 1.32 1.03
AARC (95% CI) +3.84% (-12.25 – 22.88) +11.87% (-11.05 – 40.71) +9.76% (-12.16 – 37.14) +10.11% (7.52 – 12.77) +11.35% (5.32 – 17.72) +10.64% (6.92 – 14.49) +9.15% (5.45 – 12.97) +8.76% (4.56 – 13.13) +8.84% (6.72 – 11.00)
Sources of data for calculations: DATASUS and IBGE.
Note: The AARC is positive for mortality due to accidental, intentional and undetermined drug poisoning, however the 95% CI suggests an upwards trend for intentional and undetermined mortality due to drug poisoning (values higher than zero), and stable for accidental mortality (zero is part of the interval).
aúd
e C
ole
tiv
a,
22(10):3381-3391,
2017
people living in large cities, the native Indians of the middle-west and north, and rural workers
in the interior of Rio Grande do Sul31. Different
results have been found in other contexts.
Ac-cording to a study conducted in Brazil32,
small-er cities and native Indian communities show a standardized death by suicide rate that is higher than larger cities. Higher suicide rates in smaller
cities have also been found in Finland33. One of
the hypotheses raised is that the differences in mortality due to suicide may reflect the aggre-gate risk of a concentration of people at higher risk (composition effect0, and/or the influence of economic, social and cultural aspects on mental
health (context effect)32. The numbers for Brazil
should, therefore, be analyzed with caution, as the number of suicides may be
under-report-ed31,34 and rates vary by region31.
Figure 2. Mortality due to medicinal drug poisoning: mortality coefficients by age group (annual per 1,000,000 inhabitants). State of São Paulo, 1996 - 2012.
O
li
ve
ir
a JFM
The high frequency of deaths among both genders, where the drug involved is unknown (X44, X64 and Y14), reported in this study points to a lack of suitable description of the agents in-volved in the death. Furthermore, the other cate-gories of the ICD-10 do not allow looking at any-thing other than the group of drugs described. Among females, the most important drugs for the deaths in this study were anti-convulsants, sedatives, hypnotics, anti-Parkinson drugs and psychotropics (ICD-10 X41, X61 and Y11), but there is no way to get a more stratified view of the importance of each type of drug. Using the ICD to classify ATC, often used in studies on drug use, favors the suitable description of the drug in-volved in these cases.
Statistics on mortality have been, and still are an important source of data to understand the epidemiological profile of a given area, analyze trends, indicate priorities and assess programs, among other purposes, helping develop
indica-tors and plan healthcare actions35. Educational
and regulatory measures should be implement-ed for continuimplement-ed awareness of healthcare pro-fessionals, thus ensuring that the data generated is complete and of as good a quality as possible, and that they are committed to following their patients and correctly using drugs, providing suitable prescriptions and combining drug and non-drug based therapies. Such measures would contribute to improving the impact of drugs on healthcare and notification of poisoning as an important health issue.
Table 3. Deaths grouped by ICD-10 code, number and frequency State of São Paulo, 1996 - 2012.
Year X40+X60+Y10 X41+X61+Y11 X42+X62+Y12 X43+X63+Y13 X44+X64+Y14
F M T F M T F M T F M T F M T
1996 0 1 1 7 4 11 0 4 4 0 0 0 21 31 52
1997 0 0 0 3 5 8 2 11 13 0 0 0 12 17 29
1998 1 0 1 10 5 15 1 1 2 0 1 1 13 24 37
1999 0 0 0 8 5 13 0 4 4 0 1 1 17 23 40
2000 1 0 1 7 5 12 2 2 4 0 0 0 10 11 21
2001 0 0 0 19 5 24 1 4 5 1 0 1 15 25 40
2002 1 0 1 11 7 18 0 3 3 1 0 1 10 10 20
2003 0 0 0 7 7 14 1 1 2 0 0 0 25 8 33
2004 0 0 0 11 10 21 0 0 0 0 0 0 13 8 21
2005 0 0 0 11 13 24 1 9 10 0 1 1 29 15 44
2006 0 0 0 20 13 33 1 13 14 0 0 0 23 23 46
2007 0 3 3 22 15 37 4 18 22 4 2 6 23 16 39
2008 2 0 2 24 16 40 8 35 43 3 1 4 19 34 53
2009 3 4 7 24 21 45 8 27 35 1 1 2 20 17 37
2010 0 1 1 20 19 39 12 44 56 1 1 2 31 39 70
2011 2 1 3 41 21 62 16 98 114 0 2 2 22 34 56
2012 2 3 5 47 45 92 21 139 160 0 4 4 27 30 57
Total (%)
12 (2)
13 (1)
25 (1.5)
292 (40)
216 (21)
508 (29)
78 (11)
413 (41)
491 (28)
11 (1)
14 (1)
25 (1.5)
330 (46)
365 (36)
695 (40)
aúd
e C
ole
tiv
a,
22(10):3381-3391,
2017
Collaborations
JMF Oliveira designed and planned the study, gathered data, ran calculations and designed fig-ures and tables, analyzed and interpreted the data and drafted the final version. GA Wagner and NS Romano-Lieber planned the study, contribut-ed to a critical review of the content and helpcontribut-ed approve the final version of the manuscript. JLF Antunes planned the study, ran calculations and data analysis, contributed to a critical review of the content, and helped approve the final version of the manuscript.
Acknowledgements
CAPES for funding the Ph.D. whose dissertation was a source for this article
O li ve ir a JFM References
1. Silvério MS, Leite ICG. Qualidade das prescrições em município de Minas Gerais: uma abordagem farmaco-epidemiológica. Rev Assoc Med Bras 2010; 56(6):675-680.
2. Mota DM, Melo JRR, Freitas DRC, Machado M. Perfil de mortalidade por intoxicação com medicamentos no Brasil, 1996-2005: retrato de uma década. Cien Saude Colet 2012; 17(1):61-70.
3. Bertasso-Borges MS, Rigetto JG, Furini AAC, Gonçalves RR. Eventos toxicológicos relacionados a medicamen-tos registrados no CEATOX de São José do Rio Preto, no ano de 2008. Arq Ciênc Saúde 2010; 17(1):35-41. 4. Teles AS, Oliveira RFA, Coelho TCB, Ribeiro GV,
Men-des WML, Santos PNP. Papel dos medicamentos nas intoxicações causadas por agentes químicos em muni-cípio da Bahia, no período de 2007 a 2010. Rev Ciênc Farm Básica Apl 2013; 34(2):281-288.
5. World Health Organization (WHO). Violence, injuries and disability: biennial report 2008–2009. WHO Li-brary Cataloguing-in-Publication Data. Genebra, 2010. [acessado 2017 maio 17]. Disponível em: http://wh-qlibdoc.who.int/publications/2010/9789241599474_ eng.pdf
6. Cheatle MD. Depression, chronic pain and sui-cide by overdose: on the edge. Pain Medicine 2011; 12(Supl.):S43-S48.
7. Coklo M, Stemberga V, Cuculic D, Sosa I, Bosnar A. Toxicology and methods of commiting suicide other than overdose. Medical Hypotheses 2009; 73(5):809-810.
8. Cheatle MD, Savage SR. Informed consent in opioid therapy: a potential obligation and opportunity. J Pain Symptom Management 2012; 44(1):105-116.
9. Margonato FB, Thomson Z, Paoliello MMB. Acute in-tentional and accidental poisoning with medications in a Southern Brazilian city. Cad Saude Publica 2009; 25(4):849-856.
10. Bortoleto ME, Bochner R. Impacto dos medicamentos nas intoxicações humanas no Brasil. Cad Saude Publica 1999; 15(4):859-869.
11. Gandolfi E, Andrade MGG. Eventos toxicológicos rela-cionados a medicamentos no Estado de São Paulo. Rev Saude Publica 2006; 40(6):1056-1064.
12. Programa das Nações Unidas para o Desenvolvimento (PNUD). Ranking IDHM Unidades da Federação 2010. Atlas do Desenvolvimento Humano no Brasil. Brasil, 2013. [acessado 2017 maio 17]. Disponível em: http:// www.pnud.org.br/atlas/ranking/Ranking-IDHM -UF-2010.aspx
13. Instituto Brasileiro de Geografia e Estatística (IBGE). Sinopse do Senso Demográfico 2010. [acessado 2017 maio 17]. Disponível em: http://biblioteca.ibge.gov.br/ visualizacao/livros/liv49230.pdf
14. Fundação Sistema Estadual de Análise de Dados (SEA-DE). População estimada para o Estado de São Paulo 2013. [acessado 2017 maio 17]. Disponível em: http:// www.seade.sp.gov.br/index.php?option=com_conten-t&view=article&id=1070&Itemid=54
15. Pesquisa Nacional por Amostra de Domicílios (PNAD). Acesso e Utilização de Serviços, Condições de Saúde e Fa-tores de Risco e Proteção à Saúde 2008. [acessado 2017 maio 17]. Disponível em: http://www.ibge.gov.br/es-tadosat/temas.php?sigla=sp&tema=pnad_saude_2008 16. World Health Organization (WHO). International
Statistical Classification of Diseases and Related Health Problems. 10th Revision. Genebra: WHO; 2011. Volume 2: Instruction Manual.
17. Laurenti R, Mello-Jorge MHP, Lebrão ML, Gotlieb SLD. Estatísticas de Saúde. São Paulo: EPU; 1987. 18. Ahmad OB, Boschi-pinto C, Lopez AD. Age
Standard-ization of Rates: a New Who Standard. GPE Discuss-Pap Ser No31; EIP/GPE/EBD. World Heal Organ 2001; (31):1-14.
19. Antunes JLF, Cardoso MRA. Uso da análise de séries temporais em estudos epidemiológicos. Epidemiol Serv Saúde 2015; 24(3):565-576.
20. Brasil. Ministério da Saúde (MS). DATASUS. Sistema de Informações sobre Mortalidade – SIM. Consolidação da Base de Dados de 2011. 2013. [acessado 2017 maio 17]. Disponível em: http://tabnet.datasus.gov.br/cgi/ sim/Consolida_Sim_2011.pdf
21. Amaral DA, Barcia SAD. Intoxicações por medicamen-tos. In: Oga S, organizador. Fundamentos de toxicologia. 2ª ed. São Paulo: Editora Varella; 2003. p. 367-379. 22. Klaassen CD, Watkins III JB. Toxicologia, A Ciência
Bá-sica dos Tóxicos de Cassarett e Doull. 5ª ed. Alfragide: McGraw-Hill de Portugal; 2001.
23. Bonita R, Beaglehole R, Kjellström T. Epidemiologia básica. 2ª ed. São Paulo: Ed. Santos; 2010.
24. Villela W, Monteiro S, Vargas E. A incorporação de no-vos temas e saberes nos estudos em saúde coletiva: o caso do uso da categoria gênero. Cien Saude Colet 2009; 14(4):997-1006.
25. Rede Interagencial de Informações Para a Saúde (RIP-SA). Indicadores básicos para a saúde no Brasil. Brasília: OPAS; 2002.
26. Gawryszewski VP, Mello-Jorge MHP, Koizumi MS. Mortes e internações por causas externas entre idosos no brasil: o desafio de integrar a saúde coletiva e aten-ção individual. Rev Assoc Med Bras 2004; 50(1):97-103. 27. Rajkumar AP, Brinda EM, Duba AS, Thangadurai P,
aúd
e C
ole
tiv
a,
22(10):3381-3391,
2017
28. Gunnell D, Bennewith O, Simkin S, Cooper J, Klineberg E, Rodway C, Sutton L, Steeg S, Wells C, Hawton K, Ka-pur N. Time trends in coroners’ use of different verdicts for possible suicides and their impacto n officially re-ported incidence of suicide in England: 1990 – 2005. Psychol Med 2013; 43(7):1415-1422.
29. Bjornaas MA, Teige B, Hovda KE, Ekeberg O, Heyer-dahl F, Jacobsen D. Fatal poisoning in Oslo: a one-year observacional study. BMC Emergency Medicine. 2010; 10(13):1-11.
30. World Health Organization (WHO). Public health ac-tion for the prevenac-tion of suicide – a framework. WHO Li-brary Cataloguing-in-Publication Data. Genebra, 2012. [acessado 2017 maio 17]. Disponível em: http://apps. who.int/iris/bitstream/10665/ 75166/1/9789241503570 _eng.pdf
31. Botega NJ. Suicídio: saindo da sombra em direção a um Plano Nacional de Prevenção. Rev Bras Psiquiatr 2007; 29(1):7-8.
32. Marín-León L, Oliveira HB, Botega NJ. Suicide in Bra-zil, 2004-2010: the importance of small counties. Rev Panam Salud Publica 2012; 32(5):351-359.
33. Nayha S. Suicide mortality in Finnish Lapland by small areas, with reference to temporal trends. Int J Circum-polar Health 2009; 68(3):224-234.
34. World Health Organization (WHO). Preventing sui-cide – a global imperative. WHO Library Catalogu-ing-in- Publication Data. Genebra, 2014. Last updated: 2011-03-25. [acessado 2017 maio 17]. Disponível em: http://www.who.int/mental_health/suicide-preven-tion/exe_summary_english.pdf
35. Laurenti R, Mello Jorge MHP, Gotlieb SLD. A confia-bilidade dos dados de mortalidade e morbidade por doenças crônicas não-transmissíveis. Cien Saude Colet 2004; 9(4):909-920.
Article submitted 23/05/2017 Approved 26/06/2017