ISSN 0104-6632 Printed in Brazil
www.abeq.org.br/bjche
Vol. 23, No. 03, pp. 365 - 374, July - September, 2006
Brazilian Journal
of Chemical
Engineering
LIQUID - LIQUID EQUILIBRIA OF
THE WATER + BUTYRIC ACID + DECANOL
TERNARY SYSTEM
Ş
.
İ
. K
ı
rba
ş
lar
School of Engineering, Chemical Engineering Department, Istanbul University, 34320 Avcilar - Istanbul, Turkey
E-mail: [email protected].
(Received: April 3, 2004 ; Accepted: March 7, 2006)
Abstract - Liquid-liquid equilibrium (LLE) data for the water + butyric acid + decanol ternary system were
determined experimentally at temperatures of 298.15, 308.15 and 318.15 K. Complete phase diagrams were obtained by determining the solubility curve and the tie lines. The reliability of the experimental tie line data was confirmed with the Othmer-Tobias correlation. The UNIFAC method was used to predict the phase equilibrium of the system using the interaction parameters for groups CH3, CH2, COOH, OH and H2O
determined experimentally. Distribution coefficients and separation factors were evaluated for the immiscibility region.
Keywords: Liquid-liquid equilibria; Butyric acid, Decanol; UNIFAC method.
INTRODUCTION
Interest in, solvent and reactive extraction techniques is currently growing. This results from their possible applications not only in the chemical industry, but also in the biotechnological production of some substances. Production of organic acids such as acetic, citric, lactic, propionic and butyric acids can be given as an example. Extraction can be employed not an only in downstream separation but also in combination with fermentation (Wardell and King, 1978; Hegazi, 1984; Fahim et al., 1992; Arce et al., 1995; Fahim and Al-Muhtaseb, 1996; Fahim et al., 1997; Sólimo et al., 1997; Colombo et al., 1999; Aljimaz et al., 2000; Taghikhani et al., 2001; Trevor et al., 2001; İnce and Kırbaşlar, 2002; İnce, 2005).
Butyric acid and some of its esters are used in the food and perfumes industries because of their aromatic properties. Butyric acid is also used in the
pharmaceutical industry. Many processes have already been proposed for butyrate production by fermentation (Zigová and Šturdik, 2000). Nevertheless, fermentation processes have not yet been used commercially because of low product mass concentrations in the fermentation broth (20-30 g / L) and also because of the acetate that is produced simultaneously with butyrate. Presently, butyric acid is mostly produced synthetic from petrochemicals. However, the use of butyric acid or its esters as additives, in particular in the food or cosmetic industries, makes its origin important since consumers prefer natural products (Zigová et al., 1999; Zigová and Šturdik, 2000). A detailed evaluation of solvents for the extraction of butyric acid is not available in the literature (except in Zigová et al., 1996). They screened 14 solvents for the extraction of butyric acid and a tertiary amine in different diluents.
correct description of the dependence on temperature, pressure and composition in multi-component systems requires reliable thermodynamic models. The UNIFAC model was developed by Fredenslund et al. (1975). A special UNIFAC version for the prediction of liquid-liquid equilibria was published by Magnussen et al. (1981). The UNIFAC model for the estimation of activity coefficients is based on the concept that a liquid mixture may be considered a solution of structural units from which the molecules are formed, rather than a solution of the molecules themselves. It has the advantage of being able to form a very large number of molecules from a relatively small set of structural units. The structural units in the calculation method are called subgroups. The mole fractions, XEi and XRi, of
LLE phases can be calculated using the following equation: R i R i E i E
i X =γ X
γ (1)
This study is part of a research program on the recovery of butyric acid from dilute aqueous solutions using solvents with high boiling points. In
this paper, we report LLE results for the water + butyric acid + decanol ternary systems for which no such data were available.
EXPERIMENTAL
Materials
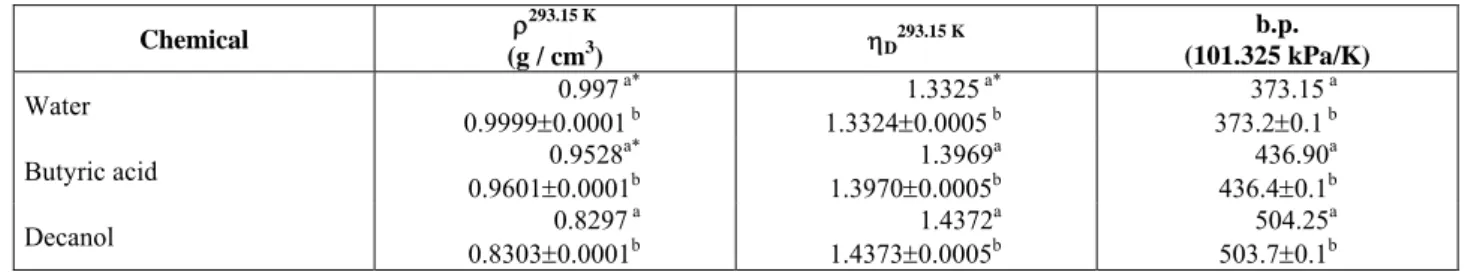
Butyric acid and decanol were purchased from Merck and were of > 99 % (w/w) and 99 % (w/w) purities, respectively. Butyric acid and decanol were used without further purification. GC analysis did not detect any appreciable peaks of impurities. Deionised water was further distilled before use. Refractive indexes were measured with an Abbé-Hilger refractometer; its stated accuracy is ± 5x10⁻⁴. Densities were measured with an Anton Paar densimeter (Model 4500). Boiling point measurements were obtained with a Fischer boiling point apparatus. The estimated uncertainties in the density and boiling point measurements were ± 10-5 g / cm3 and ± 0.1 K, respectively. The measured physical properties are listed in Table 1, along with values from the literature (Lide, 2002).
Table 1: Physical properties of the chemicals used in the experiments.
Chemical ρ
293.15 K
(g / cm3) ηD
293.15 K b.p.
(101.325 kPa/K)
Water 0.997
a*
0.9999±0.0001 b
1.3325 a*
1.3324±0.0005 b
373.15 a
373.2±0.1 b
Butyric acid 0.9528
a*
0.9601±0.0001b
1.3969a 1.3970±0.0005b
436.90a 436.4±0.1b
Decanol 0.8297
a
0.8303±0.0001b
1.4372a 1.4373±0.0005b
504.25a 503.7±0.1b
a literature (Lide, 2002) b
this work
* at 298.15 K
Procedure
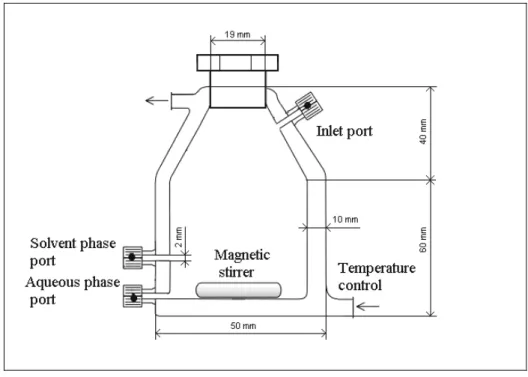
Three different temperatures (298.15, 308.15 and 318.15 K) were selected to study the ternary equilibrium system in order to observe the evaluation of the binodal curves and tie lines. At each temperature, individual solubility curves were determined by the cloud-point method in the magnetically stirred equilibrium cell. The equilibrium cell is given in Figure 1. The end point was determined by observing the transition from a homogenous to a heterogeneous solution.
method. A weighed amount of one component was placed in the cell; then the other component was added until a permanent heterogeneity had been observed.
was measured with an electronically controlled thermostat with an accuracy of ± 0.1 K. All mixtures were prepared by weighing with a Mettler scale accurate to ± 10-4 g. The solvent was added with an automated microburet (Methrom) with an accuracy of 5x10⁻³ cm3.
Analysis
The liquid samples were analysed with a Gas Chromatograph (Hewlett Packard GC, Model 6890 Series), equipped with a thermal conductivity detector (TCD) for the quantitative determination of
water, butyric acid and decanol. A 15-m long HP-Plot Q column (0.320 mm i.d., 0.2 μm film thickness) was used for a temperature-programmed analysis. Column temperature was increased from 383 K (5 min) to 451 K at 10 K/min and to 523 K (2 min) at 25 K / min. A split ratio of 100:1 was used for injection. The detector was a TCD. The injector temperature was 523 K and the detector temperature was 473 K. The flow rate of the carrier gas, nitrogen, was kept at 6 cm3 / min and the injected volume of liquid sample was 1 μL. Samples with known compositions were used to calibrate the instrument in the composition range of interest.
Figure 1: Liquid-liquid equilibrium cell.
RESULTS AND DISCUSSION
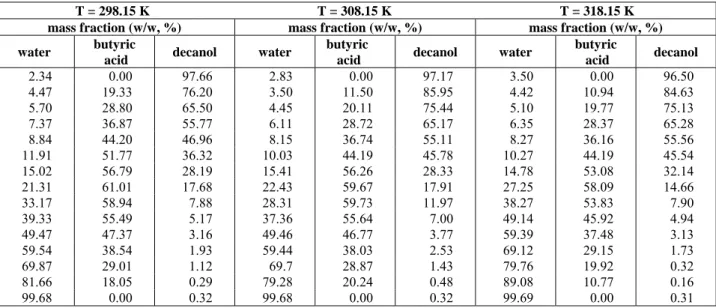
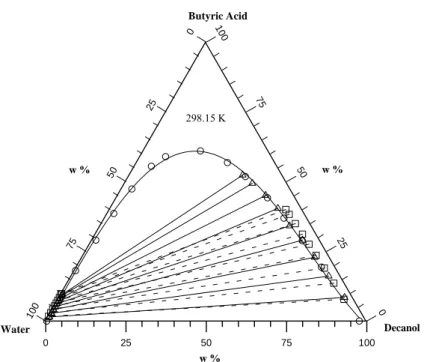
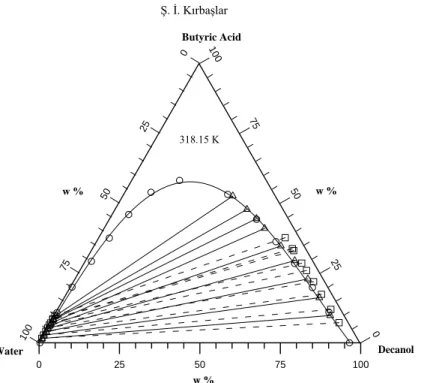
The experimental binodal curve and tie-line data on the water + butyric acid + decanol ternary system at 298.15, 308.15 and 318.15 K are given in Tables 2 and 3, respectively. The experimental LLE data and predicted tie lines at each temperature were plotted and shown in Figures 2, 3, and 4. As can be seen in Figures 2, 3 and 4, it was found that decanol was insoluble in water, but miscible with butyric acid. Distribution coefficients, (di), for water (i=1), butyric
acid (i=2) and separation factors (s), were calculated as follows:
i1 i3 i
w
w
d
=
(2)23 13 solvent-rich phase 21 11 water-rich phase distribution coefficient of butyric acid
s =
distribution coefficient of water
=(w /w ) /(w /w )
=
(3)
Table 2: Experimental binodal curve data for the water (1) + butyric acid (2) + decanol (3) system at each temperature.
T = 298.15 K T = 308.15 K T = 318.15 K
mass fraction (w/w, %) mass fraction (w/w, %) mass fraction (w/w, %)
water butyric
acid decanol water
butyric
acid decanol water
butyric
acid decanol
2.34 0.00 97.66 2.83 0.00 97.17 3.50 0.00 96.50
4.47 19.33 76.20 3.50 11.50 85.95 4.42 10.94 84.63 5.70 28.80 65.50 4.45 20.11 75.44 5.10 19.77 75.13 7.37 36.87 55.77 6.11 28.72 65.17 6.35 28.37 65.28 8.84 44.20 46.96 8.15 36.74 55.11 8.27 36.16 55.56 11.91 51.77 36.32 10.03 44.19 45.78 10.27 44.19 45.54 15.02 56.79 28.19 15.41 56.26 28.33 14.78 53.08 32.14 21.31 61.01 17.68 22.43 59.67 17.91 27.25 58.09 14.66 33.17 58.94 7.88 28.31 59.73 11.97 38.27 53.83 7.90
39.33 55.49 5.17 37.36 55.64 7.00 49.14 45.92 4.94
49.47 47.37 3.16 49.46 46.77 3.77 59.39 37.48 3.13
59.54 38.54 1.93 59.44 38.03 2.53 69.12 29.15 1.73
69.87 29.01 1.12 69.7 28.87 1.43 79.76 19.92 0.32
81.66 18.05 0.29 79.28 20.24 0.48 89.08 10.77 0.16
99.68 0.00 0.32 99.68 0.00 0.32 99.69 0.00 0.31
Table 3: Experimental tie lines of water (1) + butyric acid (2) + decanol (3) system at each temperature.
water-rich phase (w/w, %) solvent-rich phase (w/w, %)
water butyric acid decanol water butyric acid decanol
298.15 K
98.14 1.48 0.38 2.70 8.47 88.83 96.82 2.79 0.39 3.80 16.13 80.07 95.52 4.08 0.40 4.80 22.85 72.35 94.39 5.20 0.41 5.50 29.01 65.49 93.36 6.22 0.42 7.00 34.13 58.87 92.41 7.16 0.43 7.50 40.39 52.11 91.40 8.16 0.44 9.00 45.06 45.94 90.44 9.11 0.45 11.00 49.37 39.63 89.95 9.60 0.45 12.50 52.35 35.15
308.15 K
98.05 1.57 0.38 2.90 9.17 87.93 96.72 2.89 0.39 3.60 16.06 80.34 95.50 4.10 0.40 4.80 23.16 72.04 94.18 5.41 0.41 5.80 29.53 64.67 93.35 6.23 0.42 6.20 33.87 59.93 92.24 7.33 0.43 8.80 40.85 50.35 91.73 7.83 0.44 10.10 43.92 45.98 90.61 8.94 0.45 11.90 49.39 38.71 90.04 9.51 0.45 13.50 52.80 33.70
318.15 K
Butyric Acid
Water Decanol
0 25 50 75 100
25
50
75
100
0
0 25 50 10
0
75
w % w %
w %
298.15 K
Figure 2: Ternary diagram for LLE of water (1) + butyric acid (2) + decanol (3) at 298.15 K; −o− experimental solubility curve; −∆− experimental tie lines;
--□-- calculated (UNIFAC method) tie lines.
Butyric Acid
Water Decanol
0 25 50 75 100
25
50
75
10 0
0
0 25 50 10
0
75
w % w %
w %
308.15 K
Figure 3: Ternary diagram for LLE of water (1) + butyric acid (2) + decanol (3) at 308.15 K; −o− experimental solubility curve; −∆− experimental tie lines;
Butyric Acid
Water Decanol
0 25 50 75 100
25
50
75
100
0
0 25 50 10
0
75
w % w %
w %
318.15 K
Figure 4: Ternary diagram for LLE of water (1) + butyric acid (2) + decanol (3) at 318.15 K; −o− experimental solubility curve; −∆− experimental tie lines;
--□-- calculated (UNIFAC method) tie lines.
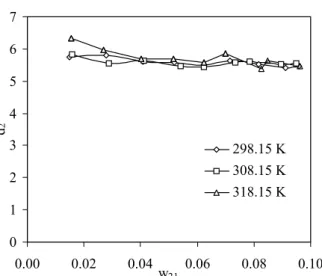
The distribution coefficients and separation factors for each temperature are given in Table 4. The effectiveness of extraction of butyric acid by decanol is given by its separation factor, which is a measure of the ability of decanol to separate the butyric acid from water. This quantity is found to be greater than 1 (varying from 36 to 208) for the system reported here, which means that extraction of butyric acid by decanol is possible. The separation factor is not constant over the whole heterogeneous region. The extraction power of the solvent at each temperature, plots of d2 vs. w21 and s vs. w21, are
shown in Figures 5 and 6, respectively.
The reliability of experimentally measured tie lines can be ascertained by applying the Othmer-Tobias correlation at each temperature (Othmer and Tobias, 1942). Othmer-Tobias plots were constructed of ln ((1-w33)/w33) vs. ln ((1-w11)/w11),
and a correlation is at 298.15 K shown in Figure 7. In Figure 7, the linearity of the plot indicates the degree of consistency of the related data. Similar results were observed for the rest of the data.
)
w
/
)
w
1
ln((
b
a
)
w
/
)
w
1
ln((
−
11 11=
+
−
33 33 (4)Table 4: Distribution coefficients, di, of water (1) - butyric acid (2)
and separation factors, s, at each temperature.
298.15 K 308.15 K 318.15 K
d1 d2 s d1 d2 s d1 d2 s
0 1 2 3 4 5 6 7
0.00 0.02 0.04 0.06 0.08 0.10 w21
d
2
298.15 K 308.15 K
318.15 K
Figure 5: Distribution coefficient, d2, for butyric acid as a function
of the mass fraction, w21, of butyric acid in aqueous phase.
0 50 100 150 200
0.00 0.02 0.04 0.06 0.08 0.10 w21
s
298.15 K 308.15 K
318.15 K
Figure 6: Separation factor, s, as a function of the mass fraction, w21, of butyric acid in the aqueous phase.
-5.0 -4.5 -4.0 -3.5 -3.0 -2.5 -2.0 -1.5 -1.0
-2.5 -1.5 -0.5 0.5
ln((1-w3 3)/w3 3)
ln((1-w
11
)/
w11
)
Prediction of Equilibria by the UNIFAC Method
The LLE data of the ternary system were predicted by UNIFAC using the interaction parameters for CH3, CH2, COOH, OH and H2O
functional groups obtained by Magnussen et al. (1981). The values of the UNIFAC parameters for LLE prediction are summarised in Table 5. As shown in Figures 2, 3 and 4, LLE relations predicted by the UNIFAC method could not adequately fit the experimental LLE data. The discrepancy between the experimental and predicted solubilities does not change with temperature because the predicted and experimental data are practically independent of temperature.
The root mean square deviations (rmsd) were calculated from the difference between the
experimental data and the predictions of the UNIFAC model at each temperature according to the following formula:
2 / 1 J
2 calcd , i exp , i I
K
N
6
/
)
X
X
(
rmsd
⎭
⎬
⎫
⎩
⎨
⎧
⎥⎦
⎤
⎢⎣
⎡
−
=
∑
∑
∑
(5)The UNIFAC method was used to predict the experimental data 0.6643 at T = 298.15 K, 0.6087 at T= 308.15 K and 0.6799 at T= 318.15 K with rmsd values.
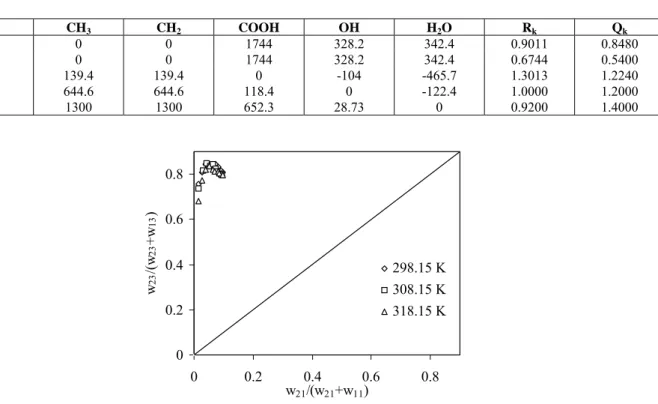
Selectivity diagrams on a solvent-free basis were obtained by plotting w23/(w23+w13) vs. w21/(w21+w11)
for each temperature in Figure 8. The effect of a temperature change on the selectivity values was found to be insignificant.
Table 5: UNIFAC parameters for prediction (Magnussen et al., 1981).
CH3 CH2 COOH OH H2O Rk Qk
CH3 0 0 1744 328.2 342.4 0.9011 0.8480
CH2 0 0 1744 328.2 342.4 0.6744 0.5400
COOH 139.4 139.4 0 -104 -465.7 1.3013 1.2240
OH 644.6 644.6 118.4 0 -122.4 1.0000 1.2000
H2O 1300 1300 652.3 28.73 0 0.9200 1.4000
0 0.2 0.4 0.6 0.8
0 0.2 0.4 0.6 0.8
w21/(w21+w11)
w
23
/(w
23
+w
13
)
298.15 K 308.15 K
318.15 K
Figure 8: Selectivity diagram at temperatures studied (free-solvent basis).
CONCLUSIONS
LLE data on the water + butyric acid + decanol system were determined experimentally at 298.15, 308.15 and 318.15 K. The temperature had a small effect on the size of the immiscibility region at the temperatures considered. It was shown that butyric acid was more soluble in solvent-rich phase than that
with an increase in the concentration butyric acid, as can be seen in Table 4.
Finally, it is concluded that decanol can be a suitable separation agent for dilute aqueous butyric acid.
ACKNOWLEDGEMENT
This work was supported by The Research Fund of Istanbul University, Project number: T-35/23072003. I thank Sema Yüksel for helping during the experimental studies.
NOMENCLATURE
a, b coefficients of the Othmer-Tobias equation, Eq. 4.
di distribution coefficient of the ith
component, Eq. 2.
E extract (solvent rich) phase, Eq. 1.
i component number: water (1), butyric acid (2) and decanol (3).
I water, butyric acid or decanol, Eq. 5. J solvent-rich or water-rich phase, Eq. 5. K tie-line number (1,2,3…N), Eq. 5. LLE liquid-liquid equilibrium.
N N tie-line number (N=9), Eq. 5. Qk relative van der Waals surface of
subgroup.
R raffinate (water-rich) phase, Eq. 1. Rk relative van der Waals volume of
subgroup.
s separation factor, Eq. 3. T temperature, K Tb boiling point, K
wi weight fraction of component i
w11 weight fraction of water (1) in the
water-rich phase
w21 weight fraction of butyric acid (2) in the
water-rich phase
w31 weight fraction of decanol (3) in the
water-rich phase
w13 weight fraction of water (1) in the
solvent-rich phase
w23 weight fraction of butyric acid (2) in the
solvent-rich phase
w33 weight fraction of decanol (3) in the
solvent-rich phase
X mole fraction of the component
Greek Symbols
ρ density (g / cm3)
nD refractive index
γ activity coefficients of the component
Subscripts
1 water 2 butyric acid 3 decanol calcd. calculated value exp. experimental value
i component number, water, butyric acid, decanol, Eq. 5.
Superscripts
E extract (solvent rich) phase R raffinate (water rich) phase
REFERENCES
Aljimaz, A.S., Fandary, M.S.H., Alkandary, J.A. and Fahim, M.A., Liquid-Liquid Equilibria of the Ternary System Water + Acetic Acid + 1-Heptanol, J. Chem. Eng. Data, 45, 301 (2000). Arce, A., Blanco, A., Souza, P. and Vidal, I.,
Liquid-Liquid Equilibria of the Ternary Mixtures Water + Propionic Acid + Methyl Ethyl Ketone and Water + Propionic Acid + Methyl Propyl Ketone, J. Chem. Eng. Data, 40, 225 (1995).
Colombo, A., Battilana, P., Ragaini, V. and Bianchi, C.L., Liquid-Liquid Equilibria of the Ternary Systems Water + Acetic Acid + Ethyl Acetate and Water + Acetic Acid + Isophorone (3,3,5-Trimethyl-cyclohexen-1one), J. Chem. Eng. Data, 44, 35 (1999).
Fahim, M.A., Qader, A. and Hughes, M.A., Extraction Equilibria of Acetic and Propionic Acids from Dilute Aqueous Solution by Several Solvents, Sep. Sci. Technol., 27, 1809 (1992). Fahim, M.A. and Al-Muhtaseb, A.A., Liquid-Liquid
Equilibria of the Ternary System Water + Acetic Acid + 2-Methyl-2-butanol, J. Chem. Eng. Data, 41, 1311 (1996).
Fahim, M.A., Al-Muhtaseb, A.A. and Al-Nashef, I.M., Liquid-Liquid Equilibria of the Ternary System Water + Acetic Acid + 1-Hexenol, J. Chem. Eng. Data, 42, 183 (1997).
Fredenslund, A., Jones, R.L. and Prausnitz, J.M., Group-Contribution Estimation of Activity Coefficients in Nonideal Liquid Mixtures, AIChE Journal, 21, 1086 (1975).
Aqueous Solutions, J. Chem. Tech. Biotechnol, 34A, 251 (1984).
İnce, E. and Kırbaşlar, Ş.İ., Liquid-Liquid Equilibria of the Water-Acetic Acid-Butyl Acetate System, Braz. J. Chem. Eng., 19, 243 (2002).
İnce, E., Liquid-Liquid Equilibria of the Ternary System Water + Acetic Acid + Dimethyl Adipate, Fluid Phase Equilib., 230, 58 (2005).
Lide, D.R., Handbook of Chemistry and Physics, 83th Edition. CRC Press Inc., Boca Raton FL., Section 3 (2002).
Magnussen, T., Ramussen, P. and Fredenslund, A., UNIFAC Parameters Table for Prediction of Liquid-Liquid Equilibria, Ind. Eng. Chem. Process. Des. Dev., 20, 331 (1981).
Othmer, D.F. and Tobias, P.E., Tie-line Correlation, Ind. Eng. Chem., 34, 690 (1942).
Sólimo, H.N., Bonatti, C.M., Zurita, J.L. and de Doz, M.B.G., Liquid-Liquid Equilibria for the System Water +Propionic Acid + 1-Butanol at 303.2 K. Effect of Addition of Sodium Chloride, Fluid Phase Equilib., 137, 163 (1997).
Taghikhani, V., Vakili-Nezhaad, G.R., Khoshkbarchi,
M.K., and Shariaty-Niassar, M., Liquid-Liquid Equilibria of Water + Propionic Acid + Metyl Butyl Ketone and of Water + Propionic Acid + Metyl Isopropyl Ketone, J. Chem. Eng. Data, 46, 1107 (2001).
Trevor, M., Letcher, T.M. and Redhi, G.G., Phase Equilibria for Liquid Mixtures of (Benzonitrile + a Carboxylic acid + Water) at T = 298.15 K, J. Chem. Thermodyn.,33, 1555 (2001).
Wardell, J.M. and King, C.J., Solvent Equilibria for Extraction of Carboxylic Acids from Water, J. Chem. Eng. Data, 23, 144 (1978).
Zigová , J., Vandák, D., Schlosser, Š. and Šturdik, E., Extraction Equilibria of Butyric-Acid with Organic-Solvents, Sep. Sci. Technol., 31, 2671 (1996).
Zigová, J. Šturdik, E.,Vandák, D. and Schlosser, Š., Butyric Acid Production by Clostridium butyricum with Integrated Extraction and Pertraction, Process Biochem., 34, 835 (1999). Zigová, J., and Šturdik, E., Advances in