RBRH, Porto Alegre, v. 22, e2, 2017 Scientiic/Technical Article
http://dx.doi.org/10.1590/2318-0331.011716082
Water quality of the São Gonçalo channel, urban and
agricultural water supply in southern Brazil
Qualidade de água do canal São Gonçalo, manancial urbano e agrícola no sul do Brasil
Edélti Faria Albertoni1, Cleber Palma-Silva1, Claudio Rossano Trindade1 and Leonardo Marques Furlanetto1
1Universidade Federal do Rio Grande, Rio Grande, RS, Brazil
E-mails: [email protected], [email protected] (EFA), [email protected] (CPS), [email protected] (CRT), [email protected] (LMF)
Received: June 16, 2016 - Revised: August 29, 2016 - Accepted: October 05, 2016
ABSTRACT
São Gonçalo channel connects Patos and Mirim lagoons, in South Brazil. This ecosystem is 70 Km long, and is a major regional source of urban and agricultural water supply, mainly for the municipality of Rio Grande, with ca. 250 thousand citizens. This study aims to diagnose their water quality by measuring benthic invertebrates (Shannon-Wiener diversity index, richness and abundance), use of a BMWP biotic index, physical and chemical evaluation, and applying a trophic state index. The BMWP index showed predominance of taxa indicating altered conditions and polluted waters (Sarcodina and Hydracarina). The abiotic variables indicated eutrophicated waters, chlorophyll values characteristic of eutrophic environments (>2.9 µg. L–1), low N:P rates in sediment and water, with nitrogen
limitation during most periods studied. The results of trophic state indexes indicated mesotrophic and eutrophic conditions, reaching hipereutrophic periods. The highest TSI were in Piratini river, in April 2009 and February 2011, coinciding with rice crop leaching. These results regarding nutrient concentration, nitrogen and phosphorus stoichiometry and biotic index support the need to evaluate the occupation of the surroundings of this water supply.
Keywords: TSI; BMWP; eutrophication; urban and agricultural water supply.
RESUMO
O canal São Gonçalo liga as lagoas dos Patos e Mirim, no sul do Brasil, possuindo um comprimento de cerca de 70 Km. É importante manancial agrícola para a cultura do arroz irrigado, e urbano, para o município de Rio Grande, com cerca de 250 mil habitantes. Este trabalho visou obter um diagnóstico da qualidade das águas deste manancial, utilizando métricas da comunidade de invertebrados bentônicos (índice de Shannon-Wiener, abundância e riqueza de táxons), e o índice biótico BMWP, avaliação de características físicas
e químicas, e aplicação do índice de estado tróico. O índice BMWP geral para o período indicou águas contaminadas ou poluídas,
com maiores valores de riqueza e densidade de grupos indicadores de condições alteradas (Sarcodina e Hydracarina). As variáveis
analisadas indicam águas eutroizadas, com valores de cloroila-a característicos de ambientes eutróicos (> 2,9 µg. L-1), baixas taxas
N:P tanto na água como no sedimento, indicando limitação por nitrogênio na maioria dos períodos. Estes valores são corroborados
pelos escores de índices de estado tróico, que em sua maioria indicaram condições de mesotroia e eutroia, atingindo períodos de hipertroia. Os valores de IET mais elevados ocorreram a jusante do rio Piratini, nas coletas de abril/2009 e fevereiro/2011, atingindo valores de super e hipereutróico, respectivamente, em períodos coincidentes com drenagem das culturas de arroz irrigado no entorno.
Os resultados encontrados relativos às concentrações de nutrientes, estequiometria de nitrogênio e fósforo e índice biótico reforçam a necessidade de avaliações de usos do entorno deste manancial.
INTRODUCTION
São Gonçalo Channel is a very important environment in regional development, located in a predominantly rural region. It is part of the Piratini-São Gonçalo-Mangueira watershed, in the south of the state of Rio Grande do Sul (FEPAM, 2016). São Gonçalo channel ensures the urban and industrial water supply of the city of Rio Grande, with a population of about 250,000, and will soon supply about 40% of the city of Pelotas, with 350,000 inhabitants (SANEP, 2016). The water low in this channel is regulated by rainfall (OLIVEIRA et al, 2015) and its
loodplain is important to maintain a high level of biodiversity
(ASMUS, 1998).
The preservation of water quality in a reservoir enables the cultivation of rice, predominant in the region, and supports
several communities of artisanal ishermen. Rice cultivation in
the state of Rio Grande do Sul accounts for about 54% of the national production (BRASIL, 2016). This culture, according to Grützmacher et al. (2008), is an activity with a high potential to contaminate water sources because it may transport chemical inputs, excess nutrients and sediment supply due to leaching from the crop. These elements are carried into the body of water, and may dissolve or precipitate in the sediment.
The evaluation of water quality uses indicators, seeking to relate variables that might provide an answer regarding the use of the environment and anthropogenic or natural changes (TOLEDO; NICOLELLA, 2002). Several tools are used to assess the quality of water using physical and chemical, biological, and waste elements such as metals and pesticides. Brazilian law, through Resolution number 357 of March 18, 2005 of the National Environment Council Environment, establishes
criteria for the classiication of Brazilian water uses (BRASIL, 2016). Some of these tools have achieved greater visibility by synthesizing results in numerical values, which can be understood by all actors involved in water resources management.
The use of biological parameters to infer the quality of a water body is premised on the response of organisms to changes, natural or anthropogenic, in the environment in which they live (BUSS; BAPTISTA; NESSIMIAN, 2003). Among the most used are biotic indices such as the Biological Monitoring Working Party (BMWP), with tolerance levels of benthic invertebrates, the trophic state index (TSI) and the stoichiometric relations between the two main nutrients responsible for the eutrophication of water bodies, nitrogen and phosphorus. The trophic state index provides indications of human activities in watersheds, and information for the management of aquatic ecosystems (FIA et al., 2009).
Given the importance of maintaining good water quality for its multiple uses including urban and agricultural supply, it is essential to monitor water quality for the conservation of this great regional water resource. The objective of this work is to diagnose the quality of channel water using benthic invertebrates by applying the biotic index BMWP, calculations of community metrics, diversity and abundance, evaluation of physical and
chemical characteristics, matching CONAMA 357/2005 and
application of TSI.
MATERIAL AND METHODS
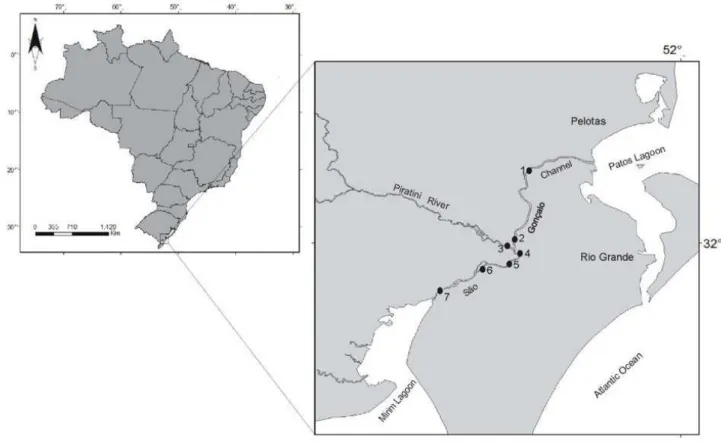
São Gonçalo channel is located in the southern portion of the coastal plain of Rio Grande do Sul state, between the cities of Rio Grande and Pelotas (Figure 1). This plain was formed in recent geological periods through sand deposits in the Quaternary,
and features a lat geomorphology with about 40% of its area
occupied by aquatic environments such as wetlands, small sandy streams, and small and large freshwater lagoons and ponds (TOMAZELLI; VILWOCK, 2005). São Gonçalo channel, which is about 70 km long links the Patos and Mirim lagoons, with an
average depth of ive meters, and its low is regulated by rainfall
(ASMUS, 1998). Periods of higher rainfall occur in the winter months, in contrast to periods of drought characteristic of the summer months, coinciding with the time of greater use of water for irrigated rice cultivation (KLEIN, 1998). However, during the study period, maximum and minimum monthly average values of rainfall ranged from 266.80 mm in the month of February 2010 to 31.50 mm in July 2009, due to the climatological phenomenon of El Niño between 2009 and 2010 (INPE, 2016), which inverts this pattern of precipitation, causing summer and autumn periods with more rainfall, and drier winters (Figure 2).
The study was conducted between April 2009 and February
2011. Five sample collection campaigns were held (April / 2009; September / 2009; March / 2010; September / 2010; February / 2011), lasting two days each, on board the oceanographic boat
Larus of the Federal University of Rio Grande. Sampling points were marked seeking to characterize areas subject to different environmental situations. Thus, the channel was divided into regions according to the main activities of water use and its main tributary that drains small streams receiving mainly urban and
agricultural efluent. To determine the limnological variables, water
samples were collected at seven sampling stations, on the left and right banks of the channel (Table 1), except at “Ilha Grande”, due to the small width of the channel. The results are shown as sample points with the average of the two sampling stations on site, termed P1 to P7.
To characterize the community of benthic macroinvertebrates, 65 sediment samples were collected with a Kajak corer. The sediment
was washed in running water, in a 250 μ mesh sieve and the retained
material preserved in 80% alcohol. Samples were screened using a stereoscopic microscope, and the results are presented as the average of sample points. The richness and mean abundance of taxa and Shannon Wiener diversity index were calculated for each date and sampling point. The biotic index BMWP (Biological Monitoring Working Party) was applied with adaptations by the Paraná State Department of the Environment and Water Resources (PARANÁ, 2015).
In the ield the temperature, dissolved oxygen, conductivity,
pH, alkalinity, water transparency were determined and water
iltration was performed with ilters (GF / C), for the determination
of chlorophyll (Chl-a), turbidity and suspended matter. A water sample was collected for the determination of nutrients, total nitrogen (Kjedhal) (NT), total phosphorus (TP) (digestion and mass spectrometry) (APHA, 2012) and the phosphate and nitrite fractions in a Dionex ionic chromatograph in the laboratory.
After the iltering process, water and ilters were kept in a freezer
The sediment was collected in ive replicates for each point,
totaling 65 samples per sampling date, to determine the abiotic characterization of the upper layer (total nitrogen Kjedhal, total phosphorus by digestion and mass spectrometry and organic
matter by combustion in a mufle furnace at 550 °C) (APHA,
2012). The water quality was determined by CONAMA Resolution
357/2005, which establishes standards for classifying water bodies
and guidelines for its framework (BRASIL, 2005).
The sampling points were tested for similarity applying principal coordinates analysis (PCoA), with Euclidean distance as a dissimilarity measure. This analysis was chosen because it did not require a linear correlation between variables (MANLY, 2008).
Figure 1. Area of study and sampling points. São Gonçalo channel between the cities of Rio Grande and Pelotas, Brazil.
A non-parametric analysis of variance with the Kruskal-Wallis test was applied. The analyses were conducted in the Past software (HAMMER; HARPER; RYAN, 2001). An analysis of correlation between the turbidity values, total nitrogen and total phosphorus with rainfall values was done according to data from the National Institute of Meteorology for the months when sampling was performed (Figure 2).
The data of variable chlorophyll-a and total phosphorus were used to determine the trophic state index (TSI), proposed by Carlson (1977), and modiied by Cunha, Calijuri and Lamparelli et al. (2013), adapted to tropical and subtropical values. In this work we used the simple average of the chlorophyll-a values and total phosphorus in each sampling period, and the TSI was determined using Equations 1-3 below:
( ) ( )
(
[ / 2
TSI= TSI TP TSI Chla+ (1) where
TSI(TP) = trophic state index based on total phosphorus concentration, calculated as:
( ) 1 0 6
(
( 0.27637 1 .329766 /) 2)
IET TP = − − lnTP+ ln (2) TSI(Chla) = trophic state index based on chlorophyll-a concentration, calculated as:
( ) 1 0 6
(
( 0.2512 0.842257 /) 2)
TSI Chla = − − lnChla+ ln (3) The values obtained were classified according to
ultraoligotrophic categories ≤ 51.1, oligotrophic, between
51.2 and 53.1, mesotrophic, between 53.2 and 55.7, eutrophic between 55.8 and 58.1, supereutrophic 58, 2 and 59.0, and
hypertrophic ≥ 59.1.
The N:P relations were determined in the sediment (mmol.g-1)
and in the water column (mmol.mL-1), as well as average values of
the total phosphorus concentration and total chlorophyll.
RESULTS AND DISCUSSION
The predominant benthic organisms were, in general, the groups Sarcodina, Chironomids, Hydracarina and Oligochaeta at all points analyzed (Table 2). The average rates of Shannon-Wiener diversity remained constant, ranging between 2.81 and 2.77. Similarly, the richness of taxa oscillated between 65 and 67 taxa on each collection date. There was a greater variation between points, the richest points being those surrounding the Piratini River, which also had the highest average abundance of organisms (Figure 3). Since it drained longer stretches in urban areas, the river Piratini
and its tributaries receiving a higher wastewater inlow (FEPAM, 2016), a factor that increases the amount of organic matter and favors a greater abundance of some groups of benthic organisms.
However, although the taxa richness and diversity indices were high (Figure 3), this is due to the diversity of speciic groups such as Sarcodina, which showed an average of 11 morphotypes and Hydracarina with nine morphotypes. The dominance of these groups is indicative of altered locations according to the biotic index applied. Sarcodina consists of protozoa not counted in scores of water quality indices, and Hydracarina, with a score of four points in the BMWP index.
Organisms indicating good water quality, such as the insects of the Ephemeroptera and Trichoptera orders were recorded in low numbers. On the other hand, the averages of
Table 1. Location of sampling points in the São Gonçalo channel.
São Gonçalo Channel
Ponto Local Station Coordenate Characteristics
1 Upstream of the sluice
LM 1.1 31°48. 592’ S
52°29.044’ W Beggining of the barrier region to salt water mixture
RM 1.2. 31°48. 596’ S 52°23.547’ W
2 Downstream Piratini river
LM 2.1. 32°00.699’ S 52° 25.176’ W
Above river drainage area RM 2.2. 32° 01.070’ S
52° 25 087 W
3 Piratini River
LM 3.1. 32° 00. 910’ S / 52° 25. 672’ W
End of river receptor body RM 3.2. 32° 00.816’ S
52° 25.636’ W
4 Upstream Piratini River
LM 4.1. 32° 01.301’ S 52° 25.212’ W
Below river drainage area RM 4.2. 32° 01.274’ S
52° 25.098’ W
5 CORSAN
LM 5.1. 32°02.375’ S 52° 24.730’ W
Catchment water to Rio Grande RM 5.2. 32° 02.455’ S
52° 24.601’ W
6 Ilha Grande LM 6.1 32°04.144’ S
52°30.493’ W
Intermediate region with narrowing of the channel
7 Santa Isabel
LM 7.1 32°07.124’ S
52° 35.550’ W Village near the entrance of Mirim lagoon
organisms indicating altered conditions, such as Oligochaeta, Chironomidae and Gastropoda were higher (Table 2). Considering the total number of organisms found, the result of BMWP was 41, level V as a SEMA (PARANÁ, 2015) score that ranks the São
Gonçalo channel as contaminated or polluted water, or modiied
system. When evaluating the sampling points individually, the mean scores over the sample period ranged from a maximum
of 32 to a minimum of 22, which classiies all channel sites as
much changed systems with highly polluted waters. Similar results were reported by Cunha et al. (2013), for a rural lagoon, near São Gonçalo channel which was also surrounded by cattle farms.
Benthic invertebrates have been widely applied as bioindicators in several water quality assessment studies (e.g. SILVEIRA et al., 2005 and SILVA et al., 2007, in southeastern Brazil; PACHECO et al., 2012, in Uruguay; WYŻGA et al., 2013, adapted to rivers in Poland). Thus, the results for the biotic index denote clear concern with the state of change in water quality.
These values are consistent with the results of abiotic measurements (Table 3 and 4) and trophic state indices detected.
Ordination of the similarity of abiotic variables at all sampling points by principal coordinates (PCoA) showed groups formed
according to the characteristics of the sampled sites. The irst two
components explained 98.1% of the data variability (76.9 and 19.5% for the coordinates 1 and 2, respectively), grouping points 3 and 4, which are respectively the Piratini river and it downstream, points 1 and 2, in the vicinity of the sluice, and points 5 and 7, near the channel connection with the Mirim lagoon (Figure 4). Point 6 in Ilha Grande channel, was the furthest from the other groups formed, probably due to high turbidity values detected (Table 3). The comparison test between the median values found during
the sampling period showed no signiicant difference between
the abiotic variables of the water column (H = 0.061, p = 0.99). In general, the parameters dissolved oxygen, chlorophyll-a
and nitrite, recommended by CONAMA resolution 357/2005
(BRASIL, 2005) were within the quality standards for Class 2, recommended for public supply. However, in the water at São
Gonçalo channel shown with high turbidity, the values were between 42 and 388 NTU. The greatest value of this parameter was detected at P6, located in the channel of Ilha Grande, in the
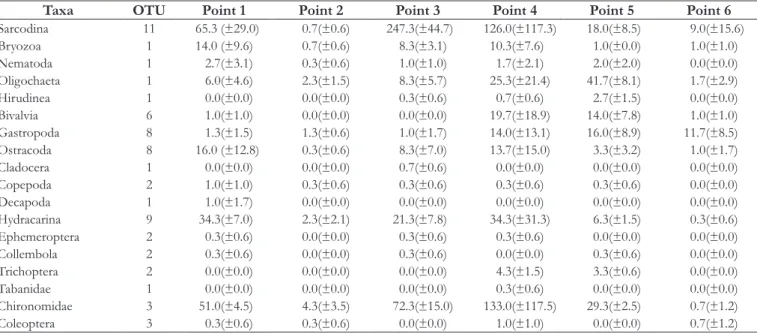
Table 2. Mean (±standard deviation) of the taxa found throughout the study period, grouped by sampling points in São Gonçalo channel.
Taxa OTU Point 1 Point 2 Point 3 Point 4 Point 5 Point 6
Sarcodina 11 65.3 (±29.0) 0.7(±0.6) 247.3(±44.7) 126.0(±117.3) 18.0(±8.5) 9.0(±15.6) Bryozoa 1 14.0 (±9.6) 0.7(±0.6) 8.3(±3.1) 10.3(±7.6) 1.0(±0.0) 1.0(±1.0) Nematoda 1 2.7(±3.1) 0.3(±0.6) 1.0(±1.0) 1.7(±2.1) 2.0(±2.0) 0.0(±0.0) Oligochaeta 1 6.0(±4.6) 2.3(±1.5) 8.3(±5.7) 25.3(±21.4) 41.7(±8.1) 1.7(±2.9) Hirudinea 1 0.0(±0.0) 0.0(±0.0) 0.3(±0.6) 0.7(±0.6) 2.7(±1.5) 0.0(±0.0) Bivalvia 6 1.0(±1.0) 0.0(±0.0) 0.0(±0.0) 19.7(±18.9) 14.0(±7.8) 1.0(±1.0) Gastropoda 8 1.3(±1.5) 1.3(±0.6) 1.0(±1.7) 14.0(±13.1) 16.0(±8.9) 11.7(±8.5) Ostracoda 8 16.0 (±12.8) 0.3(±0.6) 8.3(±7.0) 13.7(±15.0) 3.3(±3.2) 1.0(±1.7) Cladocera 1 0.0(±0.0) 0.0(±0.0) 0.7(±0.6) 0.0(±0.0) 0.0(±0.0) 0.0(±0.0) Copepoda 2 1.0(±1.0) 0.3(±0.6) 0.3(±0.6) 0.3(±0.6) 0.3(±0.6) 0.0(±0.0) Decapoda 1 1.0(±1.7) 0.0(±0.0) 0.0(±0.0) 0.0(±0.0) 0.0(±0.0) 0.0(±0.0) Hydracarina 9 34.3(±7.0) 2.3(±2.1) 21.3(±7.8) 34.3(±31.3) 6.3(±1.5) 0.3(±0.6) Ephemeroptera 2 0.3(±0.6) 0.0(±0.0) 0.3(±0.6) 0.3(±0.6) 0.0(±0.0) 0.0(±0.0) Collembola 2 0.3(±0.6) 0.0(±0.0) 0.3(±0.6) 0.0(±0.0) 0.3(±0.6) 0.0(±0.0) Trichoptera 2 0.0(±0.0) 0.0(±0.0) 0.0(±0.0) 4.3(±1.5) 3.3(±0.6) 0.0(±0.0) Tabanidae 1 0.0(±0.0) 0.0(±0.0) 0.0(±0.0) 0.3(±0.6) 0.0(±0.0) 0.0(±0.0) Chironomidae 3 51.0(±4.5) 4.3(±3.5) 72.3(±15.0) 133.0(±117.5) 29.3(±2.5) 0.7(±1.2) Coleoptera 3 0.3(±0.6) 0.3(±0.6) 0.0(±0.0) 1.0(±1.0) 0.0(±0.0) 0.7(±1.2)
OTU = operational taxonomic units (different morphotypes).
Figure 4. Ordenation by principal coordinates (PCoA) of the abiotic variable values at the seven points in the sampling dates (April 2009, September 2009, March 2010, September 2010 and February 2011).
collection of February 2011, coinciding with the drainage period of rice crops. This point, on average, presented the highest turbidity values for all samples (Table 3). According to Brasil (2005) for water supply in Class 2, it may contain a maximum of 100 NTU turbidity values. For all samples, the values were on average higher than this limit at all sampling points (Table 3). There was a positive
correlation coeficient of determination of 54% between the
turbidity values and precipitation values. Secchi disk values were shown to be low, the highest value recorded being 42 cm among all points and sampling dates.
Another parameter found outside the limits recommended by the CONAMA resolution was total phosphorus. At every point it exceeded the maximum value of 0.050 mg L–1 (Table 3).
Phosphorus is generally a limiting nutrient for primary production in aquatic ecosystems (CAMARGO; PEZZATO; HENRY-SILVA, 2003). Environments with high concentrations of this nutrient can become limiting for nitrogen (MANSOR; TEIXEIRA FILHO; ROSTON, 2006; BATISTA et al., 2012). As the water low of São Gonçalo channel is regulated by rainfall, the possible relationship between this variable and the concentration of nutrients nitrogen
and phosphorus and turbidity values was tested. In general, the low
caused by rain water increases the concentration of phosphorus and nitrogen in water bodies (BORTOLETTO et al., 2015). The precipitation values in the months when sampling was performed showed a positive correlation with turbidity values (r2 = 0.54),
but there was no correlation with the values of total nitrogen and total phosphorus nutrients (r2 = 0.07 and 0.13, respectively).
Thus, it is clear that the decrease in water quality of the São
Gonçalo channel, inluenced by the turbidity values, has a direct
and positive relationship with the rainfall regime in the region, and
other factors inluence the increase of the nutrients concentration.
The organic material in the sediment at all points and sampling dates contained 14% of the samples between 0.1 and 3%, 74% of the time between 3 and 10%, and the remaining 11% with concentrations above 10% of organic matter content in sediment gram (Table 4). According to Esteves (2011) sediments with lower values than 10% of organic matter are considered inorganic, and in general are the size of sand particles. The values found in our study are similar to those reported for river (SILVA et al., 2010) and estuarine systems (OLIVEIRA et al., 2014), authors who reported a high percentage of organic matter values in the sediment with sources of organic pollution.
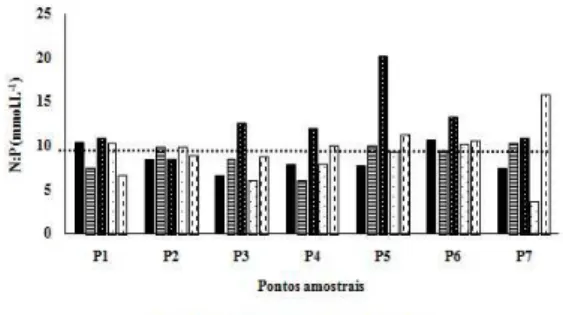
The total nitrogen and total phosphorus ratio establishes the limiting factor in the process of aquatic environment eutrophication, and below 10 indicates environments with nitrogen limitation for primary production (MANSOR; TEIXEIRA FILHO; ROSTON, 2006; BATISTA et al., 2012). Like the values found in the water column, in data from most sampling points, the channel was found to be limited by nitrogen, which is indicative of high concentrations of phosphorus (Figure 5). This is probably due to the leaching environment so that this relationship, in the sediment, shows higher values as a result of higher nitrogen concentrations (Figure 6).
In situations where the nitrogen takes on a limiting role there is a great likelihood of cyanobacteria that have species capable of
ixing atmospheric nitrogen. The group of cyanobacteria, as well
Table 3. Average values (±standard deviation) of the abiotic variables of the water column over the sample period (April 2009, September 2009, March 2010, September 2010 and February 2011) in São Gonçalo channel.
Point 1 Point 2 Point 3 Point 4 Point 5 Point 6 Point 1
Water Temperature (°C) 21.8 (±4.4) 21.3 (±4.1) 21.5 (±4.0) 21.0 (±4.4) 21.5 (±4.5) 21.1 (±4.3) 20.5 (±4.4) Dissolved Oxigen (mg.L–1) 8.2 (±1.2) 8.7 (±1.4) 9.3 (±2.4) 9.0 (±2.1) 9.2 (±2.5) 9.1 (±2.1) 9.0 (±3.3)
pH 7.4 (±0.3) 6.9 (±0.8) 7.1 (±1.0) 7.3 (±0.4) 7.3 (±0.5) 7.3 (±0.4) 7.1 (±0.7) Alcalinity (mg.L–1) 551.9 (±87.1) 543.5 (±172.2) 594.3 (±192.5) 608.5 (±81.6) 635.3 (±115.0) 635.8 (±166.3) 654.4 (±192.7)
Eletric Conductivity (µS.cm–1) 102.0 (±16.9) 87.2 (±26.0) 86.8 (±23.8) 103.2 (±14.7) 104.1 (±14.5) 103.3 (±16.8) 104.2 (±14.9)
Suspended Material (mg. L–1) 32.2 (±17.7) 21.6 (±15.6) 34.1 (±22.0) 30.3 (±9.1) 34.9 (±28.1) 38.2 (±24.2) 34.9 (±16.6)
Chlorophyll-a (µg. L–1) 8.3 (±3.7) 27.8 (±48.3) 5.2 (±5.0) 4.4 (±1.8) 4.4 (±3.1) 5.6 (±3.1) 5.1 (±4.6)
Phosphate (µM) 1.1 (±0.6) 1.2 (±1.4) 1.6 (±1.7) 1.3 (±1.3) 0.9 (±0.5) 0.8 (±0.8) 1.1 (±0.6) Nitrite (µM) 0.2 (±0.1) 0.2 (±0.1) 0.2 (±0.1) 0.3 (±0.1) 1.1 (±1.8) 0.2 (±0.2) 0.3 (±0.2) Total Phosphorus (µg. L–1) 62.9 (±21.0) 68.0 (±17.2) 65.5 (±20.7) 88.2 (±51.9) 71.1 (±20.7) 64.8 (±15.7) 82.9 (±36.6)
Total Nitrogen (mg. L–1) 0.5 (±0.4) 0.6 (±0.1) 0.5 (±0.2) 0.5 (±0.2) 0.7 (±0.1) 0.7 (±0.4) 0.7 (±0.2)
Turbidity (NTU) 135.4 (±96.1) 89.7 (±18.0) 90.7 (±22.5) 92.5 (±28.4) 135.5 (±113.1) 185.7 (±175.7) 161.3 (±154.5)
Table 4. Average values (±standard deviation) of the variables measured in the São Gonçalo channel sediment over the sampling period (April 2009, September 2009, March 2010, September 2010 and February 2011).
P1 P2 P3 P4 P5 P6 P7
Organic Matter (g) 0.0499 (±0.003) 0.0344 (±0.017) 0.0979 (±0.065) 0.0739 (±0.025) 0.0448 (±0.014) 0.0933 (±0.074) 0.0373 (±0.022) Organic Carbon
(mmol.g–1)
0.0019 (±0.0001) 0.0013 (±0.001) 0.0038 (±0.002) 0.0029 (±0.001) 0.001756 (±0.000569) 0.003653 (±0.0029) 0.0015 (±0.001) Total Phosphorus
(mmol.g–1)
0.0041 (±0.001) 0.0039 (±0.0003) 0.0039 (±0.001) 0.0043 (±0.001) 0.005303 (±0.00129) 0.0057 (±0.0003) 0.0043 (±0.001) Total Nitrogen
(mmol.g–1)
as its potential toxicity, can cause serious disturbances in the water treatment processes (MATTHIENSEN; YUNES; CODD, 1999).
The relationship established between the total phosphorus concentration in the water column and chlorophyll-a obtained a
coeficient of determination of 25% (Figure 7A). According to Sperling (1996) chlorophyll-a versus phosphorus concentration is another useful relationship to the knowledge of the dynamics of eutrophication in water supply sources. Although this correlation value is low, it follows the pattern found in other research with a larger number of samples, such as Silva (2012), evaluating 466 points in rivers in the state of Minas Gerais, which obtained
a coeficient of determination of 38%, and Lamparelli (2004) with 52 points in rivers in the state of São Paulo, getting an r2
of 58%. There was no correlation between total nitrogen and chlorophyll-a (Figure 7B). A low correlation of results between these two variables was also reported by Silva (2012) for the same 466 points in Minas Gerais rivers (r2 = 0.28). Generally the ratio of
nutrients and algal chlorophyll occurs exponentially in temperate
environments, which does not occur in tropical and subtropical systems (HUSZAR et al., 2006).
According to Huszar et al. (2006), the eutrophication process resulting in algal growth in tropical and subtropical systems may be limited by nitrogen, phosphorus or both, due to biogeochemical processes resulting from high temperatures (rapid assimilation of
nutrients, nitriication, phosphorous precipitation into sediment,
etc.). Low rates of N: P are of concern in freshwater ecosystems, as they are generally correlated with high concentrations of chlorophyll-a. According to Wetzel (2001), temperate environments,
with chlorophyll-a greater than 10 μg.L–1 are considered eutrophic.
As for tropical-subtropical environments, the threshold values were
considered those greater than 2.96 μg.L–1 (CUNHA; CALIJURI;
LAMPARELLI, 2013).
The chlorophyll-a values detected detected in our samples
were always above the concentration of 2.96 μg.L–1, relecting
the attention given to the trophic state of the São Gonçalo channel. Nevertheless, several authors discuss the predominance of cyanobacteria, with potential toxicity in the water, when the environment is limited by nitrogen (HAVENS et al., 2003; SILVA, 2012). According to the authors, a point that may favor the ecosystem is protection of frequent cyanobacteria growth is low light penetration caused by the high organic turbidity. The results for the São Gonçalo channel, in this respect, show a balance between the possibility of algal growth checked by low rates of N: P, and the balance between light penetration for phytoplankton growth. From the data obtained in this study, the N:P relations and correlations of nutrients with the chlorophyll-a concentrations indicate that the waters of São Gonçalo channel are undergoing eutrophication processes with a high probability of cyanobacteria blooms due to their limitation by nitrogen. Similar results were reported by Fia et al. (2009) analyzing the trophic state index of the watershed of the Mirim lagoon, already reporting concern about the high concentrations of phosphorus mainly detected in São Gonçalo channel.
There was high variability in TSI values over the study period.
The scores ranged from 52.2 (September / 2010) and 62.7 (February / 2011), indicating states between oligotrophy and hypertrophy.
Considering all the sampling points, and collection dates, the results of TSIs showed that the waters of São Gonçalo channel were 11.5% in the oligotrophic state, 45.7% in mesotrophic, 37.1% were considered eutrophic, 2.8% supereutrophic and 2.9% considered in hypertrophic state (Figure 8). Speciically the latter, because they are more worrying in terms of water quality changes, were detected at P2 (downstream of the Piratini river), in the samplings
of April / 09 (score 59.1) and February 2011 (score 62.7), probably in urban efluent carried by the river, as well as leaching from the
next crop. Among the human activities recorded in Piratini - São Gonçalo - Mangueira basin, for all 14 municipalities, the main one is surface irrigation (FEPAM, 2016). Particularly the Piratini river which runs through six municipalities before emptying into the São Gonçalo channel carries urban wastewater and drains waste from agricultural activities, especially rice cultivation and, more recently, exotic forestry species (FEPAM, 2016).
Samples taken in the irst months of the year are representative of the inal period of the rice harvest, when crops are depleted
and irrigation water is returned to the water bodies. In this process,
Figure 5. N: P ratio of the water (mmol.mL–1) at all points
and sampling dates. The dotted line deines the value of 10,
indicating limited by nitrogen or phosphorus. AB09 = April 2009; SE09 = September 2009; MA10 = March 2010; SE10 = September 2010 and FE11 = February 2011.
Figure 6. N:P ratio of the sediment (mmol.g–1), at all points
and sampling dates. The dotted line deines the value of 10,
many of the inputs used in the culture, such as pesticides and nutrients, are found dissolved, and ultimately enrich the receiving water bodies. It is reported by Mansor, Teixeira Filho and Roston (2006), that the main sources of nitrogen and phosphorus for a sub-basin of the river Jaguari (SP) is from diffuse sources of agricultural origin. When, at the same time, large amounts of rainfall occur, the support material of crops, in addition to the characteristic drainage period is the sum of leaching input via runoff. As to the average values of rainfall, the collection of April 2009, although in a month with low rainfall (33.2 mm), was preceded by two months with a large volume (212 mm in February and 103.8 mm in March), which certainly contributed to the leaching of crops draining in larger quantities into the channel. Similarly the month of March 2010, which showed a volume of only 31.6 mm of rain was preceded by a month with an average
volume of 266.8 mm. In February 2011 there was already high rainfall, 135 mm (Figure 2). The samplings of the months of September 2009 and September 2011 had volumes of 138.20 and 118.60 mm. In 2009, the previous month (August) also had a large volume of rainfall, 175 mm, contributing to the transport of the material from the crops into the channel.
Already in previous years Fia et al. (2009) reported the variability of TSI values in various aquatic environments of the Mirim lagoon basin, linking this system with a with a large area
of rice ields on both banks. Previous research has shown the
persistence of pesticides in the waters of the canal, coming from
the return of water used in rice ields (GRÜTZMACHER et al., 2008). It is reported by several studies on watershed management is a complex problem, and eutrophication helps to increase the degree of complexity (ANDREOLI; CARNEIRO, 2005).
CONCLUSIONS
1- The variables indicate eutrophic waters, predominant benthic invertebrates characteristic of sites with severe changes in water quality, supported by the values of the trophic state index, which mostly indicated conditions of mesotrophy and eutrophy, reaching periods of hypertrophy.
2- Thus, this channel, as an important source for both human consumption and water resources for agriculture, should be monitored carefully, avoiding sources of diffuse pollution, particularly those of agricultural origin, which may deteriorate the quality of its waters.
3- The results for the concentrations of nutrients, nitrogen and phosphorus stoichiometry and biotic index support the need to evaluate the surrounding uses of this system to maintain the quality of the water for its use as a supply.
Figure 8. Trophic State Index (TSI) considering all points and sampling dates. The lines mark the boundaries of the trophic
classiication values, U = ultraoligotrophic; O = oligotrophic;
M = mesotrophic; E = eutrophic; S = supereutrophic and H = hypereutrophic.
Figure 7. Correlation of nutrients and chlorophyll-a in São Gonçalo channel at all points and sampling dates (n = 25). (A) Total
ACKNOWLEDGEMENTS
Biologists Fernanda Marques (PPGOB-FURG) for design of the study area map and Milene Stangler to aid in the initial screening of benthic invertebrate fauna. The two reviewers and Associate Editor for contributions in improving the manuscript. Funded project by FAPERGS (Research Foundation of the Rio
Grande do Sul State) process 0541/08.
REFERENCES
ANDREOLI, C. V.; CARNEIRO, C. Gestão integrada de mananciais de abastecimento eutroizados. Curitiba: FINP/SANEPAR, 2005. 500 p.
APHA - AMERICAN PUBLIC HEALTH ASSOCIATION. Standard methods for the examination of water and wastewater. 22nd ed. Washington, DC: APHA, 2012.
ASMUS, M. L. A Planície Costeira e a Lagoa dos Patos. In: SEELIGER, U.; ODEBRECHT, C.; CASTELLO, J. P. (Eds). Os ecossistemas costeiro e marinho do extremo sul do Brasil. Rio Grande: Ecoscientia, 1998. cap. 3, p. 9-12.
BATISTA, A. A.; MEIRELES, A. C. M.; DE ANDRADE, E. M.; ARAÚJO NETO, J. R.; PALÁCIO, H. A. Q. Relação entre nitrogênio e fósforo nas águas superficiais do açude Orós-CE. In: 4º WINOTEC – Workshop Internacional de Inovações Tecnológicas na Irrigação, 2012 maio 21-31, Fortaleza. Anais… Fortaleza, 2012. 5 p. CD-ROM.
BORTOLETTO, E. C.; SILVA, H. A.; BONIFÁCIO, C. M.; TAVARES, C. R. G. Water quality monitoring of the Pirapó River watershed, Paraná, Brazil. Brazilian Journal of Biology = Revista Brasileira de Biologia, v. 75, n. 4, p. S148-S157, 2015. Supplement 2. PMid:26815943. http://dx.doi.org/10.1590/1519-6984.00313suppl.
BRASIL. Conselho Nacional do Meio Ambiente. Resolução no 357, de 17 de março de 2005. Dispõe sobre a classificação dos corpos de água e diretrizes ambientais para o seu enquadramento, bem como estabelece as condições e padrões de lançamento de efluentes, e dá outras providências. Diário Oficial [da] República Federativa do Brasil, Brasília, DF, 18 mar. 2005. Available from:
<http://www.mma.gov.br/conama/res/res05/res35705>. Access
on: 12 aug. 2016
BRASIL. Ministério da Agricultura. Arroz. Brasília, 2016. Available
from: <http://www.agricultura.gov.br/vegetal/culturas/arroz>.
Access on: 20 may 2016.
BUSS, D. F.; BAPTISTA, D. F.; NESSIMIAN, J. L. Bases conceituais para a aplicação de biomonitoramento em programas de avaliação da qualidade da água de rios. Cadernos de Saúde Publica, v. 19, n. 2, p. 465-473, 2003. PMid:12764462. http://dx.doi.org/10.1590/ S0102-311X2003000200013.
CAMARGO, A. F. M.; PEZZATO, M. M.; HENRY-SILVA, G. Fatores limitantes à produção primária de macrófitas aquáticas.
In: THOMAZ, S. M.; BINI, M. L. Ecologia e manejo das macróitas aquáticas. Maringá: EdUEM, 2003. p. 59-83.
CARLSON, R. E. A trophic state index for lakes. Limnology and Oceanography, v. 22, n. 2, p. 361-369, 1977. http://dx.doi.org/10.4319/ lo.1977.22.2.0361.
CUNHA, D. G. F.; CALIJURI, M. C.; LAMPARELLI, M. C. A
trophic state index for tropical/subtropical reservoirs (TSItsr).
Ecological Engineering, v. 60, p. 126-134, 2013. http://dx.doi.
org/10.1016/j.ecoleng.2013.07.058.
CUNHA, R. W.; GARCIA JUNIOR, M. D. N.; ALBERTONI, E. F.; PALMA-SILVA, C. Qualidade de água de uma lagoa rasa em meio rural no sul do Brasil. Revista Brasileira de Engenharia Agrícola e Ambiental, v. 17, n. 7, p. 770-779, 2013. http://dx.doi.
org/10.1590/S1415-43662013000700012.
ESTEVES, F. A. Fundamentos de Limnologia. 3. ed. Rio de Janeiro: Interciência, 2011. 790 p.
FEPAM – Fundação Estadual de Proteção Ambiental Henrique
Luiz Roessler. Porto Alegre, 2016. Available from: <http://www. fepam.rs.gov.br/>. Access on: 30 july 2016
FIA, R.; MATOS, A. T.; CORADI, P. C.; PEREIRA-RAMIREZ, O. Estado trófico da água na bacia hidrográfica da Lagoa Mirim, RS, Brasil. Ambi-Agua, v. 4, n. 1, p. 132-141, 2009. http://dx.doi.
org/10.4136/ambi-agua.78.
GRÜTZMACHER, D. D.; GRÜTZMACHER, A. D.; AGOSTINETTO, D.; LOECK, A. E.; ROMAN, R.; PEIXOTO, S. C.; ZANELLA, R. Monitoramento de agrotóxicos em dois mananciais hídricos no sul do Brasil. Revista Brasileira de Engenharia Agrícola e Ambiental, v. 12, n. 6, p. 632-637, 2008. http://dx.doi.org/10.1590/S1415-43662008000600010.
HAMMER, O.; HARPER, D.A.T; RYAN, P. D. PAST: Paleontological Statistics software for education and data analysis. Paleontological Eletronica, v. 4, n. 1, p. 1-9, 2001.
HAVENS, K. E.; JAMES, R. T.; EAST, T. L.; SMITH, V. H. N: P ratios, light limitation, and cyanobacterial dominance in a subtropical lake impacted by non-point source nutrient pollution. Environmental Pollution, v. 122, n. 3, p. 379-390, 2003. PMid:12547527. http://
dx.doi.org/10.1016/S0269-7491(02)00304-4.
HUSZAR, V. L. M.; CARACO, N. F.; ROLAND, F.; COLE, J. Nutrient–chlorophyll relationships in tropical–subtropical lakes: do temperate models fit? Biogeochemistry, v. 79, n. 2, p. 239-250, 2006. http://dx.doi.org/10.1007/s10533-006-9007-9.
INMET – Instituto Nacional de Meteorologia. Brasília, 2016. Available from: <www.inmet.gov.br>. Access on: 15 aug. 2016.
Paulista, 2016. Available from: <http://www.cptec.inpe.br>.
Access on: 15 aug. 2016.
KLEIN, A. H. F. Clima regional. In: SEELIGER, U.; ODEBRECHT, C.; CASTELLO, J. P. (Eds). Os ecossistemas costeiro e marinho do extremo sul do Brasil. Rio Grande: Ecoscientia, 1998. cap. 2, p. 14-27.
LAMPARELLI, M. C. Grau de troia de corpos de água do estado de São Paulo: avaliação dos métodos de monitoramento. 2004. 235 f. Tese (Doutorado) - Departamento de Ecologia, Universidade de São Paulo, São Paulo, 2004.
MANLY, B. Métodos estatísticos multivariados: uma introdução. 3. ed. Porto Alegre: Artmed, 2008. 211 p.
MANSOR, M. T. C.; TEIXEIRA FILHO, J.; ROSTON, D. M. Avaliação preliminar das cargas difusas de origem rural, em uma sub-bacia do Rio Jaguari, SP. Revista Brasileira de Engenharia Agrícola e Ambiental, v. 10, n. 3, p. 715-723, 2006. http://dx.doi.org/10.1590/ S1415-43662006000300026.
MATTHIENSEN, A.; YUNES, J. S.; CODD, G. A. Ocorrência, distribuição e toxicidade de cianobactérias no estuário da Lagoa dos Patos, RS. Revista Brasileira de Biologia, v. 59, n. 3, p. 361-376, 1999. PMid:10765462. http://dx.doi.org/10.1590/S0034-71081999000300002.
OLIVEIRA, H. A.; FERNANDES, E. H. L.; MÖLLER JUNIOR, O. O.; COLLARES, G. L. Processos hidrológicos e hidrodinâmicos da Lagoa Mirim. Revista Brasileira de Recursos Hídricos, v. 20, n. 1, p. 34-45, 2015. http://dx.doi.org/10.21168/rbrh.v20n1.p34-45.
OLIVEIRA, T. S.; BARCELLOS, R. L.; SCHETTINI, C. A. F.; CAMARGO, P. B. Processo sedimentar atual e distribuição da matéria orgânica em um complexo estuarino tropical, Recife, PE, Brasil. Revista de Gestão Costeira Integrada, v. 14, n. 3, p. 399-411, 2014. http://dx.doi.org/10.5894/rgci470.
PACHECO, J. P.; AROCENA, R.; CHALAR, G.; GARCÍA, P.; GONZÁLEZ PIANA, M.; FABIÁN, D.; OLIVERO, V.; SILVA, M. Evaluación del estado trófico de arroyos de la cuenca de Paso Severino (Florida, Uruguay) mediante la utilización del índice biótico TSI-BI. AUGMDOMUS, v. 4, p. 80-91, 2012.
PARANÁ. Governo do Estado. SEMA – Secretaria de Meio Ambiente e Recursos Hídricos do Paraná. Avaliação da qualidade da água através dos macroinvertebrados bentônicos: Índice BMWP. Curitiba,
2015. Available from: <http://www.meioambiente.pr.gov.br/ modules/conteudo/conteudo.php?conteudo=91>. Access on:
05 nov. 2015.
SANEP – Serviço Autônomo de Saneamento de Pelotas. Pelotas,
2016. Available from: <http://www.pelotas.rs.gov.br/sanep/>.
Access on: 14 mar. 2016.
SILVA, E. F. Condição tróica em rios do estado de Minas Gerais. 2012. 109 f. Dissertação (Mestrado) - Programa de Pós-graduação em Engenharia Agrícola, Universidade Federal de Viçosa, Viçosa, 2012.
SILVA, F. L.; MOREIRA, D. C.; BOCHINI, G. L.; RUIZ, S. S. Desempenho de dois índices biológicos na avaliação da qualidade das águas do Córrego Vargem Limpa, Bauru, SP, através de macroinvertebrados bentônicos.Pan-American Journal of Aquatic Sciences, v. 2, n. 3, p. 231-234, 2007.
SILVA, M. R.; GONÇALVES JUNIOR, A. C.; PINHEIRO, A.; BENVENUTTI, J.; SUSIN, J. Distribuição de nutrientes em sedimentos fluviais do rio Itajaí-Açú, Blumenau, SC, Brasil. Ambi-Água, v. 5, n. 1, p. 102-113, 2010. http://dx.doi.org/10.4136/ ambi-agua.123.
SILVEIRA, M. P.; BAPTISTA, D. F.; BUSS, D. F.; NESSIMIAN, J. L.; EGLER, M. Application of biological measures for stream integrity assessment in south-east Brazil. Environmental Monitoring and Assessment, v. 101, n. 1-3, p. 117-128, 2005. PMid:15736880.
SPERLING, M. V. Introdução à qualidade das águas e ao tratamento de esgotos. Belo Horizonte: Editora UFMG, 1996. v. 1, 452 p.
TOLEDO, L. G.; NICOLELLA, G. Índice de qualidade de água em microbacia sob uso agrícola e urbano. Scientia Agricola, v. 59, n. 1, p. 181-186, 2002. http://dx.doi.org/10.1590/S0103-90162002000100026.
TOMAZELLI, L. J.; VILWOCK, J. A. Mapeamento geológico de planícies costeiras: o exemplo da costa do Rio Grande do Sul. Gravel, v. 3, p. 109-115, 2005.
WETZEL, R. G. Limnology, lake and river ecosystems. 3rd ed. San Diego: Academic Press, 2001. 1006 p.
WYŻGA, B.; OGLĘCKI, P.; HAJDUKIEWICZ, H.; ZAWIEJSKA,
J.; RADECKI-PAWLIK, A.; SKALSKI, T.; MIKUŚ, P. Interpretation of the invertebrate-based BMWP-PL index in a gravel-bed river: insight from the Polish Carpathians. Hydrobiologia, v. 712, n. 1, p. 71-88, 2013. http://dx.doi.org/10.1007/s10750-012-1280-0.
Authors contributions
Edélti Faria Albertoni: Laboratory analysis, biological identiication,
data analysis, writing and closing the manuscript.
Cleber Palma-Silva: Field collection, laboratory analysis, data analysis, writing and closing the manuscript.
Claudio Rossano Trindade: Field collection, laboratory analysis, data analysis and writing of the manuscript.